Intro
Processing over 40,000 search queries every second, Google is by far the world's favourite search engine. As a result, building your business' presence on Google involves a deep analysis of how your website’s content matches what people are searching for. In this context, users' intent is represented by the keyword(s) they use, and your goal is to optimize your content and positioning accordingly.
Google offers you this opportunity through Search Console, a free tool that can be used to break down per keyword all the most important search KPIs of your website, such as impressions, clicks and position.
In this short guide, we’ll walk you through everything you need to generate a dynamic actionable report, that shows how your website performs per keyword searched. With the power of Rows, it will all be on a single spreadsheet, saving you time and effort in exporting from the Search Console dashboard.
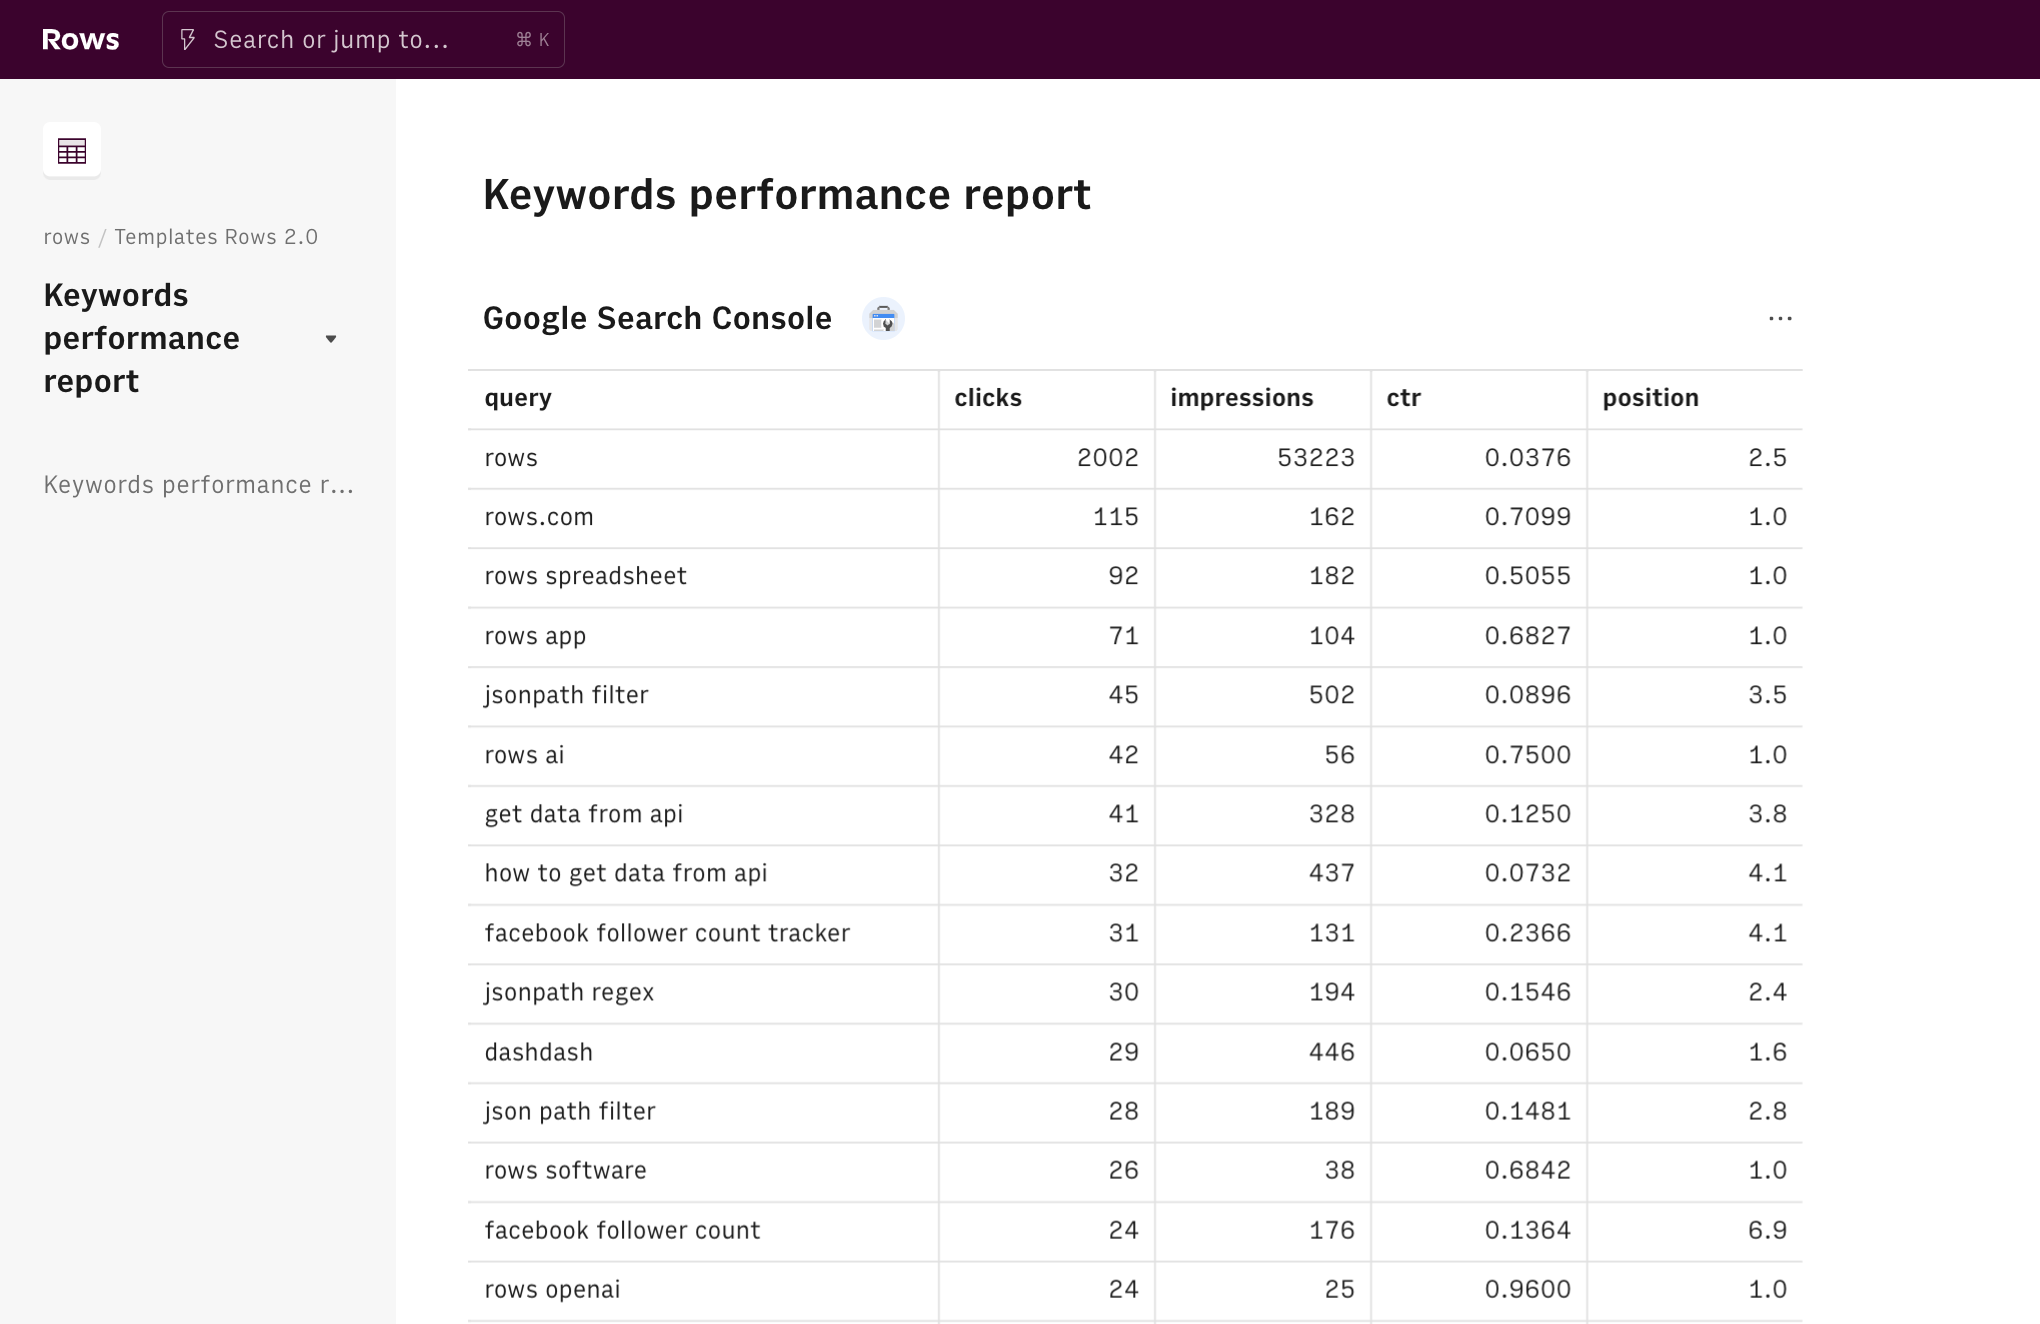
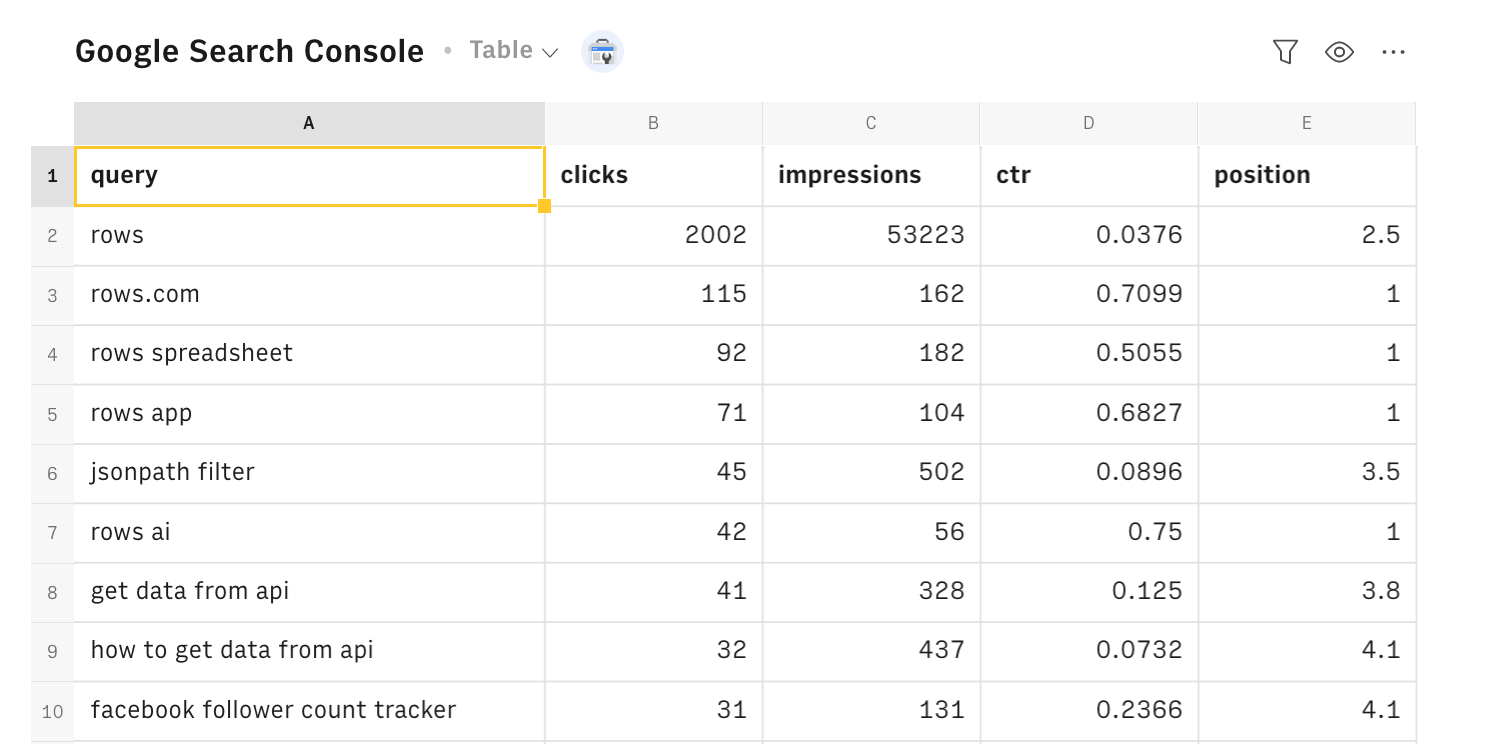
This is a sneak peek of what you will get:
What is Google Search Console
Google Search Console is a free tool designed by Google to help any website's owner to track and troubleshoot its appearance among Google search results. Among others, it allows you to quantify the amount of search traffic and monitor the keywords that led it to your website, along with the respective click-through rate.
Five are the most important sections of Search Console:
- Submit sitemaps. A sitemap is an XML file that serves as a table of contents of your website. It is used by Search Engines to index your website correctly and know what to crawl. Submitting and keeping it updated is important to optimize the so-called crawling budget, the time Google devotes to analyzing the content of your website.
- Error report. You should monitor this section frequently, as too many errors, such as 404 error or 500 error, among your website's pages can result in a sudden drop in valuable web traffic.
- Links report. This section is very relevant to monitor the results of your link-building activity: it offers you an overview of all main backlinks to your website together with anchor texts and other details.
- Performance report. Check all the main search KPIs, such as impressions, clicks, and position, breaking down data per page, keyword, device, etc
- Mobile usability report. Discover here if there are major flaws in your mobile usability or appearance, such as content wider than the screen, clickable elements too close to each other, text too small, ...
Let's go!
To understand how we’re going to build it, let’s go step by step.
First, you need to enable the Search Console integration. Click on the "Connect" button and follow the instructions
The typical Google Auth page will open: enter your credentials and authorize Rows to retrieve your data. Make sure your account is correctly linked to your Google Search Console.
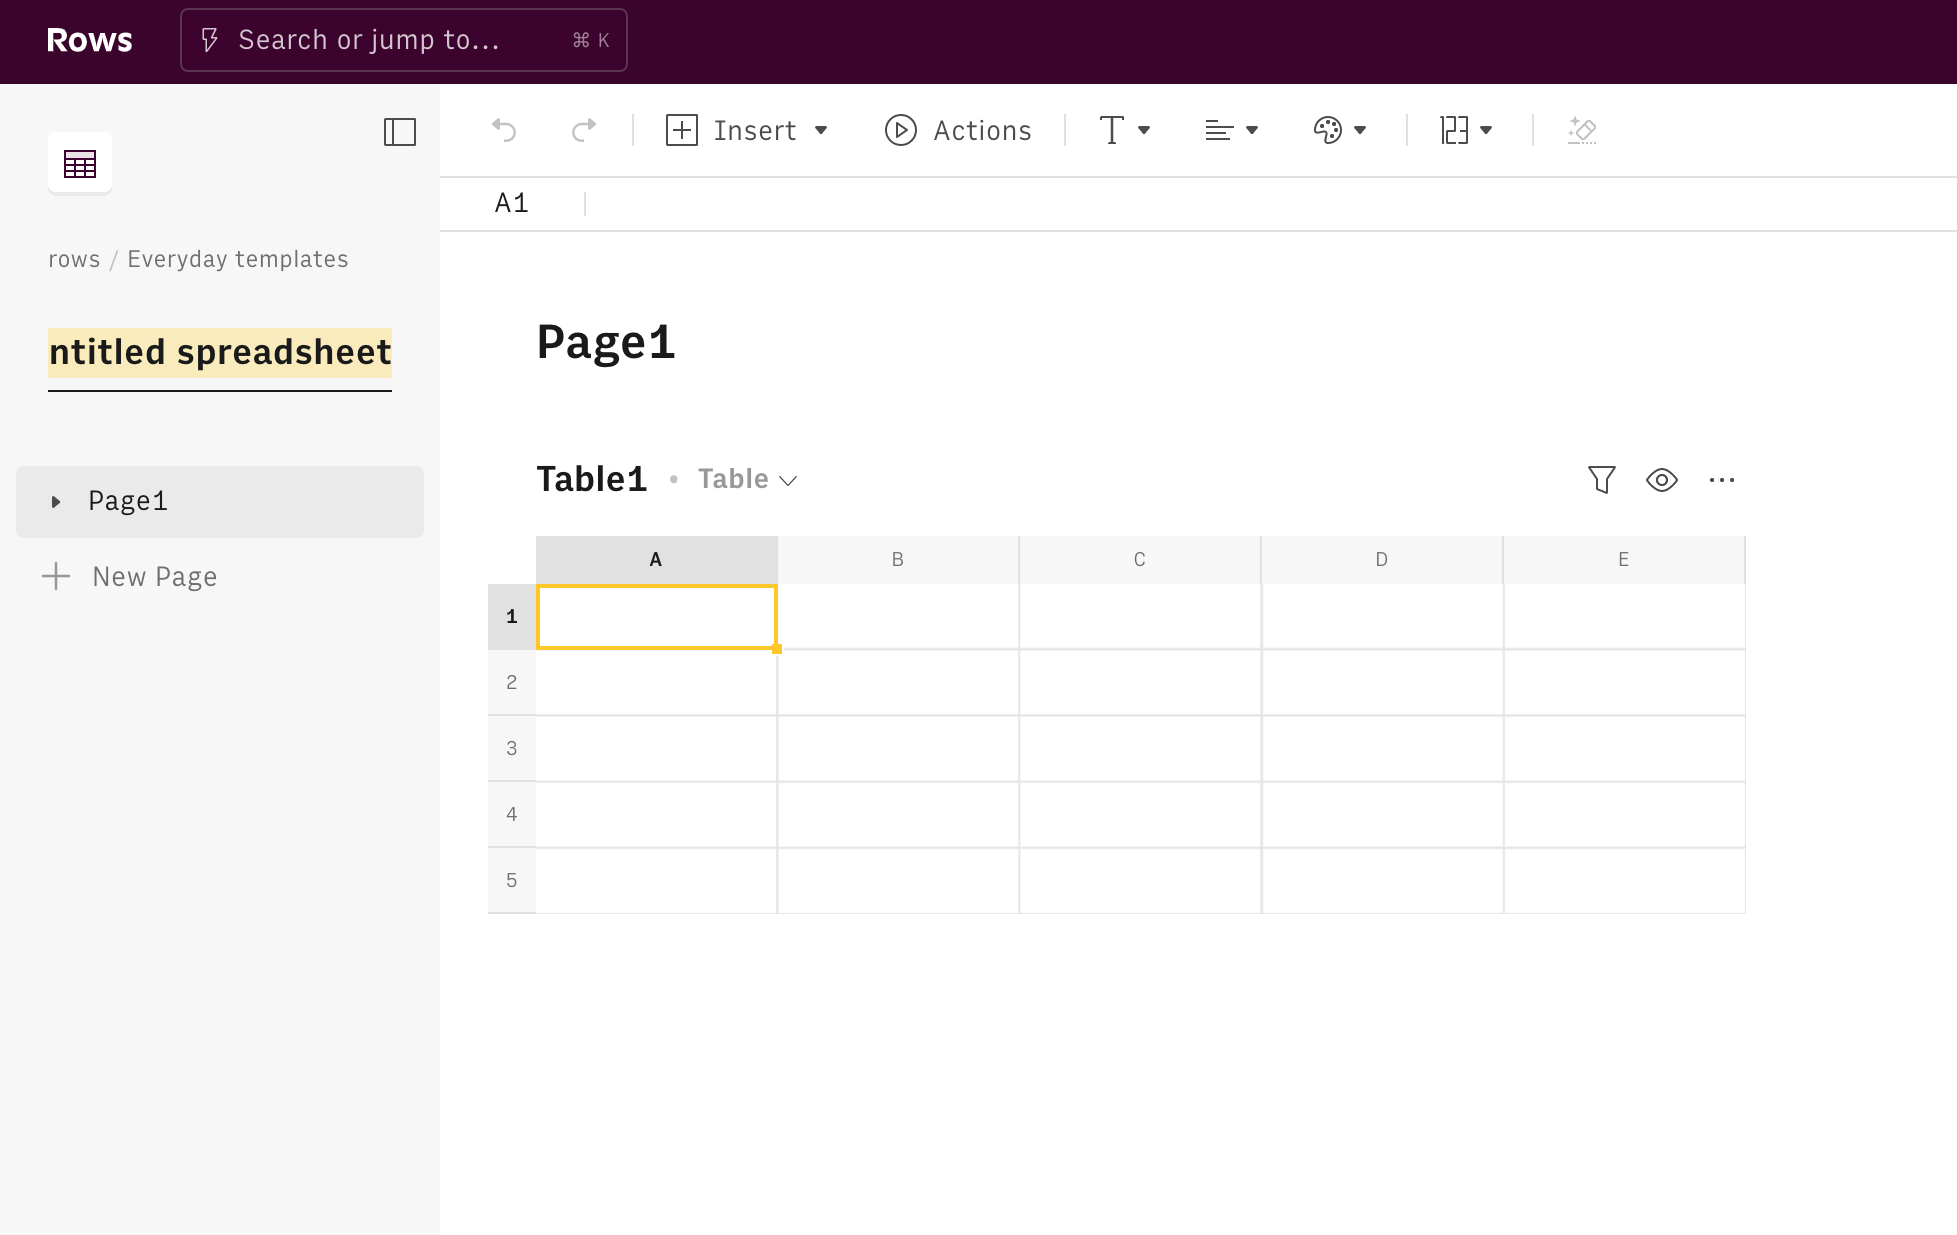
Now you are ready to set up your report. Click on the + icon on your dashboard.
Once you land on your spreadsheet, first of all, rename it: click on its title in the top left corner and type the new name. Use it also as a title for the first page, by pasting it on the page title. It'll be easier to find it later on.
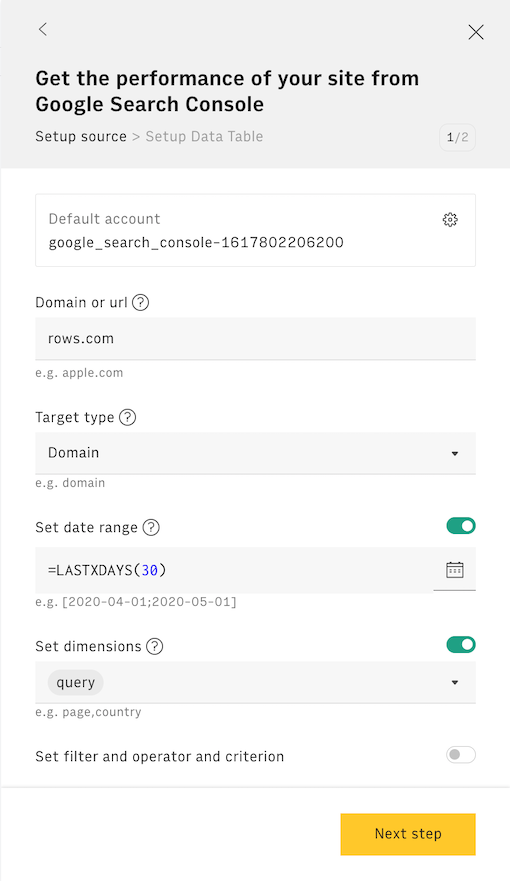
Then, click on the Action icon in the tool bar, and look for our GET_WEBSITE_PERFORMANCE_SEARCH_CONSOLE function. On the right-hand side of your display, the function wizard will show up. At the top, you can see the name of the integration you turned on in the first steps of this guide.
Simply type the domain of the website you want to examine as it's been registered in Search Console, pick property type, Domain or URL, as well as the time frames you want to search in.
In the 'Dimensions' field, pick Query: this will breakdown your report by the keywords used by users to land on your website
After clicking on the button Next step, Rows will guide you through the creation of the output table, to display the data retrieved from the integration.
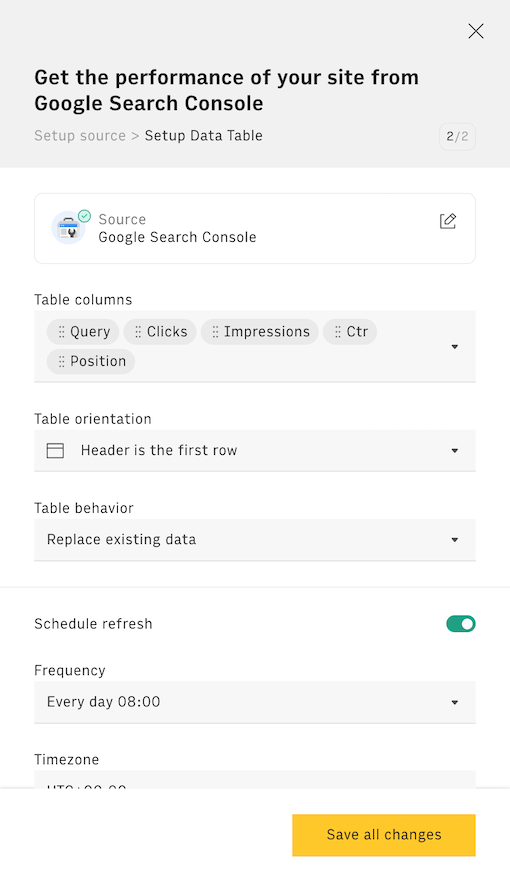
The first drop down will display the table's columns, based on the metrics you picked in the previous step. You can also set a refresh schedule to make your table fetch new data at a given frequency (e.g. daily, 'every day 08:00')
Once done, the table will appear immediately below the first one (that can be deleted for simplicity):
You can always rename the table's columns by simply clicking on the column titles. In case you need to reorder some of the table's columns, just select and drag them.
If you followed all the above points, you now have a table showing the main search metrics per query.
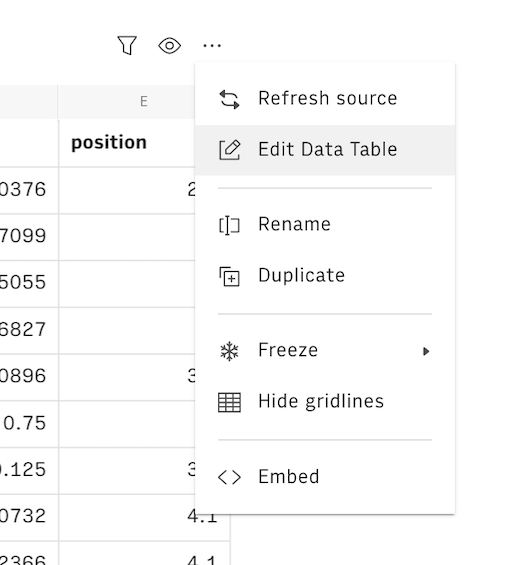
Of course, you can choose to set different dimensions - e.g. page, country, device. All you need to do is to go back to your Data Table and click on the "..." icon in its top right corner and then on Edit Data Table
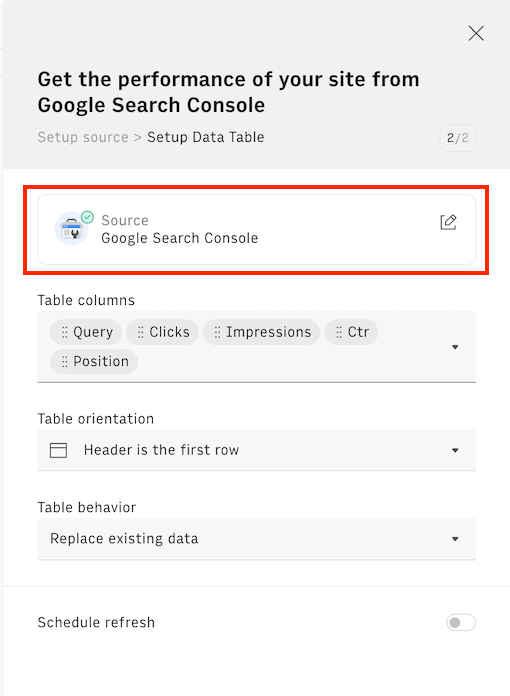
Once the right-end side panel will open, click on the data source Google Analytics to amend your configuration.
You might also like
Check also
Interested in SEO? Discover other guides:
- Monitoring your website search performance with Search Console
- Planning link-building activity
- Tracking on-page SEO elements
- Tracking your competitors’ website loading performance with PageSpeed
- Auditing your website loading performance with PageSpeed
Discover our Marketing playbook.