Google Analytics 4 Engagement Rate Report
Chart and compare which pages had the highest number of site visitors who stayed for 10+ seconds or triggered a conversion event.

 100% spreadsheet
 Connected to your data
 Daily+ refresh
 Embed everywhere
About Google Analytics 4 Engagement Rate Report
In Google’s Universal Analytics (the version before GA4), a bounce was when someone opened a single page on your website and left without clicking any links, buttons, or other media–even if they remained on the page for a long time. In Google Analytics 4, anyone who stays on the page for longer than 10 seconds (or clicks on a link, button, or other interactive elements) is considered “engaged”, which is the opposite of a bounce.
Engagement rate is the number of engaged sessions divided by the number of total sessions. So if your website was visited 10,000 times yesterday and 2,500 of those visits lasted longer than 10 seconds or included multiple pageviews, your engagement rate would be 25% (and your bounce rate would be 75%).
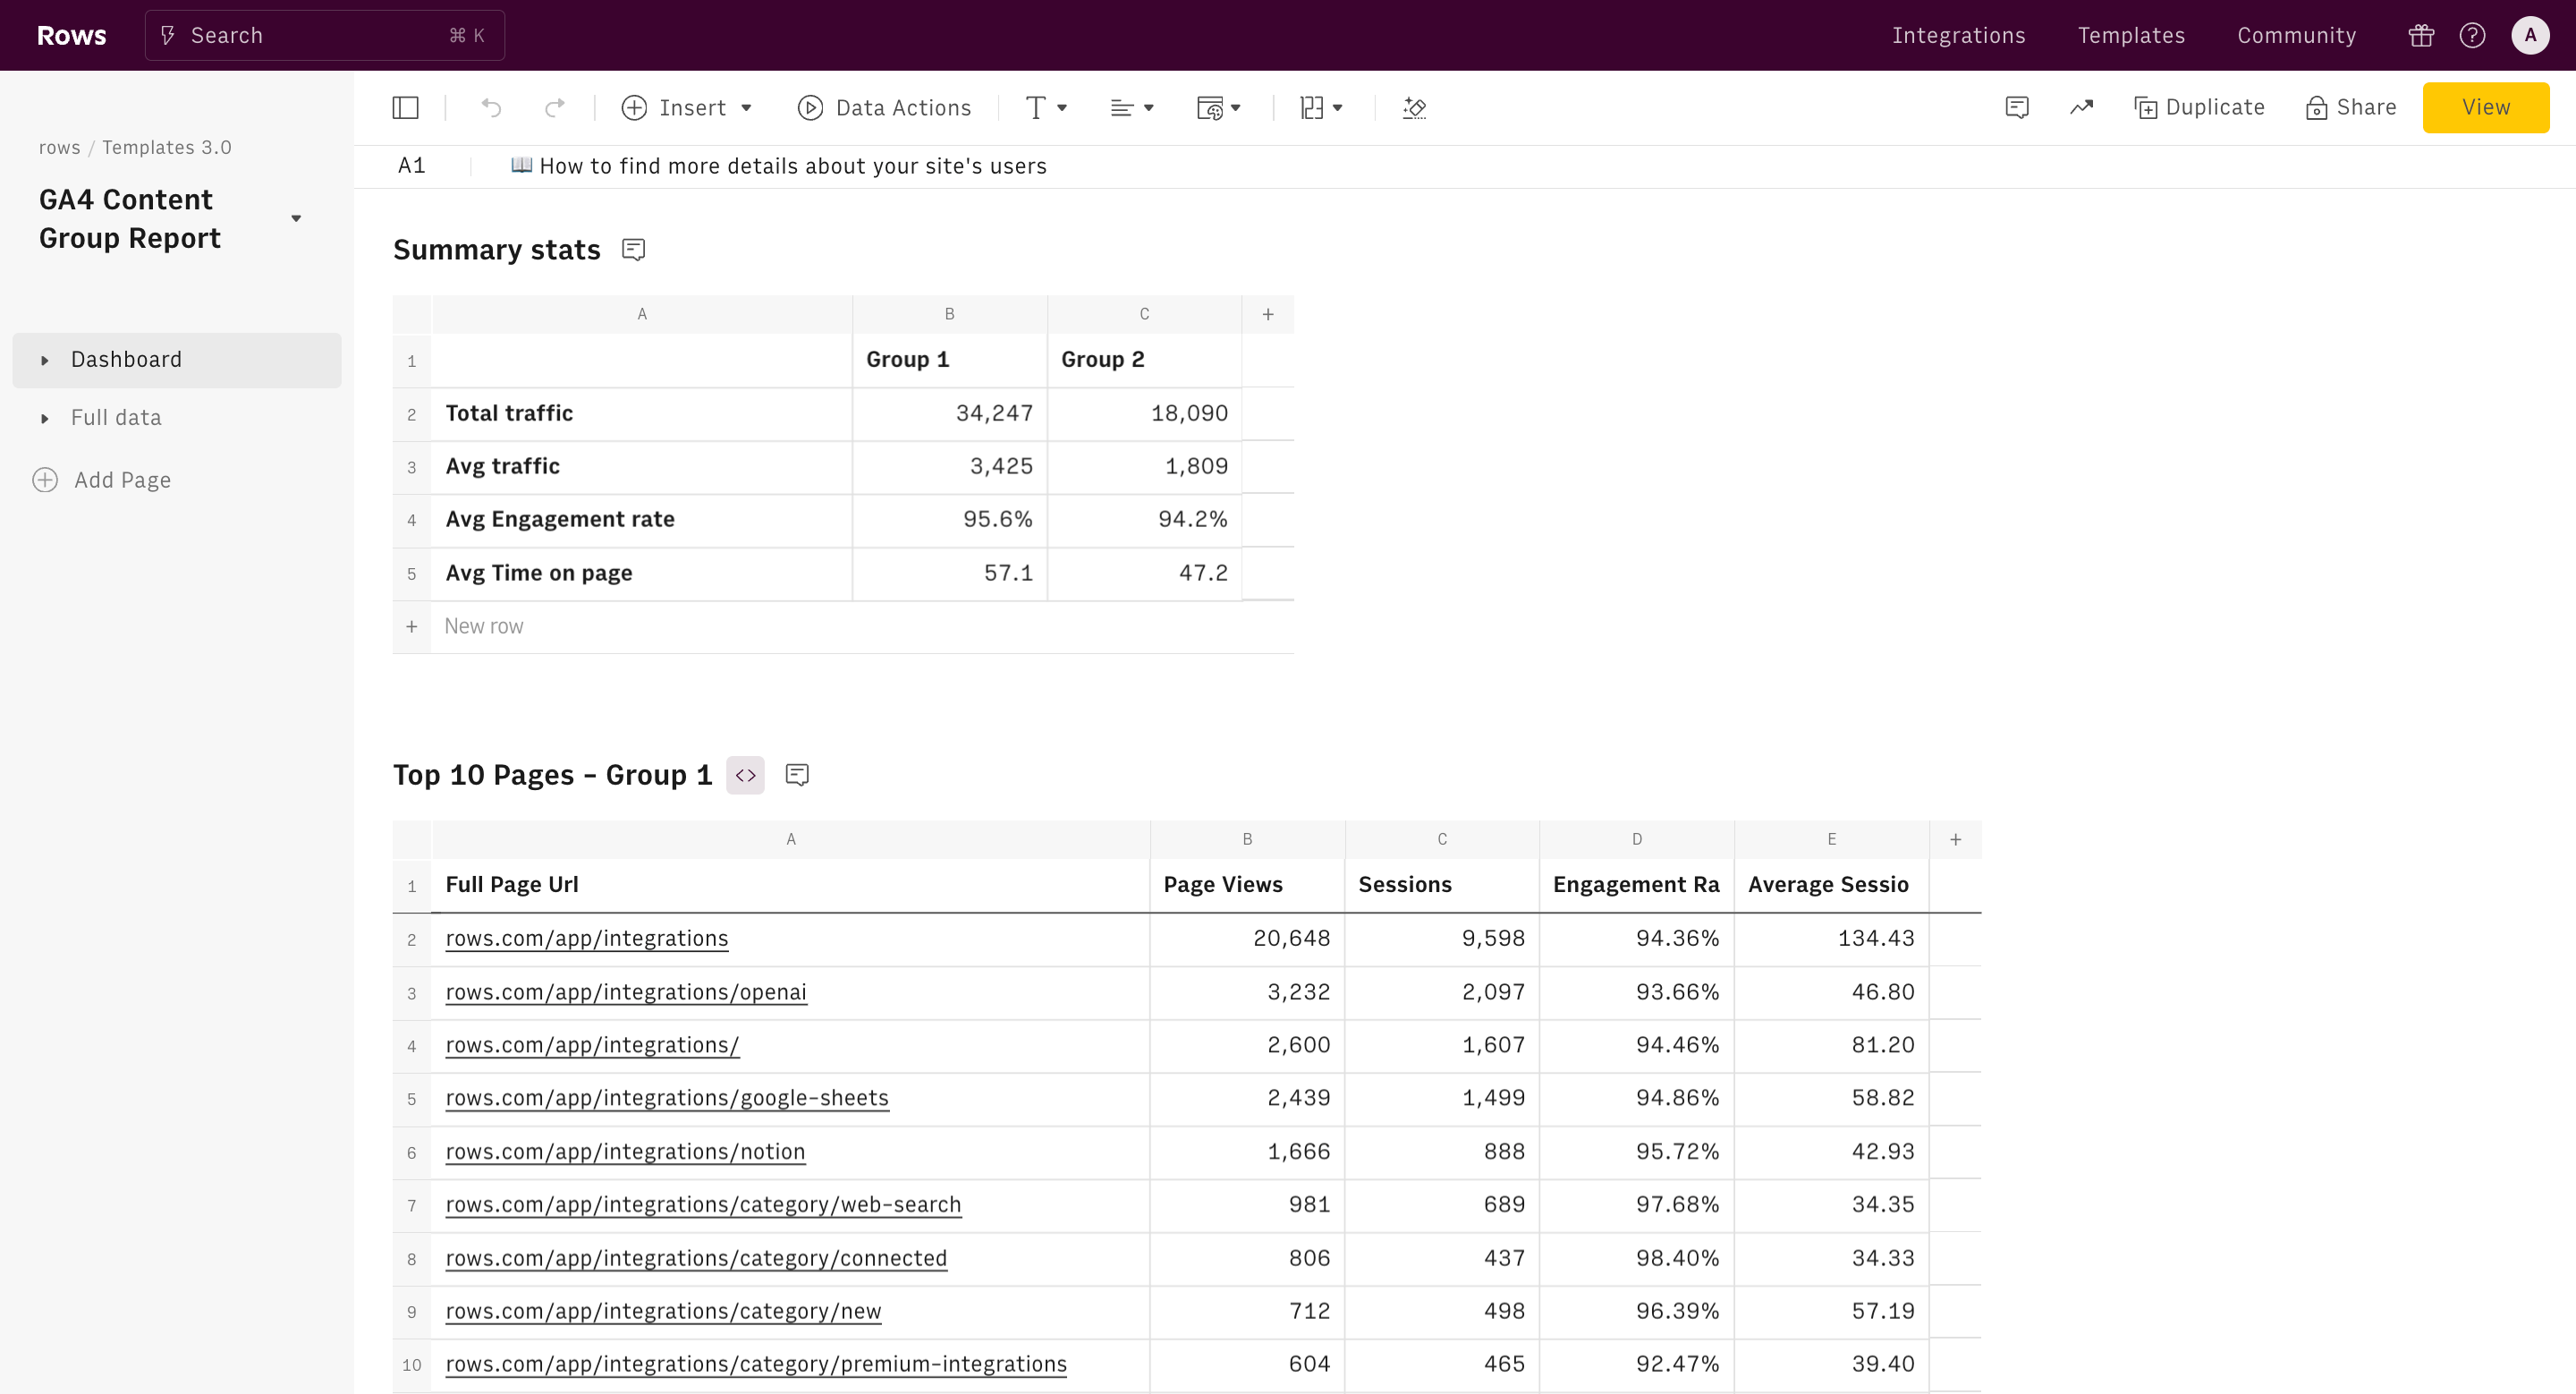
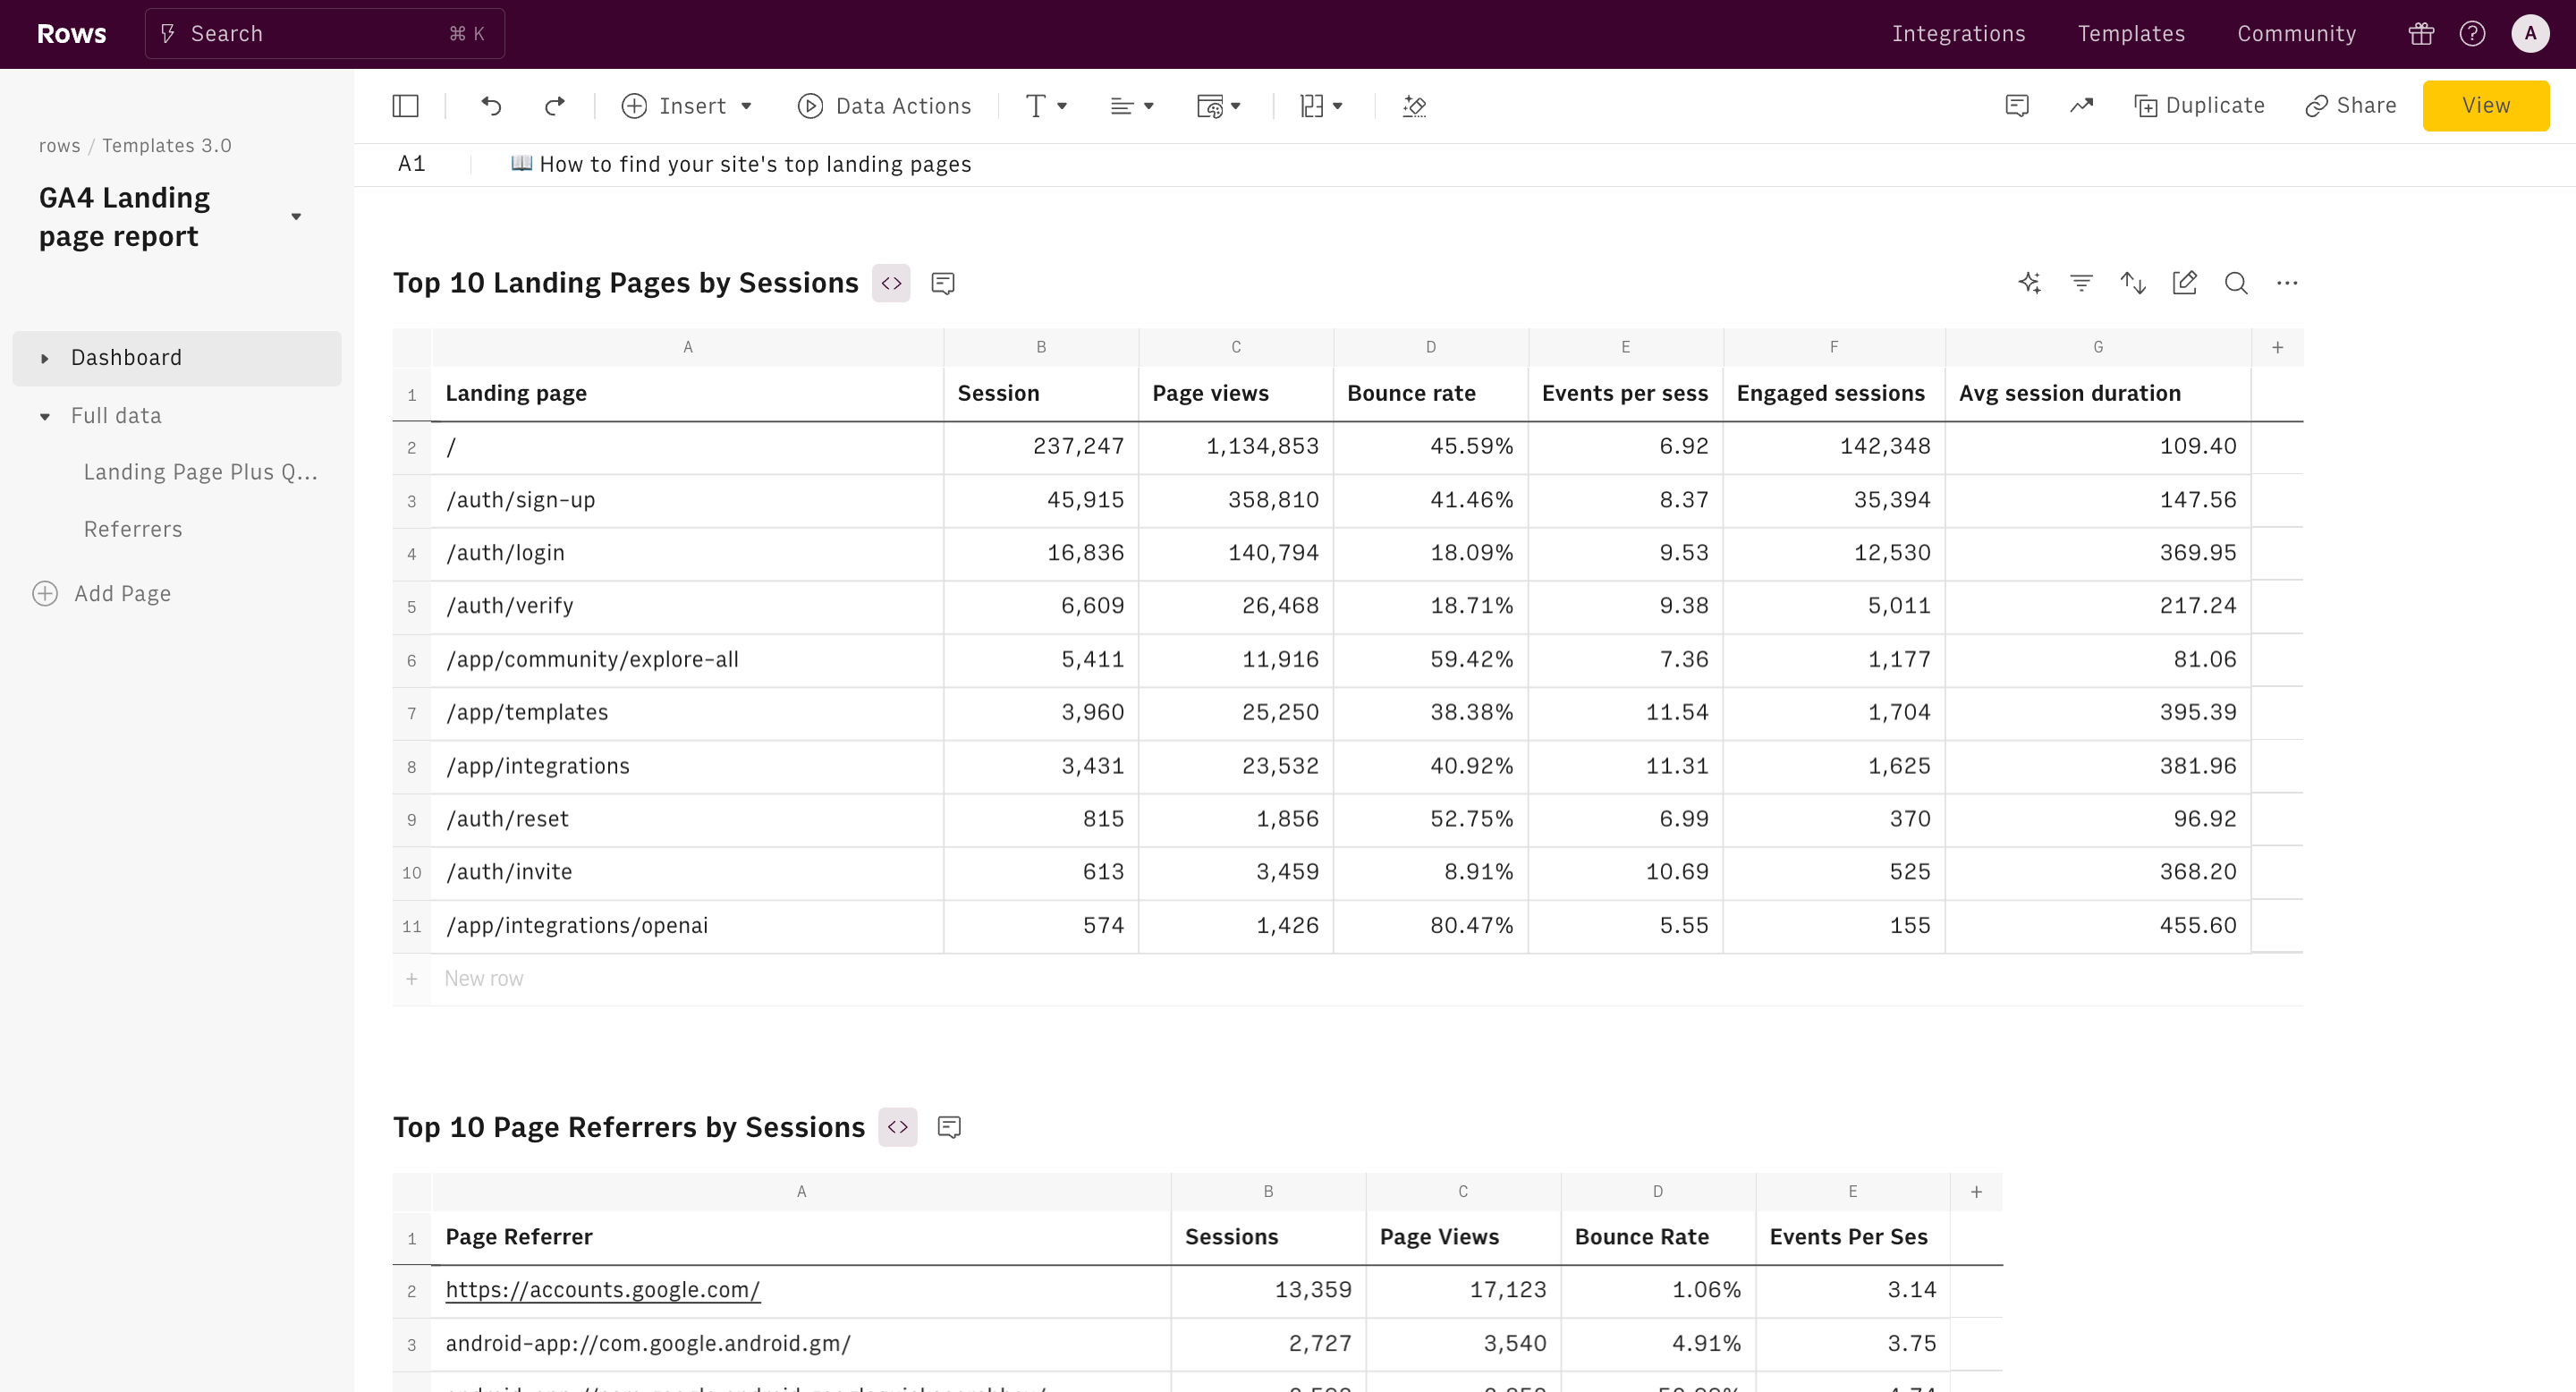
This template drills deeper into engagement rates by comparing the engagement rate and average engagement rate between two periods (e.g., this week vs last week), along with total engaged sessions, total users, and active users over the past week and month. It then drills down into engagement rate by device type, browser, operating system, and country. It also includes a bounce rate report, showing bounce rate over the set time period, bounce rate this week versus last week, and total number of non-engaged sessions on your site.
How it works


How it works
Get started
Click on 'Use template' and start using it right away. No forms, no signup. Your data first.
Connect your Google Analytics 4 account
Once landed on the spreadsheet, follow the instructions to connect the required integration and pick your account.
Customize the template and schedule refresh
Once the integration has been connected, all tables will update automatically with your own data. Click on 'Edit Source' to change the retrieved data and automate the data refresh. You can then insert a chart or a pivot table, add a column or personalize formats, using all the regular functions and shortcuts that make spreadsheets great.
Embed tables and charts
Click on the option menu to embed tables and chart on your Notion, Confluence or any other iframe-ready documents.


Questions and answers
Can I use Rows for free?
More than a Google Analytics 4 Engagement Rate Report
Rows is your new AI Data Analyst. It lets you extract from PDFs, import your business data, and analyze it using plain language.
Signup for free

Import your business data
Extract from PDFs and images, import from files, marketing tools, databases, APIs, and other 3rd-party connectors.
Know moreAnalyze it with AI
Ask AI✨ any question about your dataset - from VLOOKUPs to forecasting models - and surface key insights, trends, and patterns.
Know moreCollaborate and Share
Seamlessly collaborate and share stunning reports with dynamic charts, embed options, and easy export features.
Know more