10 Best Excel Alternatives & Competitors in 2026 (Jan update)

Users search for Excel alternatives when they want to visualize data better, get rid of any learning curve, or use AI in analysis.
Excel, being the oldest player in the data analysis industry, has surely built trust among hundreds of millions of users.
However, despite significant technological growth, Excel has failed to match modern documentation layouts and embed data integration and AI, leaving the platform with a significant learning curve.
In this article, I will explain why you need an Excel alternative and discuss some of the best tools on the market.

Your new AI Data Analyst
Extract from PDFs, import your business data, and analyze it using plain language.
Try Rows (no signup)Why Do You Need an Excel Alternative?
There are three main reasons why you might need an Excel alternative:
Excel is great for reading and transforming big chunks of data but lacks truly modern features when you want to visualize and share data.
Excel misses modern, plug & play data integrations
Excel misses a truly modern AI copilot to automate in and off the grid operations.
Let’s discuss each of these drawbacks in detail.
Reason 1. Excel Is Built to Transform data, Not to Visualize and Share It
Excel has been designed and built as an on-premise solution, and it’s now the go-to solution for most teams to transform and process data as an app, not to share or visualize data or collaborate with your team.
If I talk about showcasing data, Excel is a messy choice.
The infinite grid does not allow for a clean and elegant setup.
When you share something, you often get an element overlap problem.
Collaboration is subpar when compared with a competitor like Google Sheets.
Native embeds are missing.
Reason 2. Missing Automated Data Ingestion
Excel is one of the most used methods for analyzing and visualizing data. That’s because it’s one of the most flexible tools, whether it’s to compute a median, run articulated statistical analyses, or plot a chart.
If you’re an Excel user, you must be spending most of your time exporting CSVs or manually copying data from 3rd-party tools like GA4, Ads platforms, etc., and pasting it on Excel.
That’s because Excel lacks automation functionality.
The result? Often messed up, time-consuming, and suboptimal data reports.
Reason 3. Missing Native AI Functions
AI has been in talks since late 2022. Companies have come up with robust tools that leverage AI to interact with data and fasten the analysis process.
Excel has focused its efforts on integrating AI via the Copilot, a tool dedicated to automate spreadsheet operations and data analysis with the help of artificial intelligence.
However, as shown in our benchmark, it falls behind on many dimensions:
First-try accuracy: 47% of questions gave wrong or incomplete answers initially.
Dynamic output: mostly returns static numbers or charts disconnected from data.
Advanced analysis: Struggles with scenario modeling, clustering, and building relationships between datasets.
Model creation: Cannot consistently build predictive or analytical models.
Spreadsheet management tasks: Low reliability in sorting, formatting, or managing tables.
What Are the Top Excel Alternatives and Competitors?
Some of the best alternatives to Excel are:
Rows – The easiest way to analyze data on a spreadsheet.
Google Sheets – Free online spreadsheet editor.
Equals – Advanced spreadsheet editor that gives you complete control over your data.
Numbers – Spreadsheet editor for iOS users.
WPS Spreadsheet – Platform with a similar interface as Excel but better data analysis capabilities.
Airtable – Highly customizable and intuitive alternative to Excel.
OpenOffice Calc – Free open-source spreadsheet software.
Gnumeric – Open-source spreadsheet software with an interface similar to Excel.
Smartsheet – Enterprise-grade work management software.
Zoho Sheet – AI-powered spreadsheet app.
1. Rows
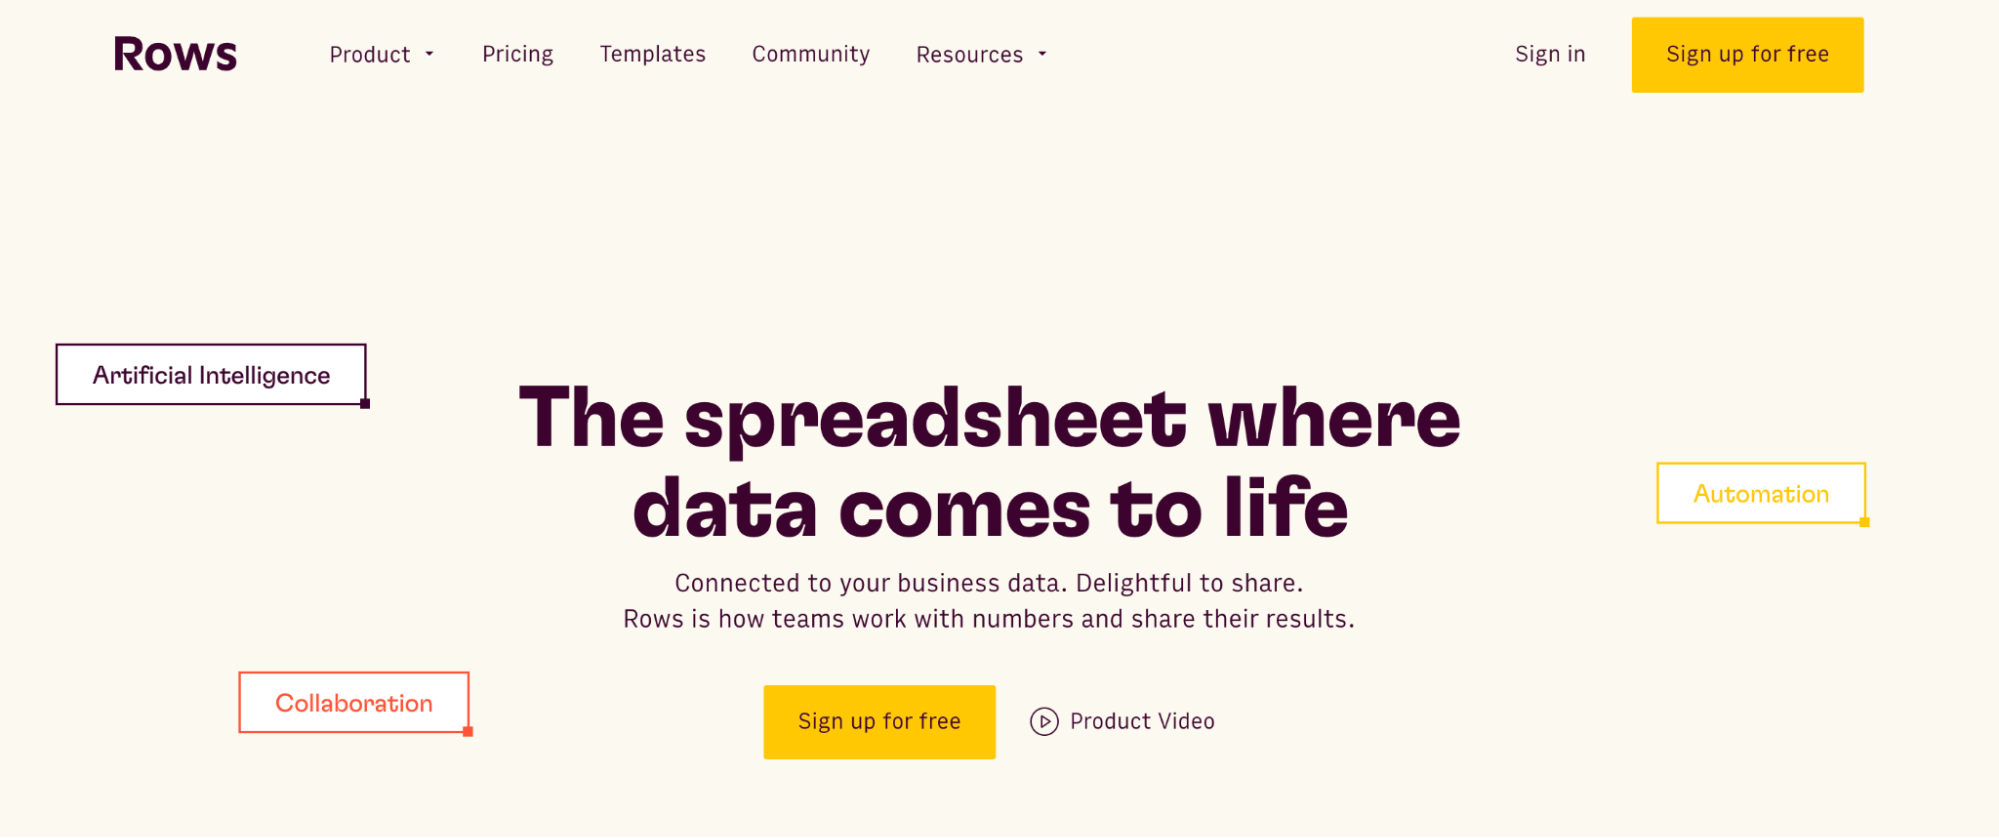
Rows is the way modern way teams work with data: from importing data directly from tools like databases and ad platforms to transforming with plain language and sharing it beautifully and error-proof.
It’s the new way teams at HP, AWS or Taxfix work with numbers and share their results.
Feature 1. AI copilot
Rows AI Analyst turns your spreadsheet into something closer to a data science environment. You describe what you want in plain language, and it handles the execution, whether that's spreadsheet operations, data transformations, or running Python code to do the heavy lifting.
It works across four key capabilities:
Spreadsheet-native operations Standard spreadsheet tasks—pivots, conditional formatting, new columns, charts—happen through conversation instead of clicking through menus or writing formulas.
Example prompts:
→ "Build a pie chart showing share of profit by product"
→ "Add conditional formatting rule to column D: red if <100, yellow if <150 and green if >150"
Data Ingestion Pull data directly from PDFs, images, or connected tools without manual copying and pasting.
Example prompts
→ "Import all transactions from my N26 account and classify them as: marketing, software, travel, other"
→ "Pull keyword data from the last 90 days from Google Search Console"
Multi-step plans String together multiple dependent steps—build a dashboard, create a calculator from scratch, or execute a series of operations where each step builds on the last.
Example prompts:
→ "Add a column classifying keyword position into brackets: [1-3], [4-10], [10+], then create a pivot showing average CTR by bracket"
→ "Build a simple dashboard showing the performance of sales people in the last quarter"
Code-level analysis When you need statistical analysis, machine learning, or custom visualizations that go beyond standard charts, the AI Analyst can write and execute Python code to get there.
Example prompts:
→ "How does my revenue change if my margin increases by 5%?" (what-if analysis)
→ "How many orders do I need to hit $100k, $500k, and $1M in revenue?" (goal-seek)
→ "Calculate correlation between keyword position and clicks, then show statistical significance"
→ "Run a k-means clustering model to segment customers by purchase behavior and visualize the clusters"
→ "Create a Sankey diagram showing traffic flow from source → landing page → conversion"
Instead of switching between tools or learning specialized syntax, you describe the analysis you want and the AI Analyst figures out how to execute it: it scans your dataset, understands the key variables, and provides what you need.
To access AI in Rows you can either
click on the ✨ icon, at the bottom right corner of your viewport: this will open a chat UI panel that will work across your spreadsheet. You can ask questions in two modes, Build or Chat, based on whether you want to actually creating elements or just have in-line answers.
use the ✨ icon at the top right corner of each element: a contextual menu with a few shortcut will open right away allowing you to perform quick actions like summarizing the content or beautify a table
See some side-by-side comparison with Excel:
Feature 2. Data Integration
Rows gives you 50+ data integrations that you can leverage to import and export live data seamlessly into/from the spreadsheet and set up automated data refresh.
Unlike Google Sheets, this requires no plugin; it’s a built-in native feature, and can be used also with plain language, as mentioned above.
Example of prompts:
SEO data: "
Pull page data from the last 30 days from Google Search Console, including only pages that contain /blog/"Finance data: "
Pull all transactions from my HSBC account and classify them into: software, marketing, travel expenses, revenue"Marketing data: "
Use GA4 data to rank the top sources of traffic from mobile in Brazil in the last 30 days"
Curious how Rows can do this? It handles JSONs in the grid and converts them into table format.
Here are a few examples of how to pull data from third party tools via AI in Rows:
And whenever the tool you want to retrieve data from is not in their catalog, Rows gets you covered. Thanks to the custom HTTP source, you can send GET, POST, PUT, and PATCH requests to any endpoint using basic or API token authentication methods.
You feel ready to try it yourself?
💡 Try to make a GET request yourself with our HTTP Request Tester: input the endpoint, the headers and params and visualize the content of the response in a cell.
Or watch the demo below:
Looking for an head start to test Rows integrations? Have a look to our gallery of templates, including our recent Google Analytics reports and OpenAI testers.
Feature 3. PDF/Image extraction
As mentioned above, Rows can ingest data directly from documents and images—not just as static imports, but as structured, editable tables.
It works with PDFs and multiple image formats (JPEG, PNG, HEIC...)
You can process batches at once rather than uploading files one by one.
All extracted data can get merged into a single table you can immediately work with, stay on separate tables or get appended to an existing one.
You can also add custom extraction instructions to pull exactly what you need. A very common use case is invoices management. By adding the prompt
"Extract date, vendor name, VAT amount, total amount, and description", Rowswill scan all documents and return a consolidated table with those specific fields—no manual data entry, no error, or formatting issues
Instructions can be enhanced automatically and saved for later. Watch the demo below:
Feature 4. A delightful layout
Rows layout lets you build elegant dashboards that are great to share. See an example of our investor dashboard (numbers are dummy).
Plus, you can embed tables and charts on a website, wiki, or other internal tools with ease.
It’s a simple 4 step process:
Choose Embed in the settings menu located in the right-hand corner of the element you want to embed.
Click the Share Privately toggle.
Click <> Copy code. You can use the Copy link to paste directly into tools that automatically embed via the link - e.g., Notion.
Paste the embed code on your website, wiki, or destination tool.
Learn how to use Embed in all the most recent documentation tools, like Notion, Confluence, and Slite.
Fan of Notion? Discover other embed use cases: how to create a chart in Notion and how to import a spreadsheet in Notion.
Pricing
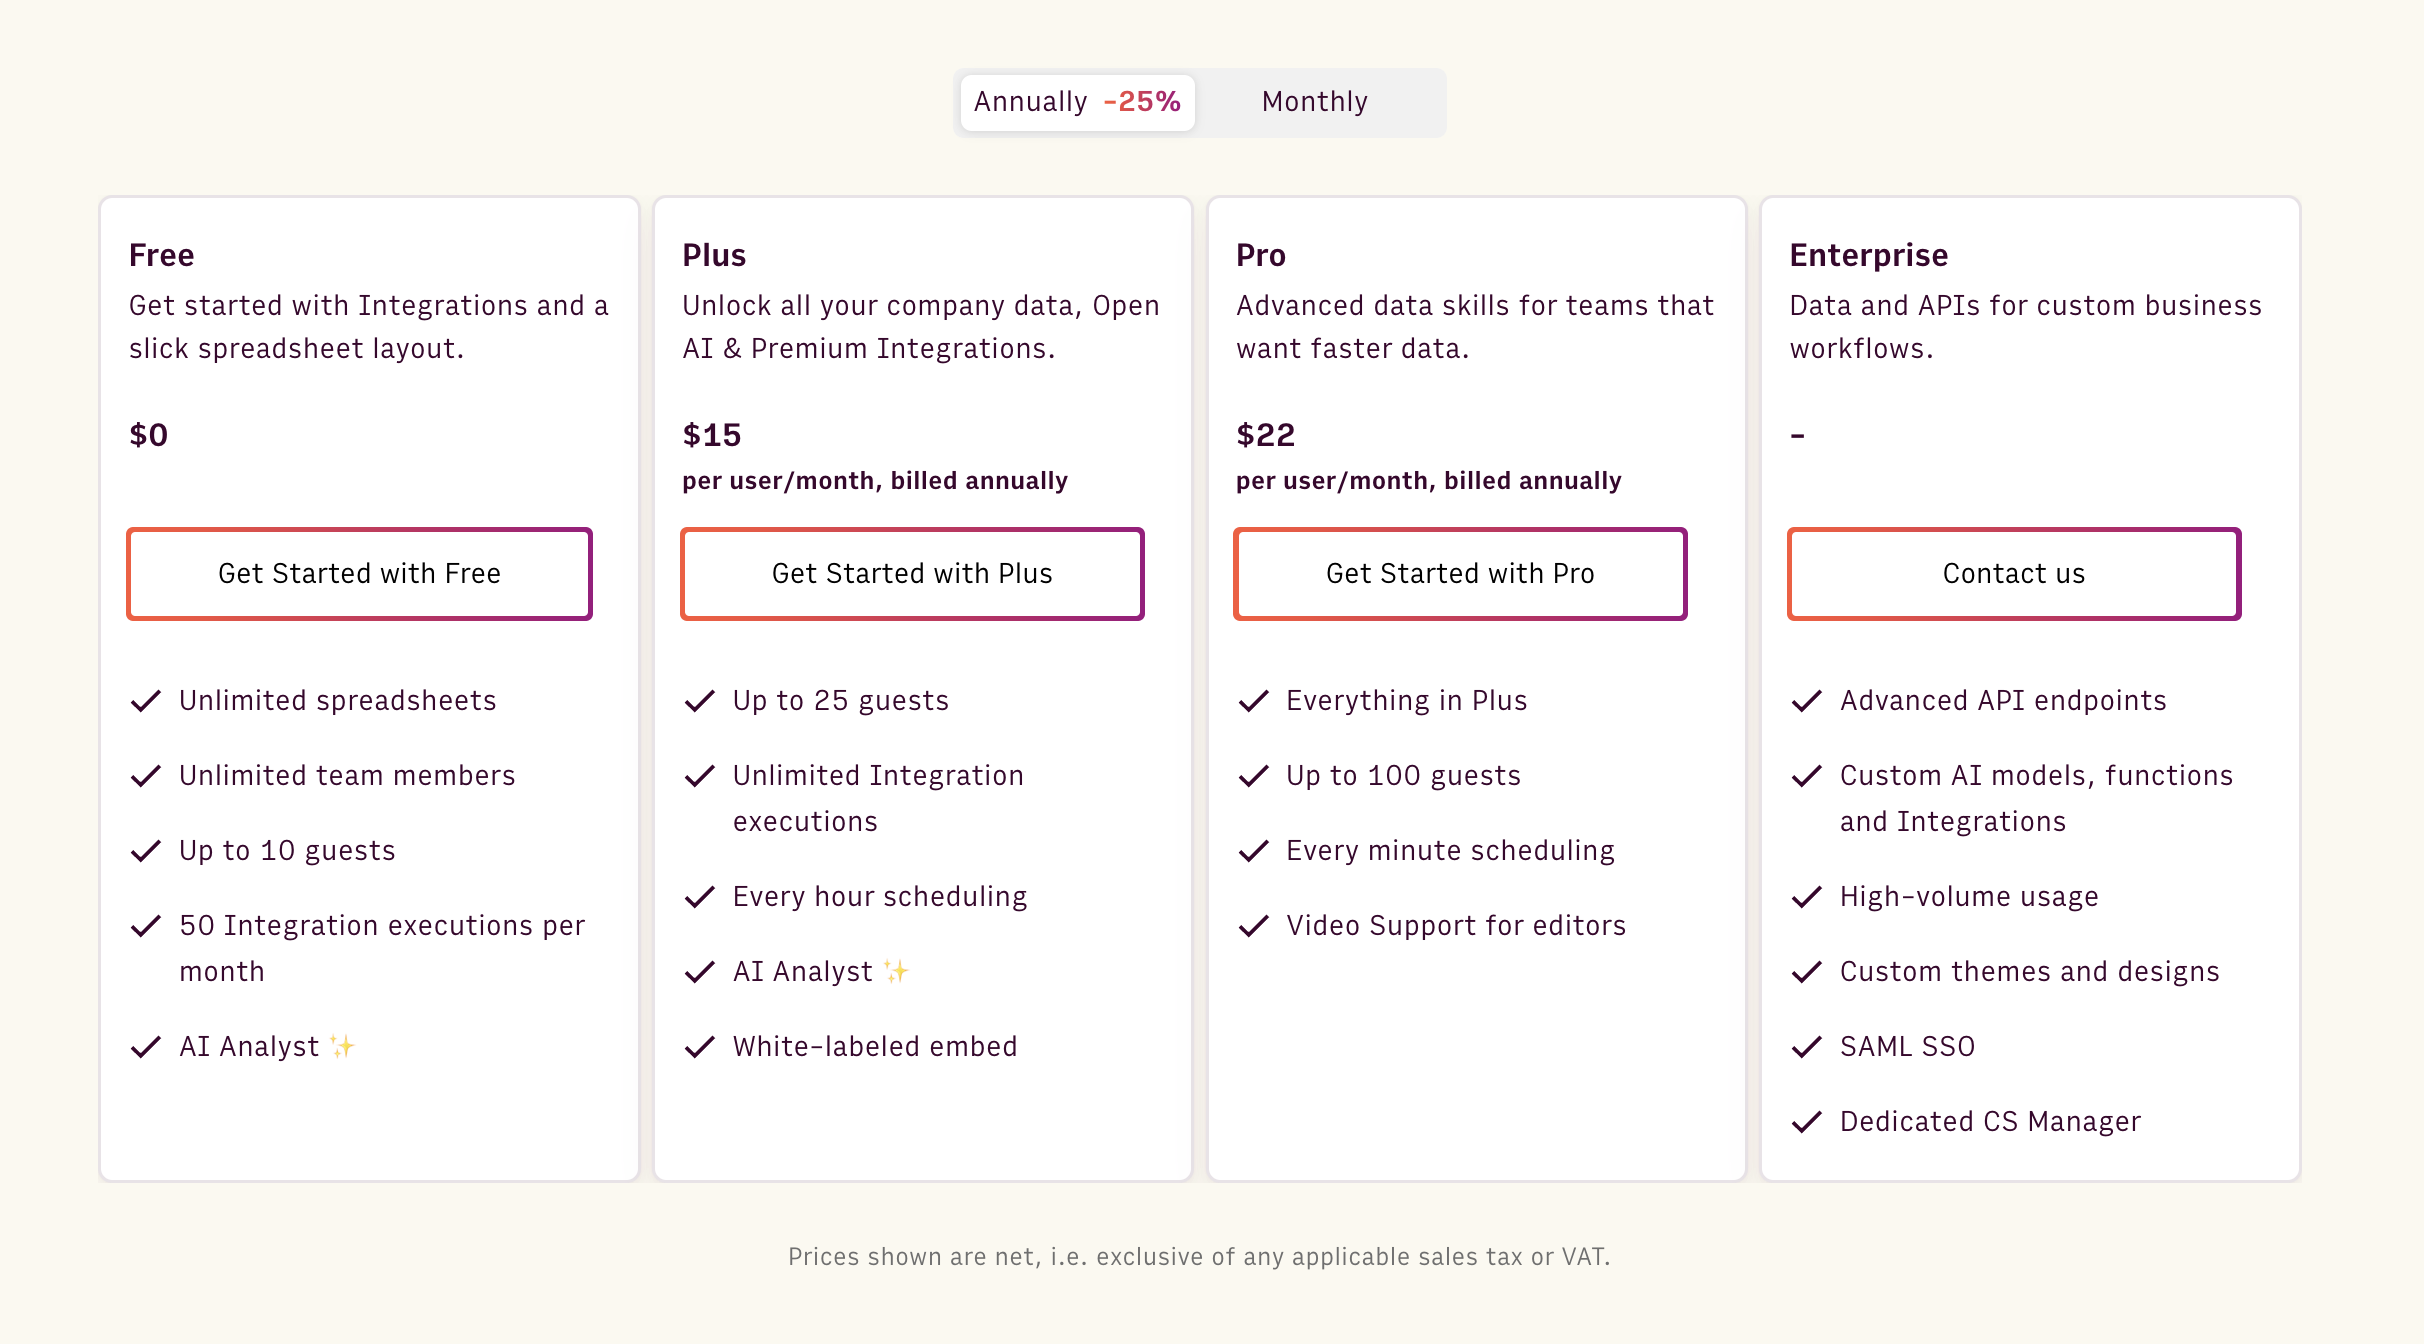
Rows has a free forever plan that lets you onboard unlimited team members, up to 10 guests, create unlimited spreadsheets, and execute 50 integration tasks per month. But if you want to use data integrations intensively, white-labeled embed, video support, and more, upgrade to one of the paid plans Rows offers:
Plus: 8$/month/member, up to 25 guests, limited AI usage, unlimited integration tasks & manual data refresh.
Pro: 79$/month + 8$/member, up to 100 guests, 200 prompts per month, unlimited integration tasks & daily data refresh.
Enterprise: Custom price for advanced APIs usage and workflows.
How Does Rows Compare to Excel?
Rows has data integration capabilities that offer 50+ integrations, helping you with live data import/export and automated refreshes.
The platform has done a great job integrating AI into its system with the AI Analyst.
These features help you highlight key elements from tables and charts, compute numerical insights from datasets, automate data pivoting, and set up - otherwise complex - formulas with ease. All you have to do is ask what you want in natural language to the AI, and it will take care of the rest.
However, Excel has a world-leading functions catalog with over 500 formulas, better pivot tables, and a desktop App that allows users to handle big chunks of data with ease and run complex statistical analyses.
When compared to Excel, Rows has a smaller function catalog, less flexible pivot tables, and limited performance with large datasets, though it's actively catching up on these areas. We will soon add support up to 1M cells and improve our Pivot Tables.
Pros and Cons
✅ The built-in AI integrations make Rows a beginner-friendly data analysis tool.
✅ Lets you make spreadsheets interactive using buttons, input fields, and data pickers.
✅ Has easy-to-use API so you can import data into Rows from anywhere.
❌ Rows does not have a desktop app, which caps its performance with big chunks of data.
Curious to see Rows in action? Get a head start with our Google Analytics templates, such as SEO Backlink Checker or Social Media Report. Wanted to try out ChatGPT on the grid? Use one of our templates and explore how to extract, classify or clean up data using only natural language.
Using Excel? Check out our guide on how to use ChatGPT
Your new AI Data Analyst
Extract from PDFs, import your business data, and analyze it using plain language.
Try Rows (no signup)2. Google Sheets
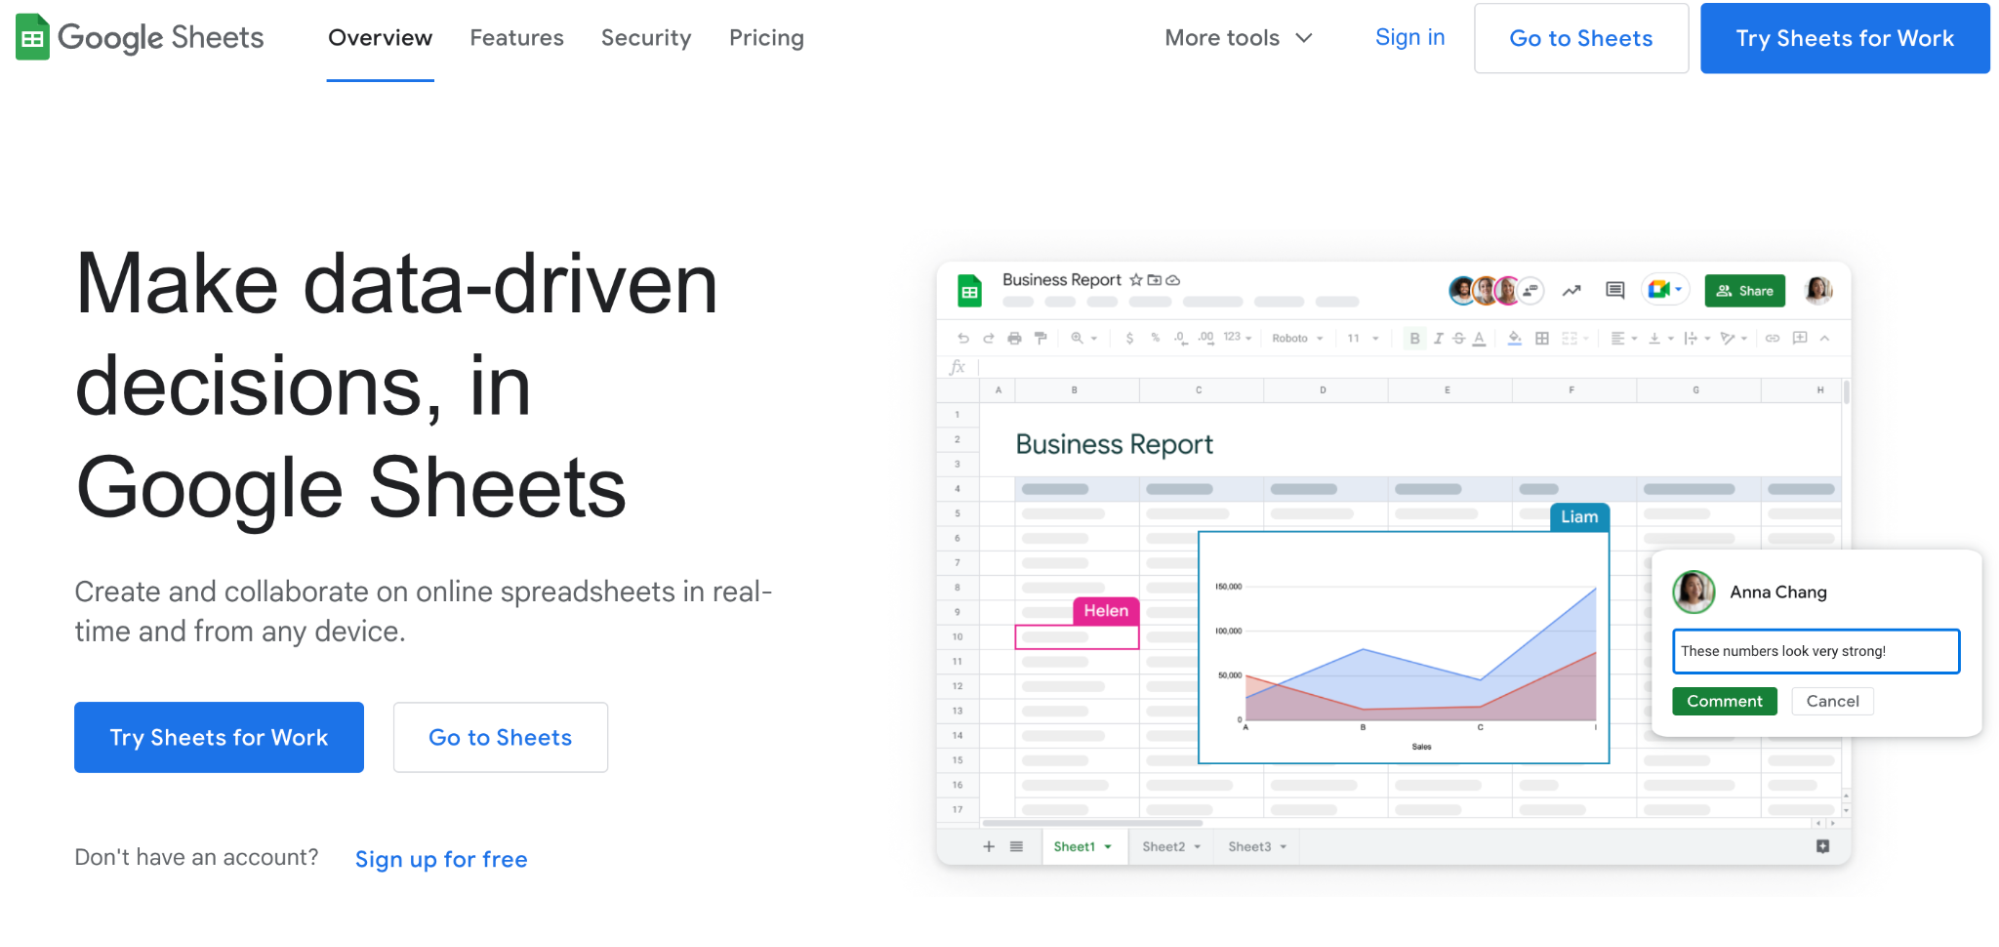
Google Sheets is a free online spreadsheet editor and a more intuitive version of Excel. Like Excel, which is accompanied by an MS 365 toolkit, Google Sheets is part of Google's Editor suite.
Features
Advanced data cleaning with cleanup suggestions, white space removal, and sorting options.
Choose from 30+ tracker and planner templates with built-in workflows and automation. Create custom apps and workflows using AppSheet or Apps Script.
Offers dedicated Google Workspace Marketplace for connecting third-party apps, like ChatGPT, Salesforce, and more.
Seamless integration with the Google app ecosystem. Easily collect Google Forms data in Sheets, create graphs, and add them to Google Slides and Docs.
Automatically saves edits in version history, making it easy to review or undo changes for a single cell or the entire spreadsheet.
Pricing
Google Sheets is free for personal use and comes with 15 GB drive storage but lacks dedicated customer support. It also has a business standard plan that you can subscribe to at $12 per user per month.
Pros and Cons
✅ Google Sheets is a web-based spreadsheet app, so it never has a versioning issue, no matter how many of you use it to collaborate on data.
✅ It has enhanced collaboration features like real-time comments, mentions, action items, and smart links with role-based control.
❌ When you have a large dataset and multiple people on the sheet, you can experience a serious slowdown.
Related reading: How to use ChatGPT on Google Sheets?
3. Equals
Equals is an advanced spreadsheet editor that gives you complete control over your data. It empowers you with AI tools and advanced functions to make working with spreadsheets less boring than Excel.
Features
Equals connects directly with your database, data warehouses, and other popular cloud apps.
Schedule queries to run automatically via built-in connectors; set up reports for scheduled distribution across Slack, Email, or Slides.
Use auto expand to automatically expand cells and update calculations and charts as you enter new data.
Has an AI-powered command bar assistant to input formulas, write SQL, debug, summarize data, update charts, ask questions, and do much more directly within cells using text-based inputs.
Lets you track, understand, and restore past queries using detailed version history.
Pricing
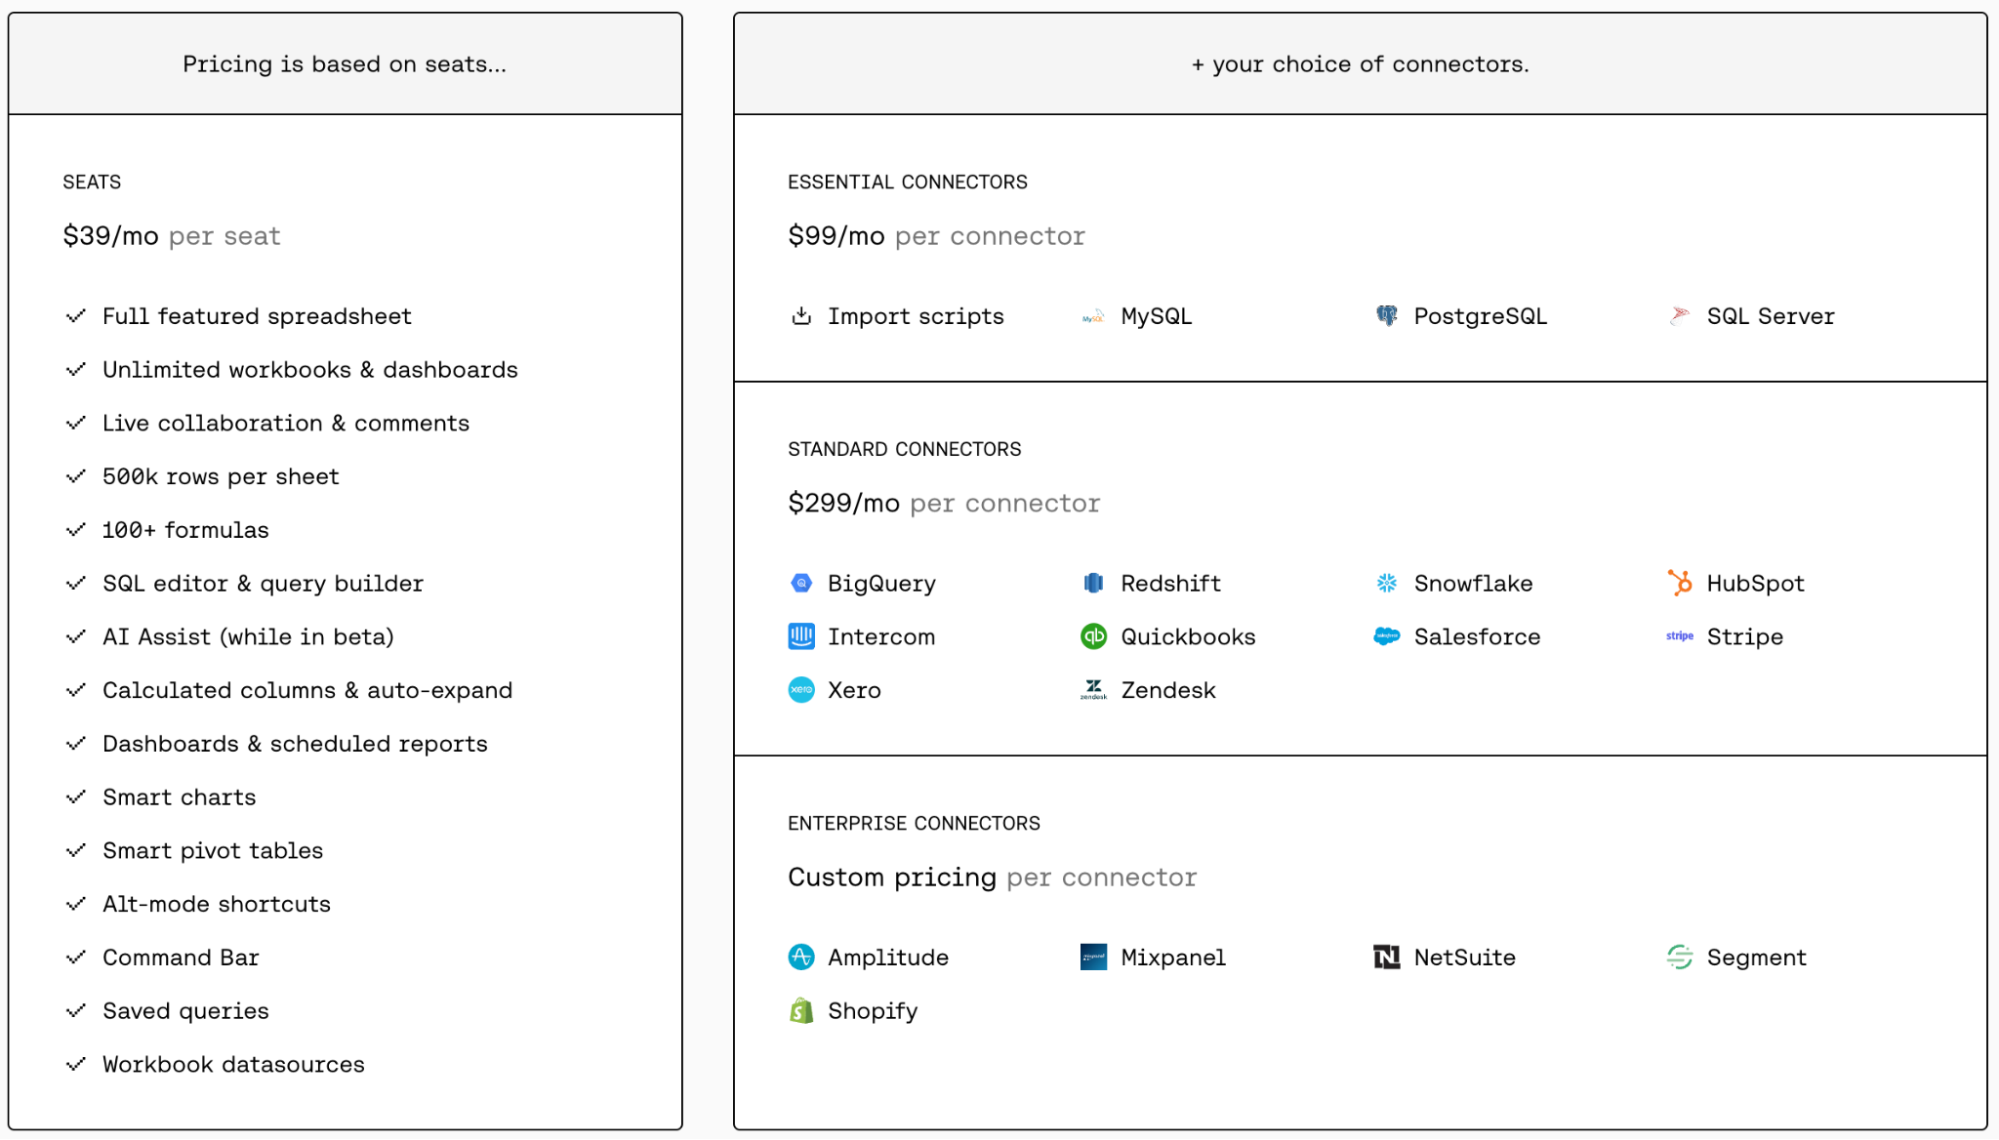
Equals offers seat-based pricing at $39 per month per seat. Every seat comes with full access to Equals, including unlimited workbooks, queries, and dashboards. In addition, it has three other connector plans to choose from:
Essential: $99 per month per connector
Standard: $299 per month per connector
Enterprise: Custom pricing
Pros and Cons
✅ Comes with integrated AI capabilities.
✅ Other than AI and advanced features, you'll find functions similar to Excel.
✅ A vast gallery of customizable charts and other data visualization elements.
❌ You must pay for each connector separately, making it an expensive tool.
4. Numbers

Numbers is an Apple-only spreadsheet editor available for Mac, iPad, and iOS devices.
The software allows users to create beautiful spreadsheets with impressive tables and images and includes features such as real-time collaboration, and Apple Pencil support for adding diagrams and illustrations.
It has a library of over 700 customizable shapes for data visualization.
Features
Use smart categories and pivot tables to quickly organize, group, summarize, and identify trends across data.
Choose from over 700 Apple-designed shapes and charts, customize them for colors and size, or sketch new shapes and diagrams using Apple Pencil.
Use powerful sorting and filtering features to find duplicates, unique values, blank cells, and more.
Numbers lets you embed videos and play them from your spreadsheet without opening a web browser.
Compare, combine, and match values and text using hundreds of preset functions like RegEX, LookUp, Switch, and more.
Pricing
Numbers is a free-to-use, in-built tool for Mac users.
Pros and Cons
✅ With Numbers, you can import, edit, and collaborate over Excel files.
✅ Allows you to customize the toolbar.
✅ Supports offline collaboration (changes get synced when you come online).
❌ Only built for Apple users.
5. WPS Spreadsheet
WPS Spreadsheet is one of many products of WPS Office Suite that has a free plan that’s a powerful alternative to MS Excel. With a similar interface, the platform is easy to navigate and work with.
Features
WPS Spreadsheet supports 15+ Excel file formats, including .xlsx, .xlsm, .csv, and more, making it easy to edit and share Excel files.
Offers various tools for data analysis, such as the ability to summarize key findings, highlight important metrics, organize data categories, and present data insights using bullet points within cells.
Has 700+ visual-rich spreadsheets and reporting templates for critical business purposes, like tax management, financial statements, employee attendance, and more.
One-click conversion of data-heavy spreadsheets into high-quality PDFs ensures secure and convenient sharing of financial reports, invoices, and other important documents.
Create forms using preset form-building elements like group boxes, buttons, checkboxes, option buttons, and more interactive elements.
WPS AI enables you to use text-based prompts to generate formulas, explanations, charts, summaries, and insights from data.
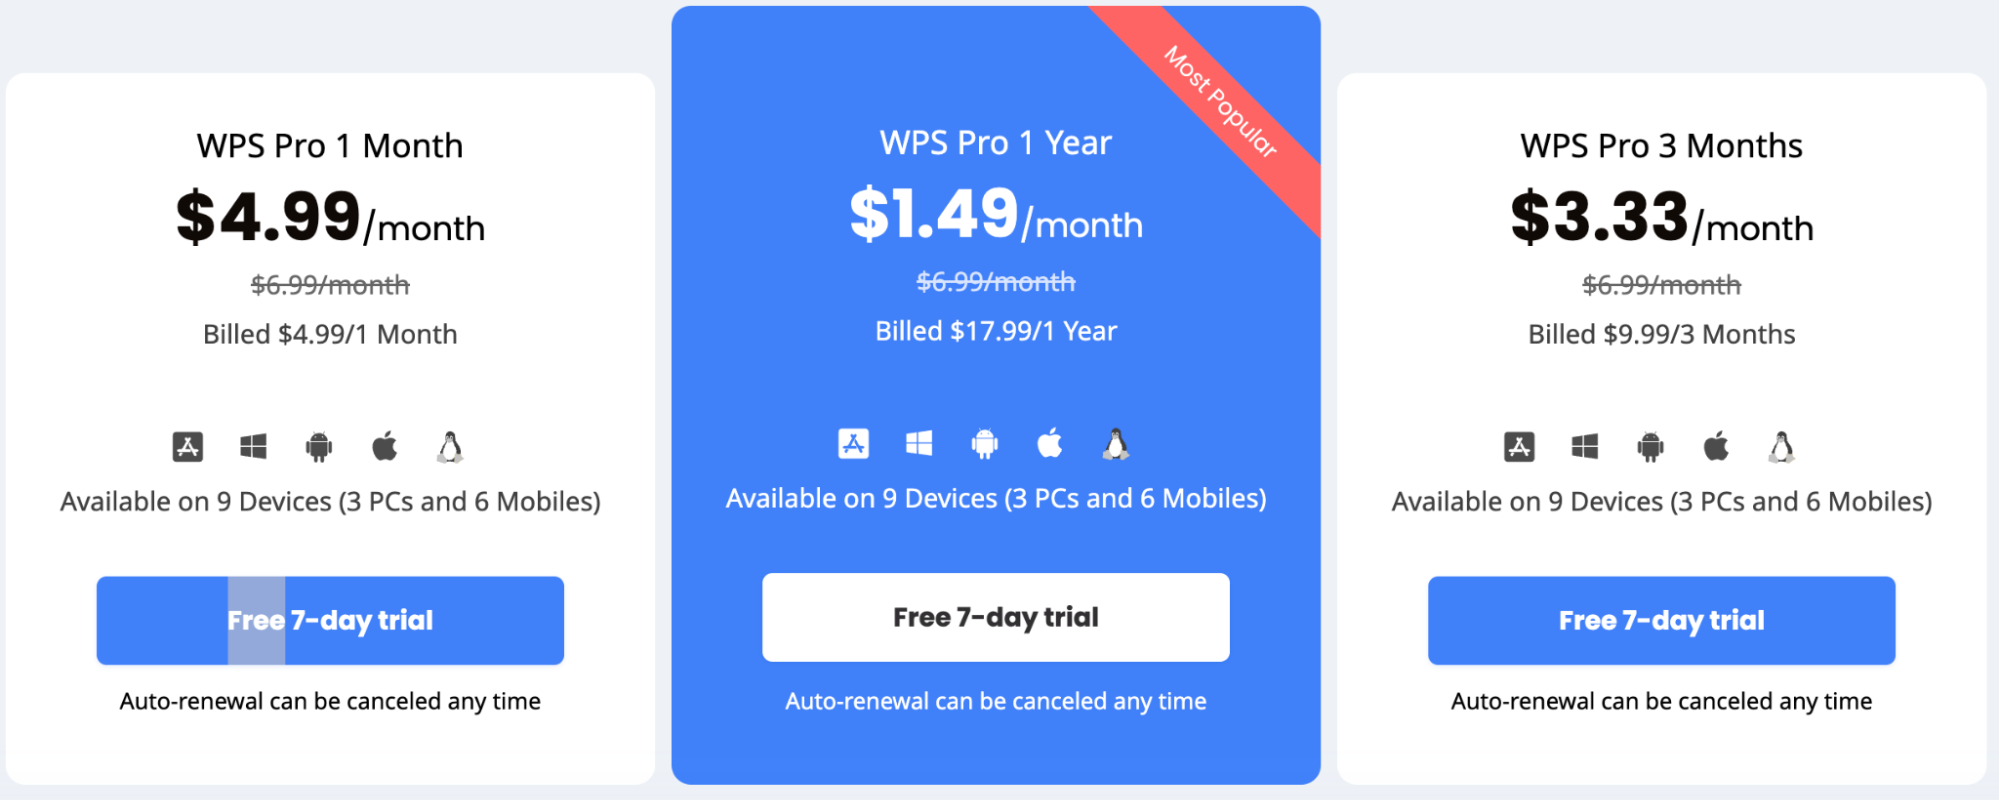
Pricing
WPS comes with a free plan, but it's pretty limited. If you want to use WPS long-term, you can choose from one of its paid plans:
WPS Pro 1 month: $4.99 per month
WPS Pro 3 months: $3.33 per month
WPS Pro 1 Year: $1.49 per month
Pros and Cons
✅ Offers AI-powered optical character recognition (OCR) to convert images to text.
✅ It has a built-in invoice maker for creating professional-looking invoices.
❌ It takes longer to render large or complex data analyses.
6. Airtable
Airtable is a highly customizable and intuitive alternative to Excel. It's much easier to use and offers a variety of views and advanced features for managing and organizing data.
Features
Has a gallery of preset templates for tracking and planning data without starting from scratch.
Use Extensions to present your spreadsheet in real-time via a dashboard with charts, graphs, and other visual elements.
Integrates with 1,000+ third-party applications, including Jira, Box, Dropbox, Email, Zendesk, and more.
Airtable AI lets you analyze, summarize, and extract meaningful insights from large data blocks within seconds.
Has a visual workflow builder for connecting apps and building multi-level automations using triggers and action elements.
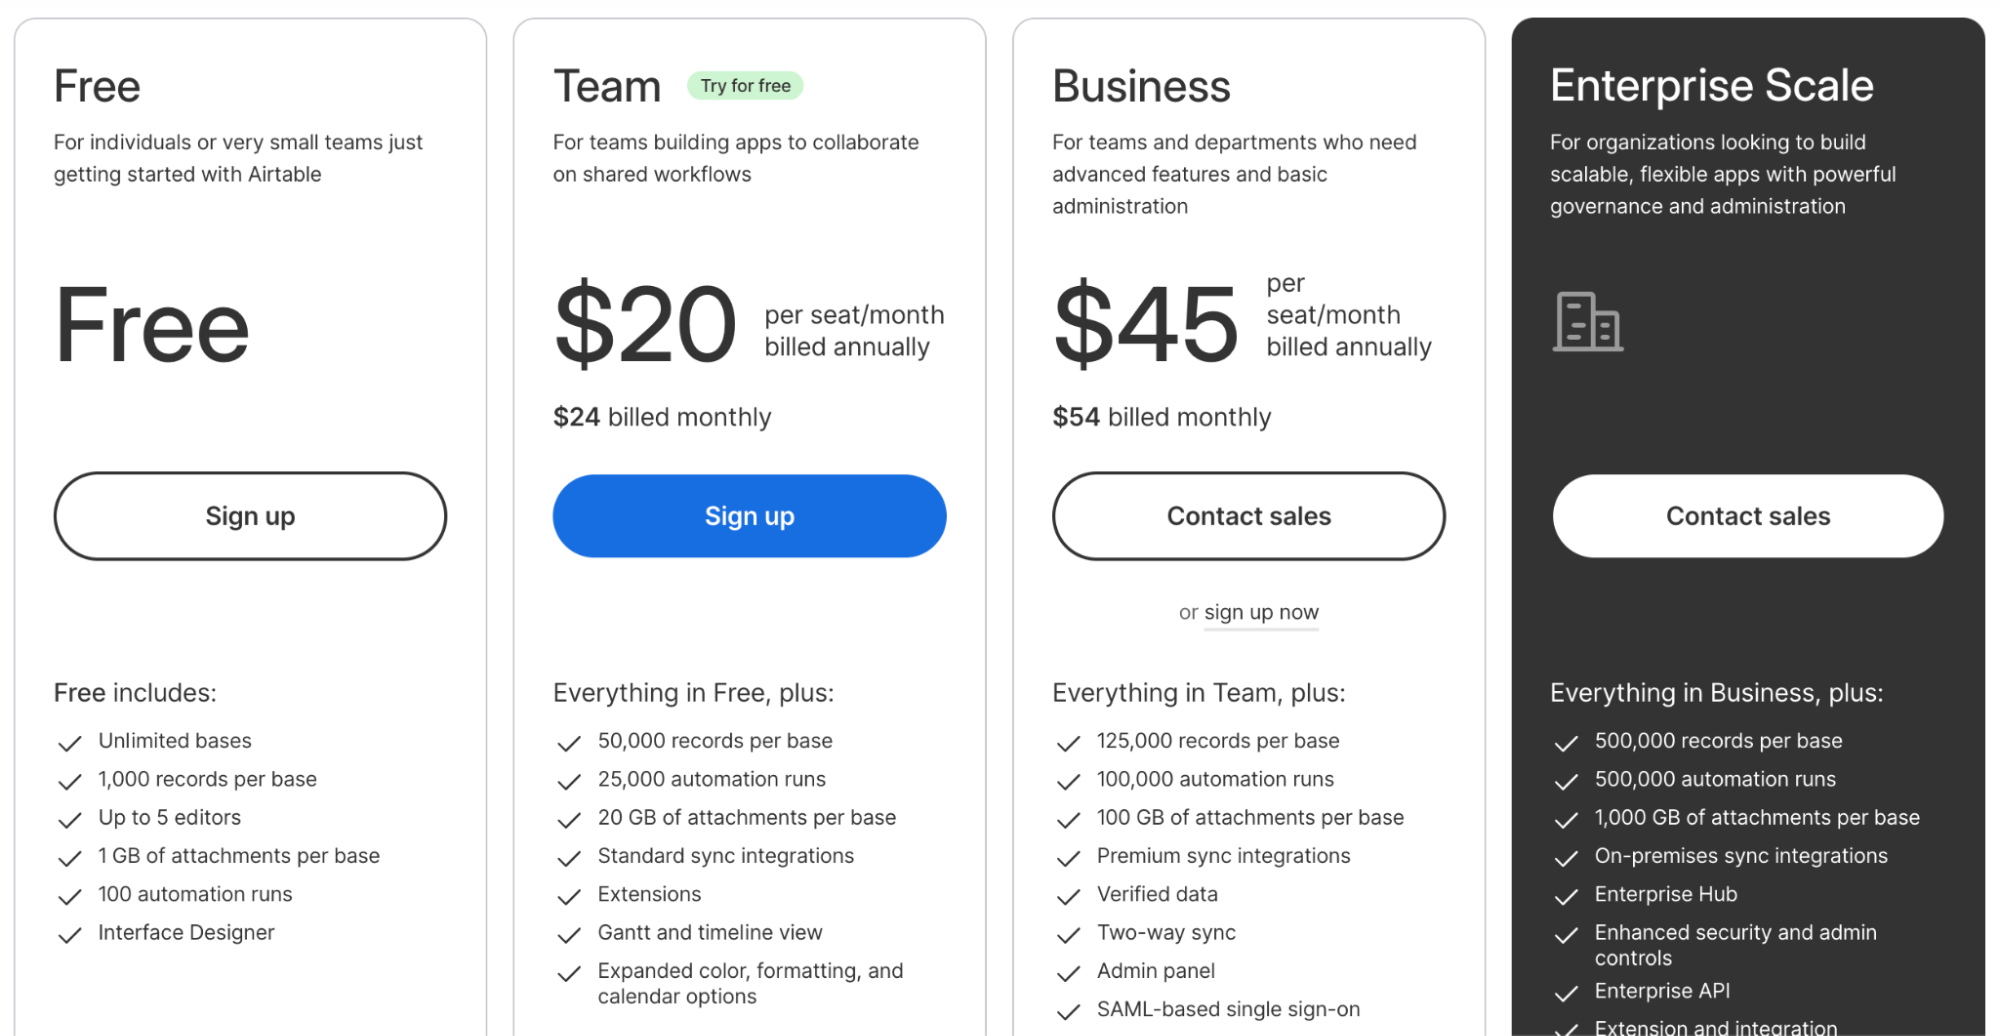
Pricing
Airtable offers a free version with unlimited bases, 1,000 records per base, and 5 editors. It also has three paid plans:
Team: $24 per seat per month
Business: $54 per seat per month
Enterprise: Custom pricing
Pros and Cons
✅ Has integrated AI capabilities.
✅ An easy-to-use workflow builder to automate data operations.
✅ Boasts a large number of integrations and templates.
❌ Lacks customization options, especially with graphs and charts.
7. OpenOffice Calc
OpenOffice Calc is free open-source spreadsheet software that lets you create, edit, and view Excel spreadsheets in XLS and XLSX formats.
Features
Calc has flexible cell formatting options, including freely rotating elements, templates, backgrounds, borders, and more.
Describe formulas in natural language and let Calc convert them into equations.
Use scenario manager and solver tools to perform complex data analysis involving technicalities.
Has a template repository with over 1,500 read-made spreadsheet templates for business, education, and personal use cases.
Advanced functions to import data, cross-tabulate, summarize, and convert data into meaningful information within clicks.
Pricing
Being open-source, OpenOffice Calc is free to use.
Pros and Cons
✅ Offers a Wizard to guide you through its comprehensive range of advanced spreadsheet functions.
✅ It integrates with Google's file manager to save, upload, and download XLS files anywhere on the cloud.
❌ It can be used only via a desktop app (creating potential versioning issues during team collaboration).
❌ No customer support.
8. Gnumeric
Similar to OpenOffice Calc, Gnumeric is an open-source spreadsheet solution. While it's not intuitive, it's a good tool if you enjoy working with the Excel interface.
Features
Comes with statistical analysis tools, such as correlation and covariance tools, for descriptive statistics, sampling, dependent observations, and other types of analysis.
Use the goal seek tool to perform a regression analysis on past data, understand the reasons behind certain phenomena, such as where sales numbers took a hit and break-even points, and decide on future action steps.
Offers conditional formatting options and tools, such as tab number, alignment, font, border, background, and validation.
Use simulation mode to create thousands of unique iterations or samples of your dataset to predict different scenarios and events.
Pricing
Being open-source, Gnumeric is free to use.
Pros and Cons
✅ Gnumeric is an open-source and free-to-use tool.
✅ Has a powerful sampling and analysis tool.
❌ The software can only be used offline.
9. Smartsheet
Smartsheet is an enterprise-grade work management software trusted by Dominos, Cisco, Lego, and other brands. It's an intuitive software that lets you manage projects, automate data handling, and collaborate on spreadsheets.
Features
Offers dynamic views like Card, Ganntt, Grid, Table, and Calendar to manage data and workflow efficiently under one roof.
Integrates with 100+ tools like Slack, MS Teams, Power BI, Salesforce, and more, allowing connectivity and synchronization with your everyday apps.
It has an activity log with filters like date range, type of action, and change-maker name to track changes across sheets in real-time.
Choose from 80+ preset functions to calculate, gather, and automate data; mix it with conditional formatting to quickly spot trends and at-risk tasks.
Use cross-sheet cell linking to sync information across sheets in real time.
Pricing
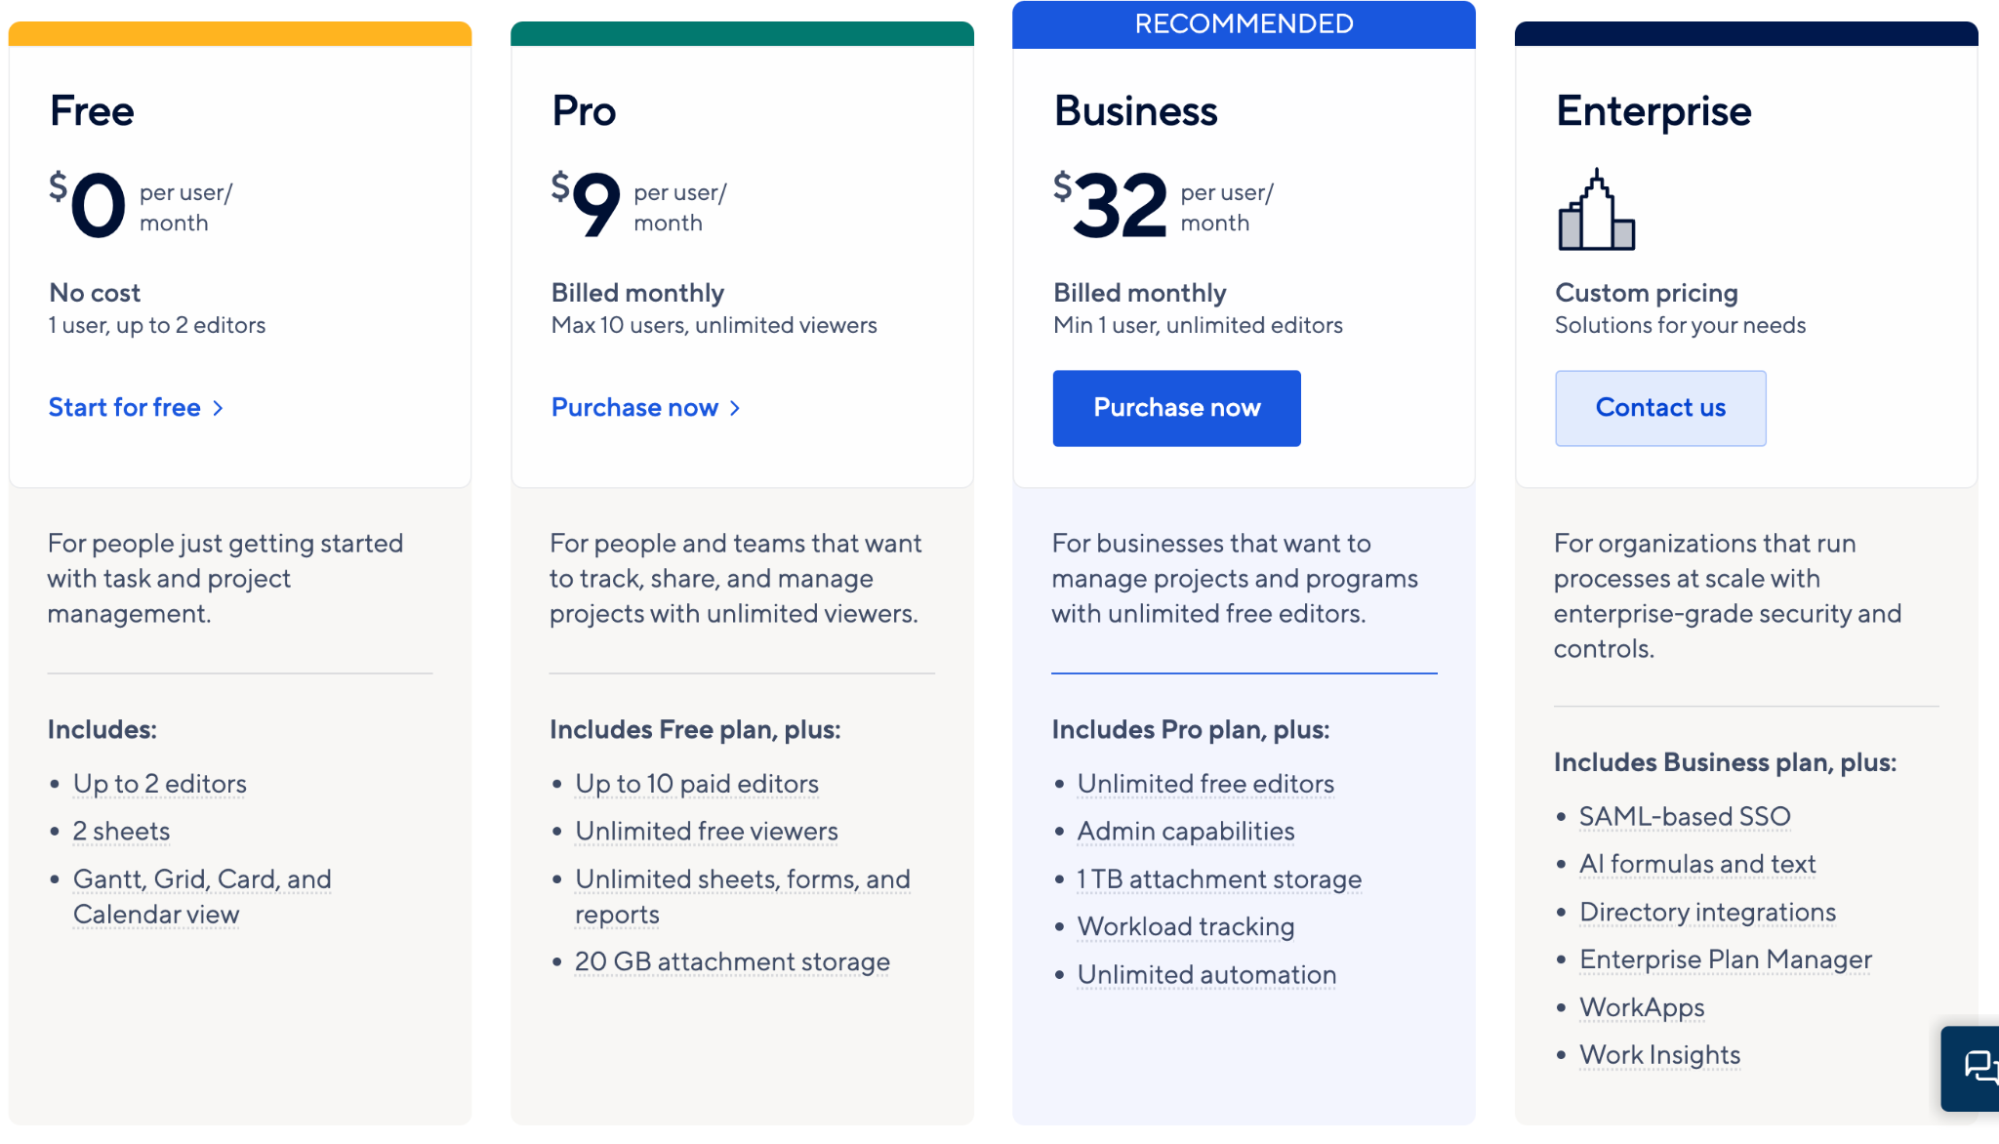
Smartsheet comes with a free plan that gives you basic functionality and has three other paid plans to choose from:
Pro: $9 per user per month
Business: $32 per user per month
Enterprise: Custom pricing
Pros and Cons
✅ Get real-time alerts and notifications via mobile app.
✅ You can download charts as PNG images and Microsoft Project.
❌ Comes with a significant learning curve for beginners.
10. Zoho Sheet
Zoho Sheet is an AI-powered spreadsheet app that uses generative AI to build interactive worksheets that make working with data seamless, automated, and streamlined.
Features
Offers interactive spreadsheet elements like drop-down menus, check boxes, conditional formats, date pickers, and more.
Zoho's data cleaning tool helps fix inconsistencies, missing values, human errors, duplicates, or unique entries in a click.
Ask Zia – an AI assistant, for help with creating charts, building pivot tables, and answering questions about your data.
Use Zoho Flow or Deluge editor (low-code) to drag and drop actions, trigger elements between 1,000+ apps, and create workflows.
Choose from over 350 predefined functions for data aggregations and perform complex calculations with ease.
Pricing
Zoho doesn't reveal its pricing on the website. However, it offers a 15-day free trial and gives access to all premium features.
Pros and Cons
✅ Zoho Sheet is available as a mobile app and browser extension.
✅ Supports 20+ different languages.
❌ At times, data rendering is slow and laggy.
Your new AI Data Analyst
Extract from PDFs, import your business data, and analyze it using plain language.
Try Rows (no signup)Automate Data Analysis with Rows
All the tools mentioned above are great alternatives to Excel and successfully alleviate Excel’s drawbacks. Data analysis is an integral part of any business, and it’s important to choose the right tool for the process.
But how do you find out which Excel alternative is right for you?
Well, there’s no better way than signing up for free trials and judging products for yourself.
If you or your team don’t have the time to try every product on our list, go to Rows.com, import data, automate your report, and see if it's the right match!