Intro
The PageRank is the algorithm used by Google to rank results on the Search page. Today, loading performances are playing an important role in assessing your score and determining how your website ranks. A higher organic rank increases your chance of getting found by your users and beating your competitors.
Data from 2022 demonstrates that ranking #1 generates more than double the CTR of the 2nd position, and nearly 4x the CTR of the 3rd position.
Getting ahead of your direct competitors, especially in some industries like e-commerce, is vital to acquiring a dominant position in the market.
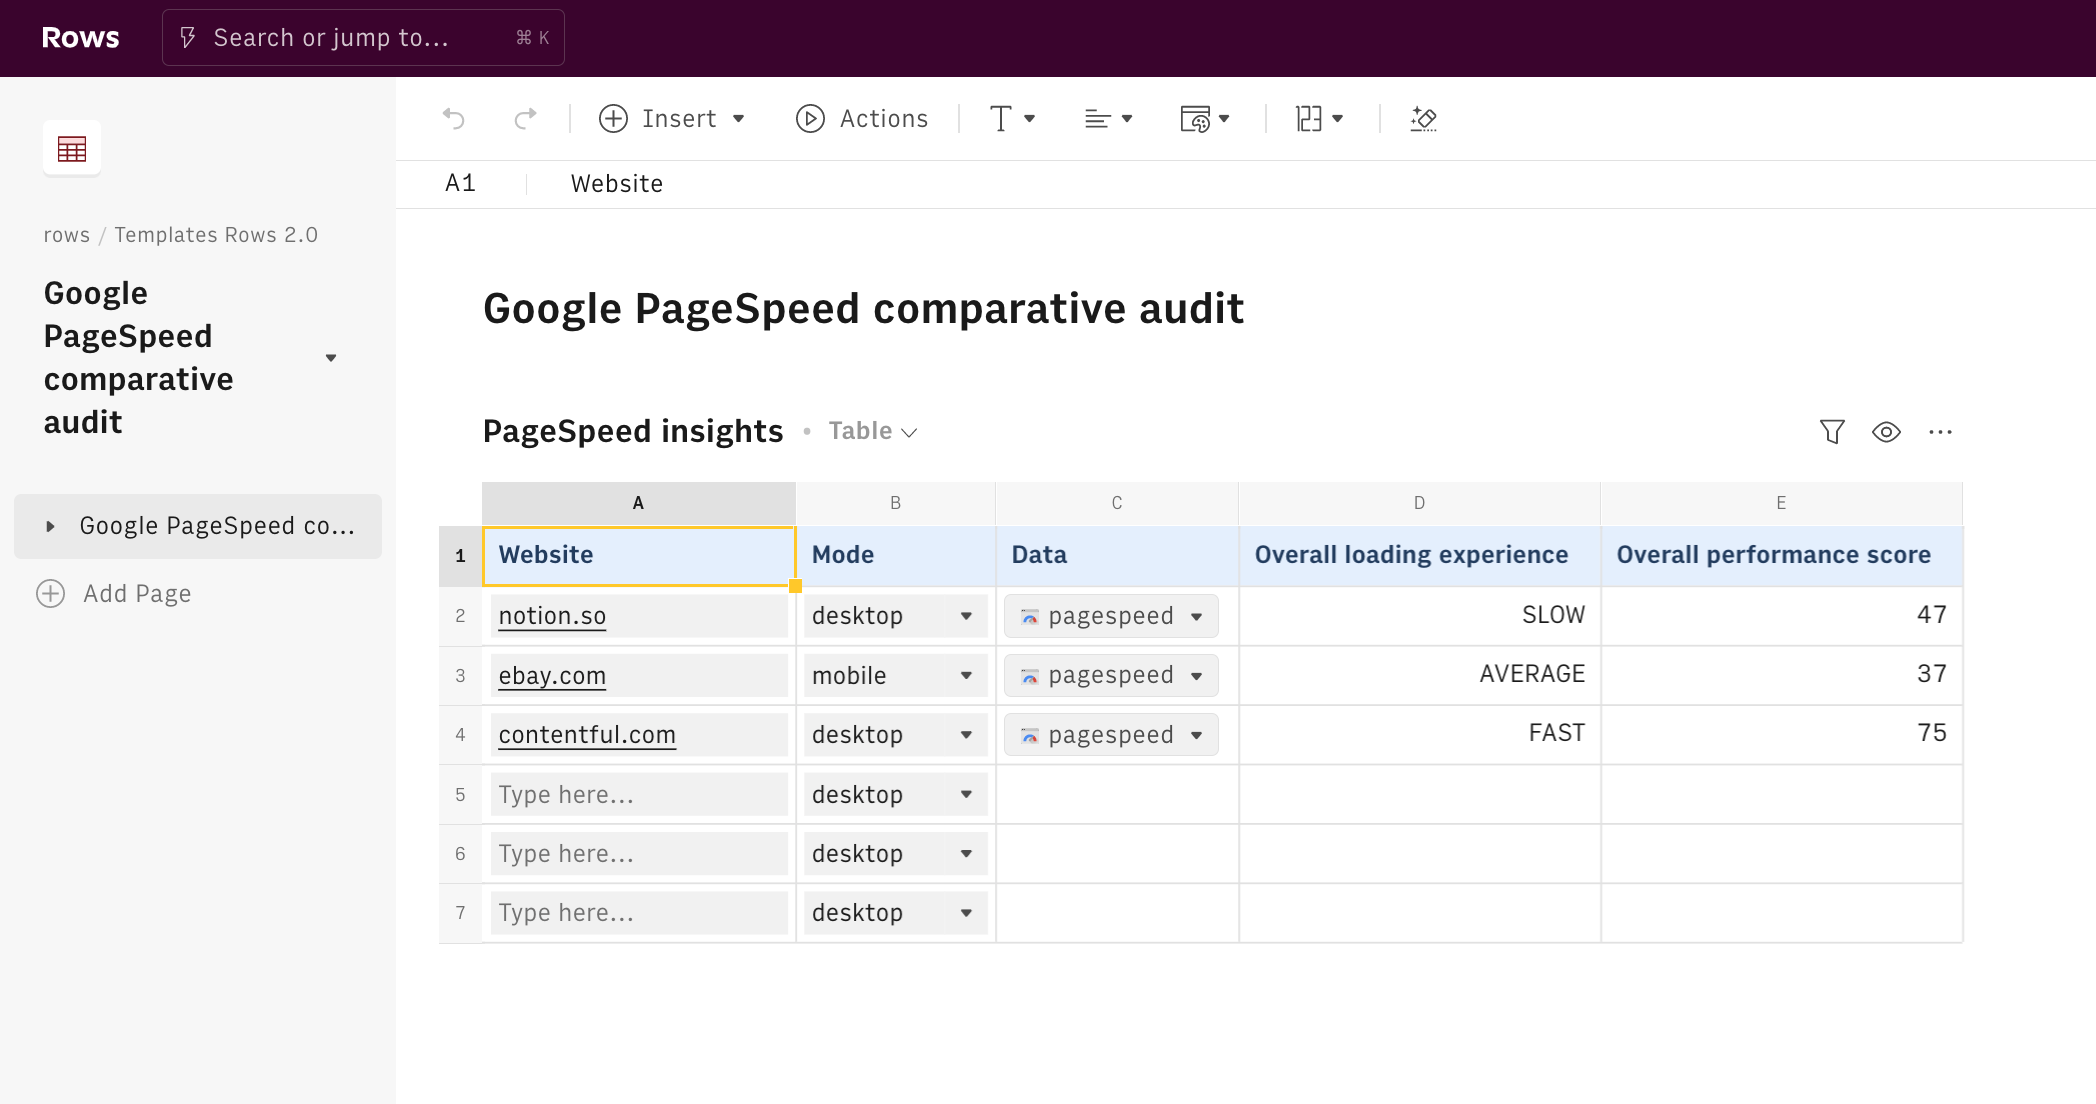
In this short guide, we’ll walk you through everything you need to generate a comparative summary report of your competitors' website loading performance. Here’s a sneak peek of what you’ll get:
What is Google PageSpeed
Google PageSpeed executes a real-live test browsing session to measure the main loading performance indicators of any webpage. The overall score gives you a glimpse of how fast a webpage can load its content.
The tracked metrics are: First Contentful Paint (FCP), First Input Delay (FID), Large Contentful Paint (LCP), Cumulative Layout Shift (CLS), Interaction to Next Paint (INP), and Time to First Byte (TTFB).
Google classifies the performance into three buckets: Good, Needs Improvement, or Poor. For this report, only a summary evaluation will be shared.
For further details, please have a look at the guide to build a detailed report.
Let's go!
To understand how we’re going to use it, let’s go step by step.
Open our template at the following link Google Pagespeed detailed audit and save it in one of your workspace’s folders
This template allows you to run a comparative audit of the loading performance of your competitors' websites.
Let's reverse-engineer it together.
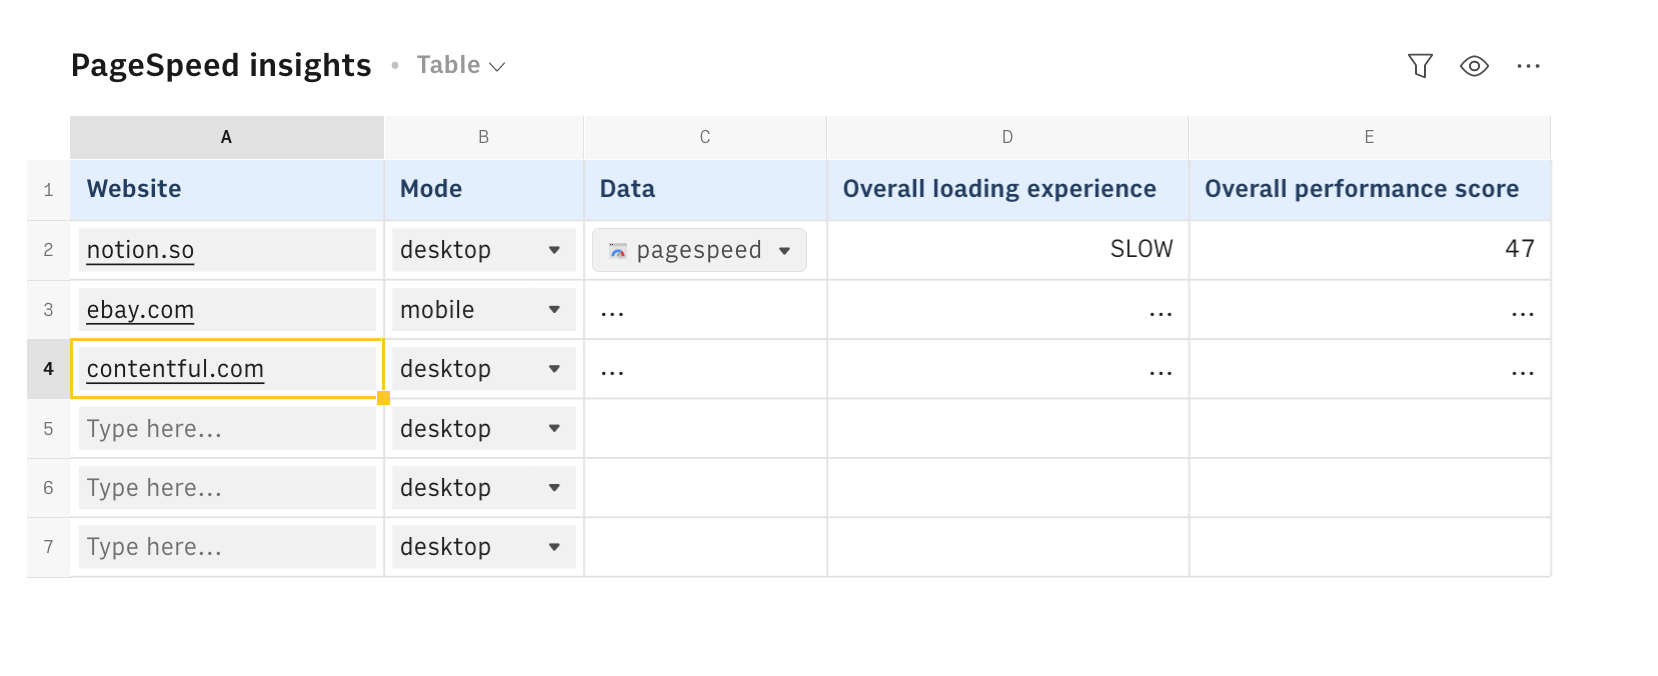
Simply enter the full URL of the websites you are investigating in column A of the 'PageSpeed insights' table and pick the mode desktop or mobile in column B.
The functions PAGESPEED_GOOGLE() in column C executes the audit for every websites. It uses the full URL and the mode as two arguments, as follows:
1 =PAGESPEED_GOOGLE(A2,B2)It is triggered through the AUTOFILL() in the table's headers. Please wait up to 25 seconds for each audit to be completed.
Rows AUTOFILL() has been designed to fill the column automatically with a defined formula, based on input data in previous columns (here A and B). It should always be placed in the column header and has to include the following mandatory arguments: the column title in quotation marks and the formula to be filled in the column itself - in this case, the PAGESPEED_GOOGLE() function:
1 =AUTOFILL("Data",PAGESPEED_GOOGLE(A2,B2))Columns D and E display only two summary measures of the performance audit. They are both output of a PARSE() function, that read and extract specific data points from column C.
To get them, click on the ... icon in cell C2 and hit View data.
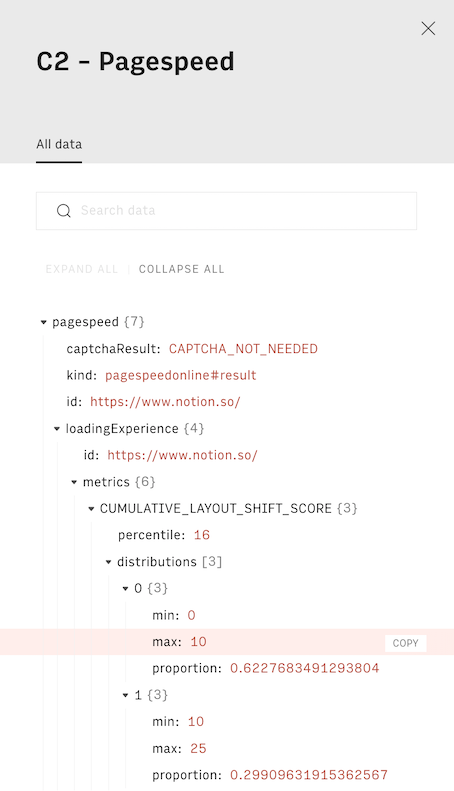
A panel will open on the right-hand side showing a structured document, in JSON format. Next to each data point, there is a COPY button. Hit it and paste in any cell: you will obtain a formula similar to the following, that uses our PARSE() function to read and extract specific data points from any JSON document. The first argument is the data cell C2, and the second includes the path to follow to retrieve that specific element.
1 =PARSE(C2,"loadingExperience.overall_category")You might also like
Check also
Obsessed with loading performances and SEO? Check out the following guides:
- Auditing your website loading performance with PageSpeed
- Monitoring your website search performance with Search Console
- Tracking keywords' performance with Search Console
- Planning link-building activity
- Tracking on-page SEO elements
Discover our Marketing playbook.