
Google Search Console Report
Use live data with Google Search Console to delve into your website organic search performance. Find top-performing and least effective pages, average position over time, device, country and search appearance breakdown of your search traffic.
 100% spreadsheet
 Connected to your data
 Daily+ refresh
 Embed everywhere
About Google Search Console Report
What is a Google Search Console Report?
The Google Search Console Report is an essential tool for website owner that provides insights into how Google views and ranks your site.
This template uses live data from the Google Search Console API to let you monitor the search performance of your website’s organic traffic and search ranking in the result pages of the world leading search engine, directly on a spreadsheet.
The key metrics to understand the search performance of your website through Google Search Console are impressions, clicks, CTR, and average position in the SERPs (i.e. search result page). Let's now go briefly through the definition of these metrics, that lay the foundation of your site's SEO performance.
Understanding the key metrics in this report
Impressions. An impression is counted when a page of your site appears among the search results. This does not mean that the user actually scrolls the page to view your website, as long as they do not click to see more results. If the user has to click on “More Result”, then the impression occurs if the page is among the next batch of results. Impressions associated with specific queries are a good measure of how popular that keyword is.
Clicks. The click metric, instead, is more straightforward: a click is counted when a user actually clicks on one of your pages from the search results.
CTR stands for Click-Through Rate, and it is the ratio between the number of clicks and the number of impressions. A high CTR is the key indicator of a good match between the user’s search intent and the content - title, and meta description - of your page: the user found the result relevant enough to click on it.
The position refers to the average search ranking of your site in Google SERPs. This metric is computed as an average because a single page can rank differently for specific keywords and differently among countries. The lower the position, the closer to the top 3, the better. It is estimated that almost 70% of all the clicks go to the first 5 results in the SERP.
How to use this template
Use this Google Search Console Performance report to gather actionable and valuable insights for your SEO strategy:
Start by picking a time period and entering your domain property (by default the domain type is 'Domain').
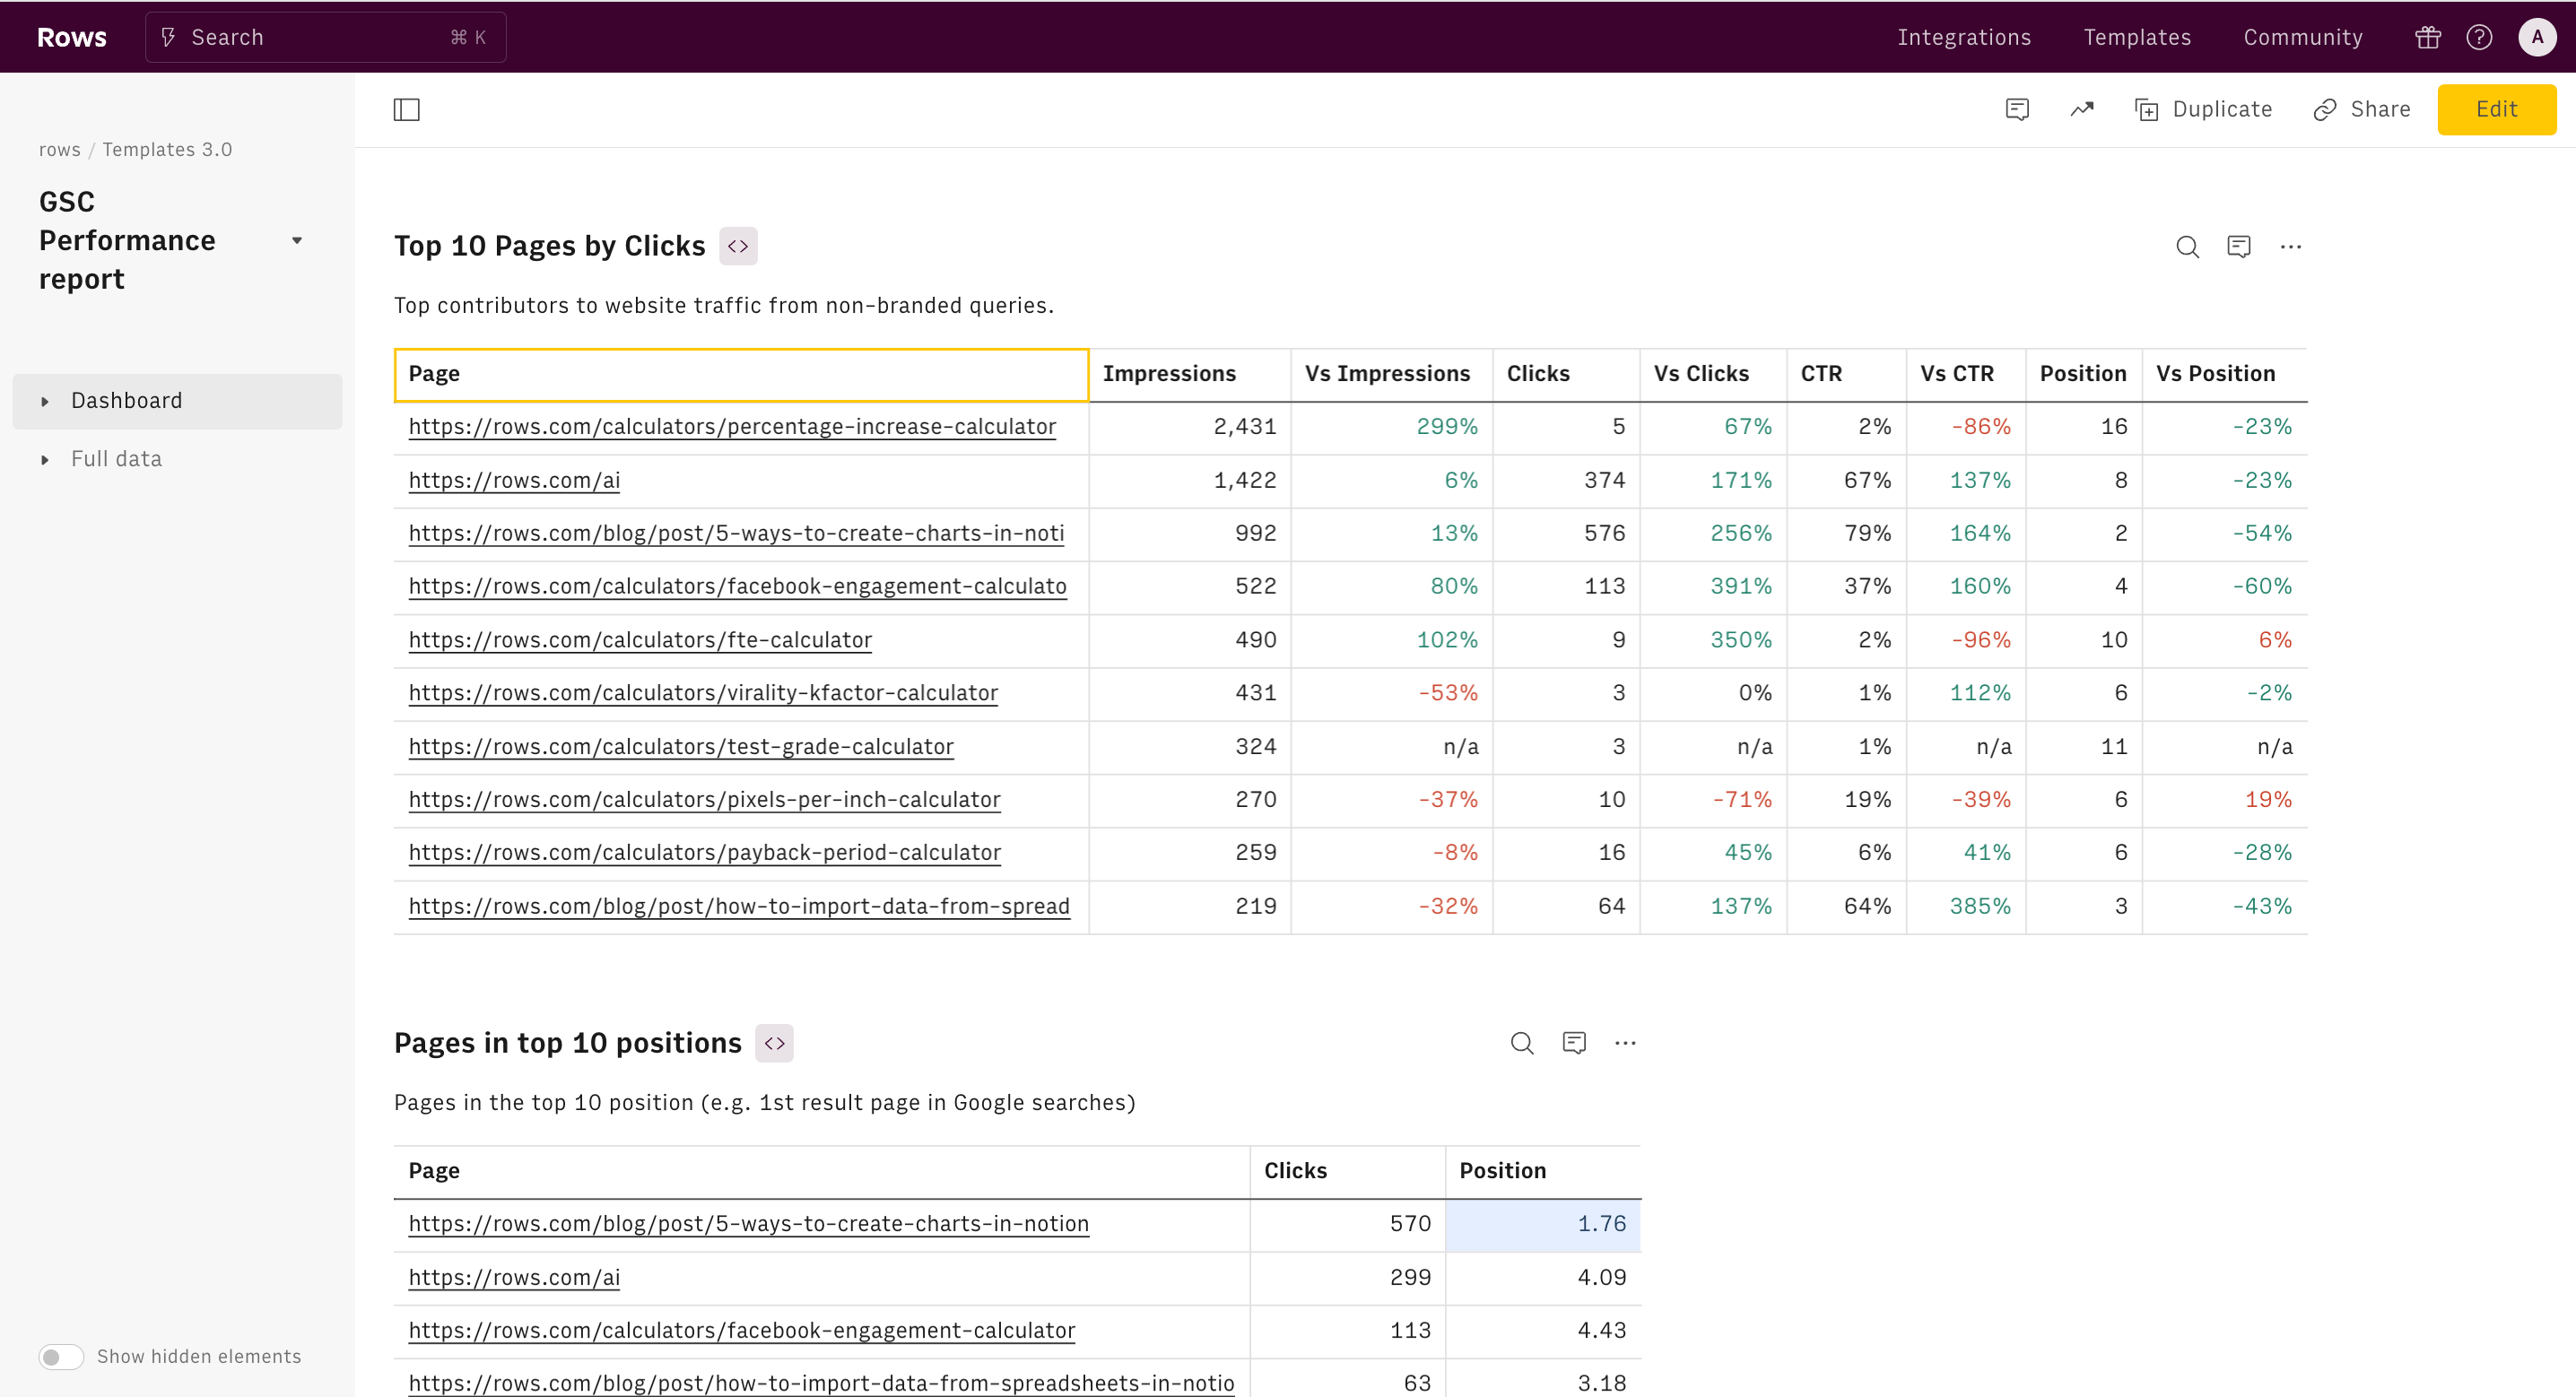
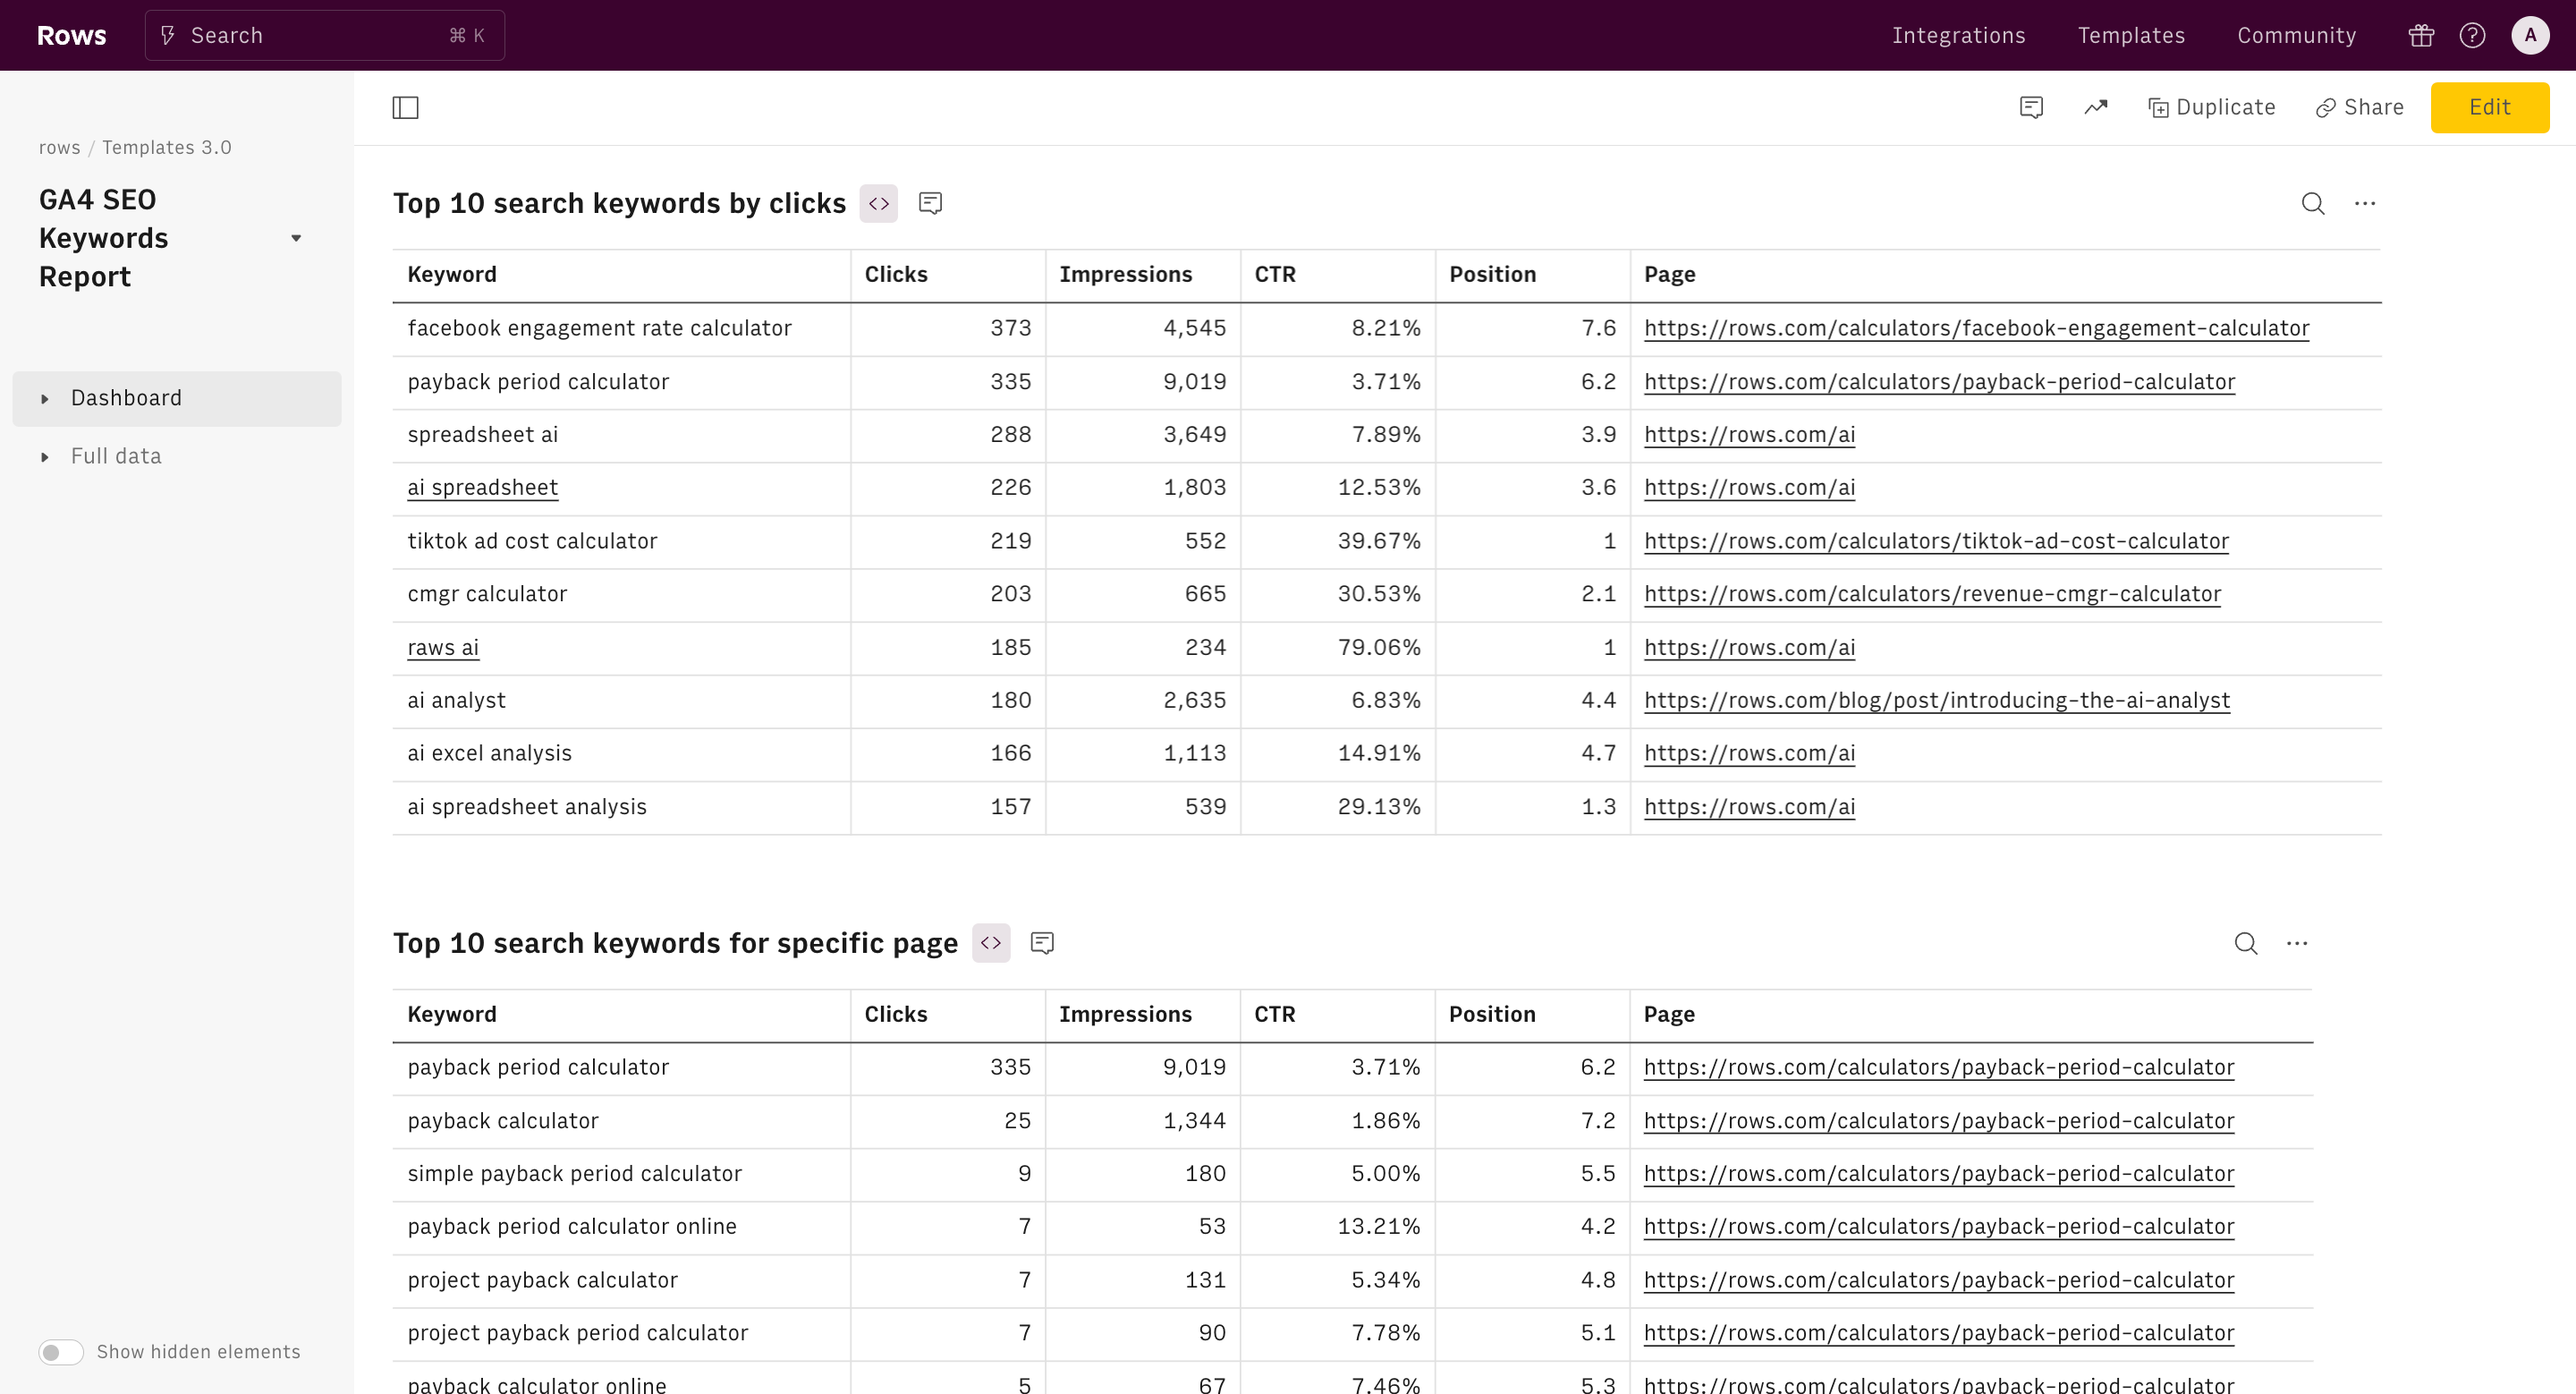
Quickly view your site’s top-performing pages by clicks from non-branded queries in the first summary performance table and compare their search performance over time periods.
Find the URLs (i.e. a blog post or 'how to' article) in search results that rank in the top 10 positions and immediately spot those ranking in positions 4-10.
These pages represent low-hanging fruits for your SEO effort as small improvements to their content can generate a 3-digit return in terms of clicks.
You can expect an average 4x increase in the number of clicks by moving to positions 1-3 by improving the content performance or solving minor technical issues.
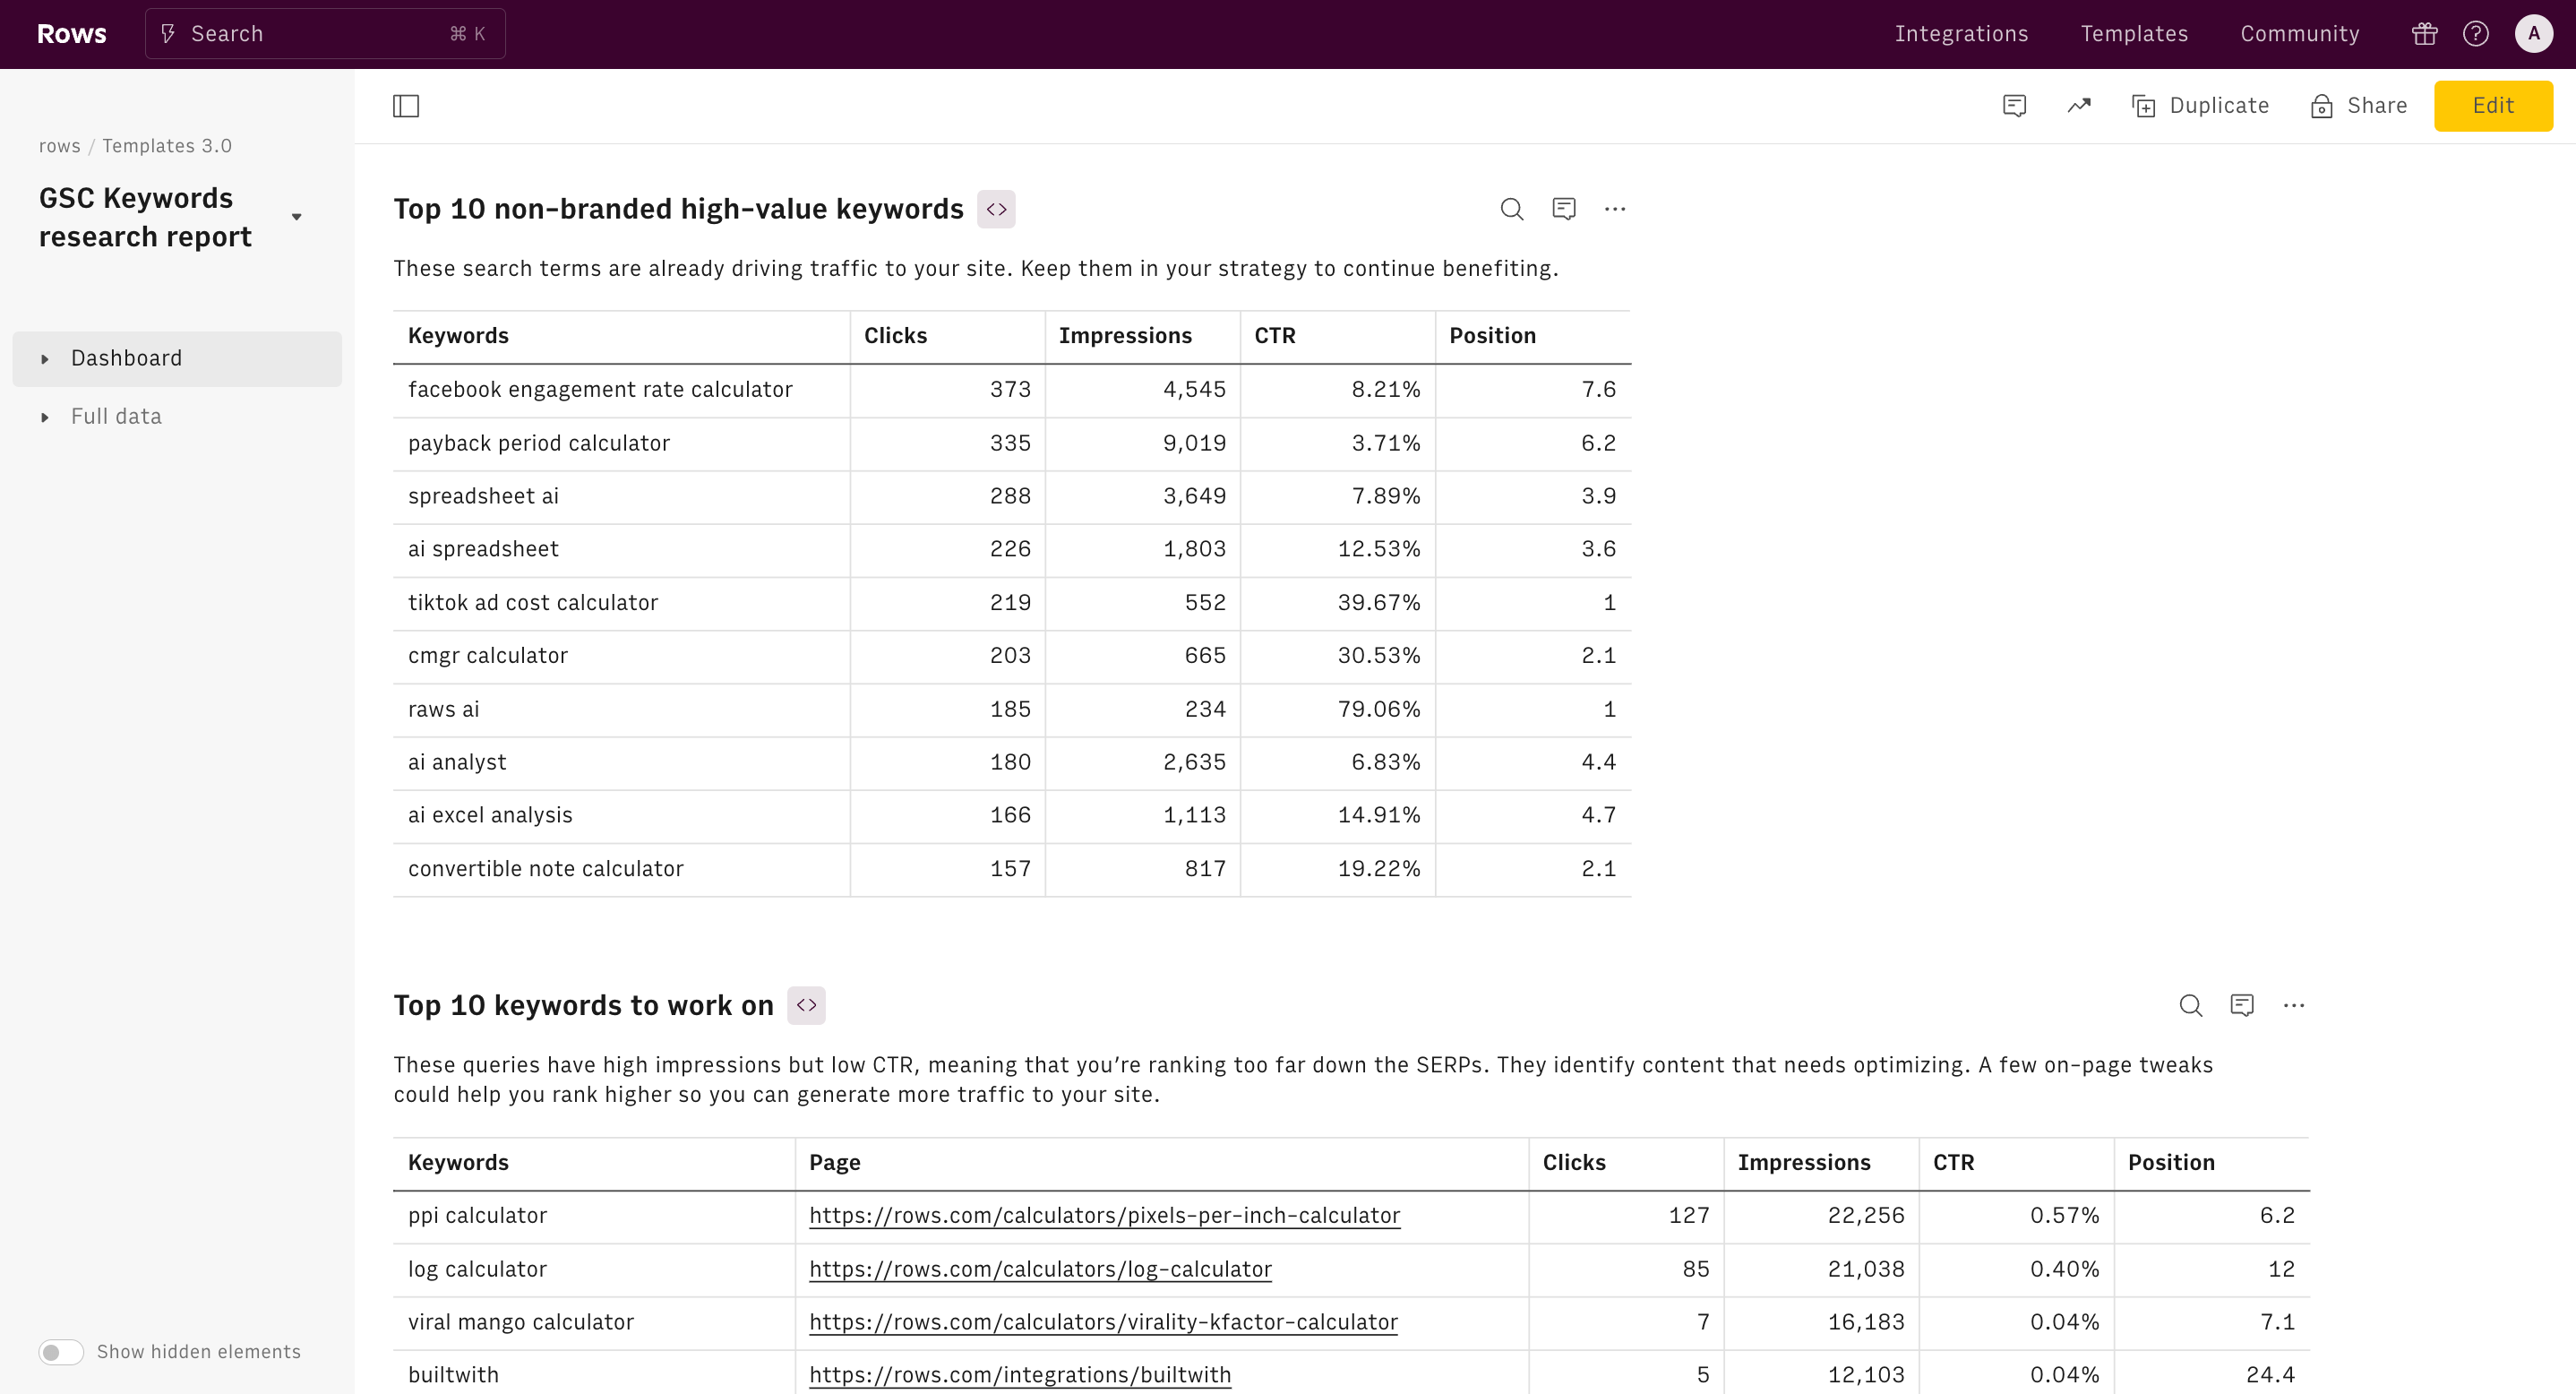
Continue your analysis by spotting the least effective pages by comparing their CTR with the benchmark CTR (the expected CTR given the average position). From this, you can infer a potential mismatch between users' search intent and the content delivered on the page.
The report also includes two charts that will break down your total traffic by device (mobile/desktop) and by country.
How it works


How it works
Get started
Click on 'Use template' and start using it right away. No forms, no signup. Your data first.
Connect your Google Search Console account
Once landed on the spreadsheet, follow the instructions to connect the Google Search Console API and pick your domain property.
Customize the template and schedule refresh
Once the integration has been connected, all tables will update automatically with your own data. Click on 'Edit Source' to change the retrieved data and automate the data refresh. You can then insert a chart or a pivot table, add a column or personalize formats, using all the regular functions and shortcuts that make spreadsheets great.
Embed tables and charts
Click on the option menu to embed tables and chart on your Notion, Confluence or any other iframe-ready documents.


Questions and answers
Can I use Rows for free?
More than a Google Search Console Report
Rows is your new AI Data Analyst. It lets you extract from PDFs, import your business data, and analyze it using plain language.
Signup for free

Import your business data
Extract from PDFs and images, import from files, marketing tools, databases, APIs, and other 3rd-party connectors.
Know moreAnalyze it with AI
Ask AI✨ any question about your dataset - from VLOOKUPs to forecasting models - and surface key insights, trends, and patterns.
Know moreCollaborate and Share
Seamlessly collaborate and share stunning reports with dynamic charts, embed options, and easy export features.
Know more