Google Sheets vs Excel vs Rows: Which One is Better in 2026? (Updated version with benchmark)

Finding the right spreadsheet software that fulfills all your needs is tough.
With uncountable options available in the market today, you can get overwhelmed and make a decision that isn’t the best for your business.
To save you time and money, I have identified the three best spreadsheet software in the market.
Google Sheets, Excel, and Rows.
In this article, I will compare Google Sheets vs Excel vs Rows based on their features, integrations, and pricing.
But first, here’s a TL;DR to save you time:
Google Sheets: If you need a spreadsheet software primarily to manipulate and transform mid or large-sized datasets and you want to collaborate seamlessly with your team on the spreadsheet, use Google Sheets.
Excel: If you need to manipulate and run in-depth analysis of large datasets, then Excel is the right choice for you. The software also gives you access to the biggest catalog of functions and formulas.
Rows: If you find yourself often pasting data or importing files from many of your daily tools to a spreadsheet to analyze and share, then your go-to software is Rows. Rows comes with 50+ data integrations, AI capabilities, and beautiful sharing options.
For an in-depth comparison, read ahead.

Your new AI Data Analyst
Extract from PDFs, import your business data, and analyze it using plain language.
Try Rows (no signup)Features: Google Sheets vs Excel vs Rows
All three spreadsheet tools offer overlapping features. However, they differ by a considerable margin. Let's start with Rows.
Rows Features
Rows is your new AI Data Analyst. It combines the backbone of a spreadsheet with the power of ChatGPT to to give business people full autonomy over their data. Just ask in plain language and Rows will handle the rest, whether that's spreadsheet operations, data import or transformations, or running Python code to do code-level analyses.
It’s the new way teams at HP, AWS or Taxfix make sense of their data and speed up decision processes.
Let's dive into its key features.
AI Analyst
Rows copilot works across four key capabilities:
Spreadsheet-native operations: Standard spreadsheet tasks are supported both as regular commands and via AI —pivots, conditional formatting, new columns, charts—happen through conversation instead of clicking through menus or writing formulas.
Example prompts:
→ "Build a pie chart showing share of profit by product"
→ "Add conditional formatting rule to column D: red if <100, yellow if <150 and green if >150"
Data Ingestion: Pull data directly from documents or connected tools without wrestling with configurations or manual copying-pasting.
Example prompts
→ "Import all transactions from my N26 account and classify them as: marketing, software, travel, other"
→ "Pull keyword data from the last 90 days from Google Search Console"
Multi-step plans: String together multiple dependent steps—build a dashboard, create a calculator from scratch, or execute a series of operations where each step builds on the last.
Example prompts:
→ "Add a column classifying keyword position into brackets: [1-3], [4-10], [10+], then create a pivot showing average CTR by bracket"
→ "Build a simple dashboard showing the performance of sales people in the last quarter"
Code-level analysis: When you need statistical analysis, machine learning, or custom visualizations that go beyond standard charts, Rows can write and execute Python code to get there.
Example prompts:
→ "How does my revenue change if my margin increases by 5%?" (what-if analysis)
→ "How many orders do I need to hit $100k, $500k, and $1M in revenue?" (goal-seek)
→ "Calculate correlation between keyword position and clicks, then show statistical significance"
→ "Run a k-means clustering model to segment customers by purchase behavior and visualize the clusters"
→ "Create a Sankey diagram showing traffic flow from source → landing page → conversion"
Instead of switching between tools or learning specialized syntax, you describe the analysis you want and the AI Analyst figures out how to execute it: it scans your dataset, understands the key variables, and provides what you need.
To access AI in Rows you can either
click on the ✨ icon, at the bottom right corner of your viewport: this will open a chat UI panel that will work across your spreadsheet. You can ask questions in two modes, Build or Chat, based on whether you want to actually creating elements or just have in-line answers.
use the ✨ icon at the top right corner of each element: a contextual menu with a few shortcut will open right away allowing you to perform quick actions like summarizing the content or beautify a table
Watch below side-by-side comparisons with Excel and Google Sheets:
Running over 50 prompts on real-world datasets in our benchmark, we found that AI in Excel and Google Sheets consistently underperformed across five key dimensions:
Core spreadsheet operations: structuring columns, applying logic across ranges, and keeping spreadsheets clean and traceable.
Accuracy: often giving incorrect or incomplete results, far below competitors.
Static output: producing hardcoded numbers, pasted tables, or chart images instead of live, recalculating formulas and linked data.
Advanced analytics: scenario modeling, dataset relationships, clustering, and complex transformations frequently fail or need heavy manual fixes.
Generative requests: Consistently fails at creating predictive or analytical models, even after multiple attempts.
Extract data from documents and images
As mentioned above, Rows can ingest data directly from documents and images—not just as static imports, but as structured, editable tables.
It works with PDFs and multiple image formats (JPEG, PNG, HEIC...)
You can process batches at once rather than uploading files one by one.
All extracted data can get merged into a single table you can immediately work with, stay on separate tables or get appended to an existing one.
You can also add custom extraction instructions to pull exactly what you need. A very common use case is invoices management. By adding the prompt
"Extract date, vendor name, VAT amount, total amount, and description", Rowswill scan all documents and return a consolidated table with those specific fields—no manual data entry, no error, or formatting issues
Instructions can be enhanced automatically and saved for later. Watch the demo below:
What's more? 50+ data integrations
As anticipated above, Rows comes with 50+ built-in data sources integrations in various domains, many of which are supported in the AI Analyst, meaning that you can simply ask AI to pull data from your ideal source and it will take care of the rest.
Example of prompts:
SEO data: "
Pull page data from the last 30 days from Google Search Console, including only pages that contain /blog/"Finance data: "
Pull all transactions from my HSBC account and classify them into: software, marketing, travel expenses, revenue"Marketing data: "
Use GA4 data to rank the top sources of traffic from mobile in Brazil in the last 30 days"
See it in action below:
Here's a division of the built-in integrations in Rows:
Marketing: GA4, GSC, Facebook, Instagram, Tiktok
Finance: Stripe and Plaid (+12,000 supported banks)
Productivity software: OpenAI, Notion, Slack, Email, Translate
Data warehouse: MySQL, BigQuery, PostgreSQL, Snowflake, Amazon Redshift
Discover the full catalog here.
You also have the possibility of creating custom connections via our HTTP functions.
💡 Pro tip: When the tool you’re working with isn’t listed in our catalog, HTTP functions allow you to connect to any RESTful API, GraphQL endpoint, or other HTTP-based data sources, regardless of their structure or authentication methods. On Rows, GET, POST, PUT, and PATCH make the catalog of integrable tools virtually infinite. Try them our in our HTTP tester. Or watch the demo below:
Your new AI Data Analyst
Extract from PDFs, import your business data, and analyze it using plain language.
Try Rows (no signup)Google Sheets Features
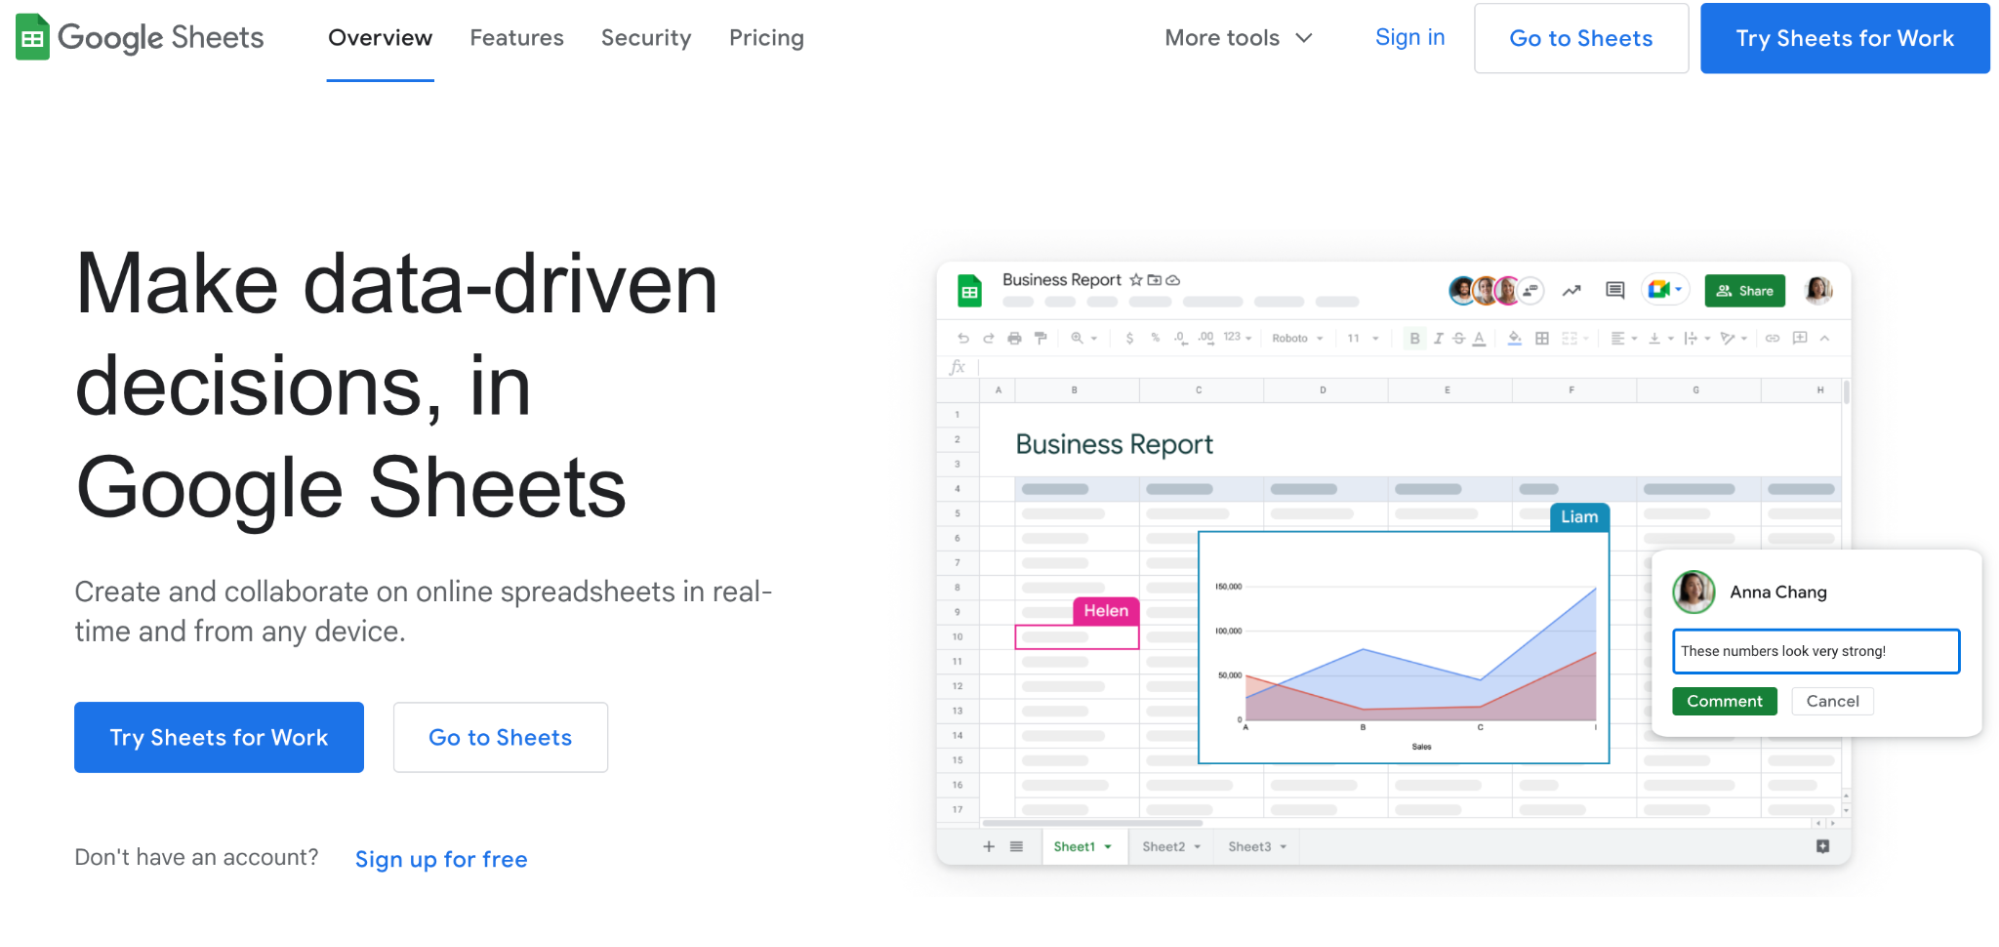
Google Sheets is the most minimalistic spreadsheet app in its category. Let's drill down into Google Sheets features.
Formulas and Functions
Google Sheets has an extensive catalog of formulas and functions.
The software stands out with unique functions, such as QUERY, which lets you query data using SQL-like commands. It also lets you create custom functions with built-in Sheets formulas that are reusable across sheets.

AI and Automation
Google Sheets AI features are limited to automation tools for data validation, removing duplicates, and trimming white spaces. It also has an Autocomplete function that auto-fills cells and provides suggestions on data cleanup, formulas, and Pivot tables.
Google recently introduced Gemini as an AI sidekick for Google Workspace apps (including Google Sheets). However, it's still in the early access phase and has not been completely rolled out to the public.
To use Gemini for Sheets, you must have an existing Workspace plan (paid). This requirement does not apply to Rows, which features built-in AI and does not depend on third-party tools or require payment for integrating AI into spreadsheets.
For now, Google Sheets lets you record Macros to automate spreadsheet processes. Once recorded, you can activate a macro to repeat those actions later.
Compared to Rows and Excel AI, Google Sheets falls short in AI functions.
Real-Time Collaboration
Google Sheets excels at real-time collaboration. Sheets allow multiple teammates to edit the same spreadsheet simultaneously, showing one another's cell selections and edits in real-time.
It also has a chat feature that makes it easy for teammates to communicate in real-time.
But the user experience isn’t as good as Rows. When many people work on Google Sheets together, it slows down and might lead to software crashes.

What’s more, Sheets keeps version history, supports in-cell comments, and allows spreadsheet sharing via smart links with role-based access permissions.

Data Visualizations
Google Sheets is an excellent choice if you've got a smaller dataset to analyze and visualize. It offers an extensive gallery of data visualization elements, such as bars, charts, graphs, tree maps, histograms, and more.
It has an intuitive chart editor that lets you customize charts for colors, layouts, and several other customization options.
Excel Features
Excel has pioneered spreadsheet reporting for ages. With every upgrade, it gets better and now poses as a decent competitor to Rows and Google Sheets.
Let's take a look at its features.
Formulas and Functions
In Google Sheets vs Excel vs Rows, Excel has the largest catalog of formulas and functions (500+). This makes tasks like accounting and statistical analysis easy to perform in Excel. Much of the reason why Excel is still holding its ground in the spreadsheet industry.
Conversational AI
Excel has an AI Copilot, a conversational AI assistant that lets you perform most tasks via natural language commands.
Copilot in Excel helps you with low-level tasks like formatting and organizing data to high-end analysis, such as identifying trends, proposing what-if scenarios, suggesting ideas for improving your business, and building a dashboard.
However, unlike Rows, which provides AI capabilities with no added cost, Copilot is an add-on that costs an extra to use within Excel.
Advanced Data Analysis
Other than Copilot AI, Excel lets you auto-fill cells, update cell values, and apply automatic formatting to ease data analysis.
Like Google Sheets, functions like creating a macro in Excel allow you to customize automation and speed up data entry.
While Excel has far more data-holding capacity than Google Sheets without slowing down, users have also found that Excel's advanced features go beyond what Google Sheets and Rows offer in terms of functionality.
Advanced statistical tests such as z-tests, t-tests, and ANOVAs are built into the platform.
Meanwhile, to perform an ANOVA test in Google Sheets, you must first download the XLMiner Analysis Toolpak.
It's no wonder Excel is the preferred choice for analyzing large datasets that require complex formulas, functions, and processes.
Data Visualizations
Excel offers customizable graphics and data visualization elements like pie, line, column, bar charts, area and scatter graphs, and other templated options.
It also has a Quick Analysis tool that automatically selects the best chart for your data. Other than that, you've access to a vast gallery of ready-made dashboard and report templates for inventory, budgeting, and versatile purposes.
Which Spreadsheet Tool Has Better Features?
All three tools are winners in different aspects:
If you want advanced AI capabilities and flawless data visualization, Rows is a perfect match.
If you want a large array of formulas and functions, Excel should be your choice.
Google Sheets is a great tool if you want good data formatting features and a large set of functions and formulas.
Integrations - Google Sheets vs Excel vs Rows
Rows Integration
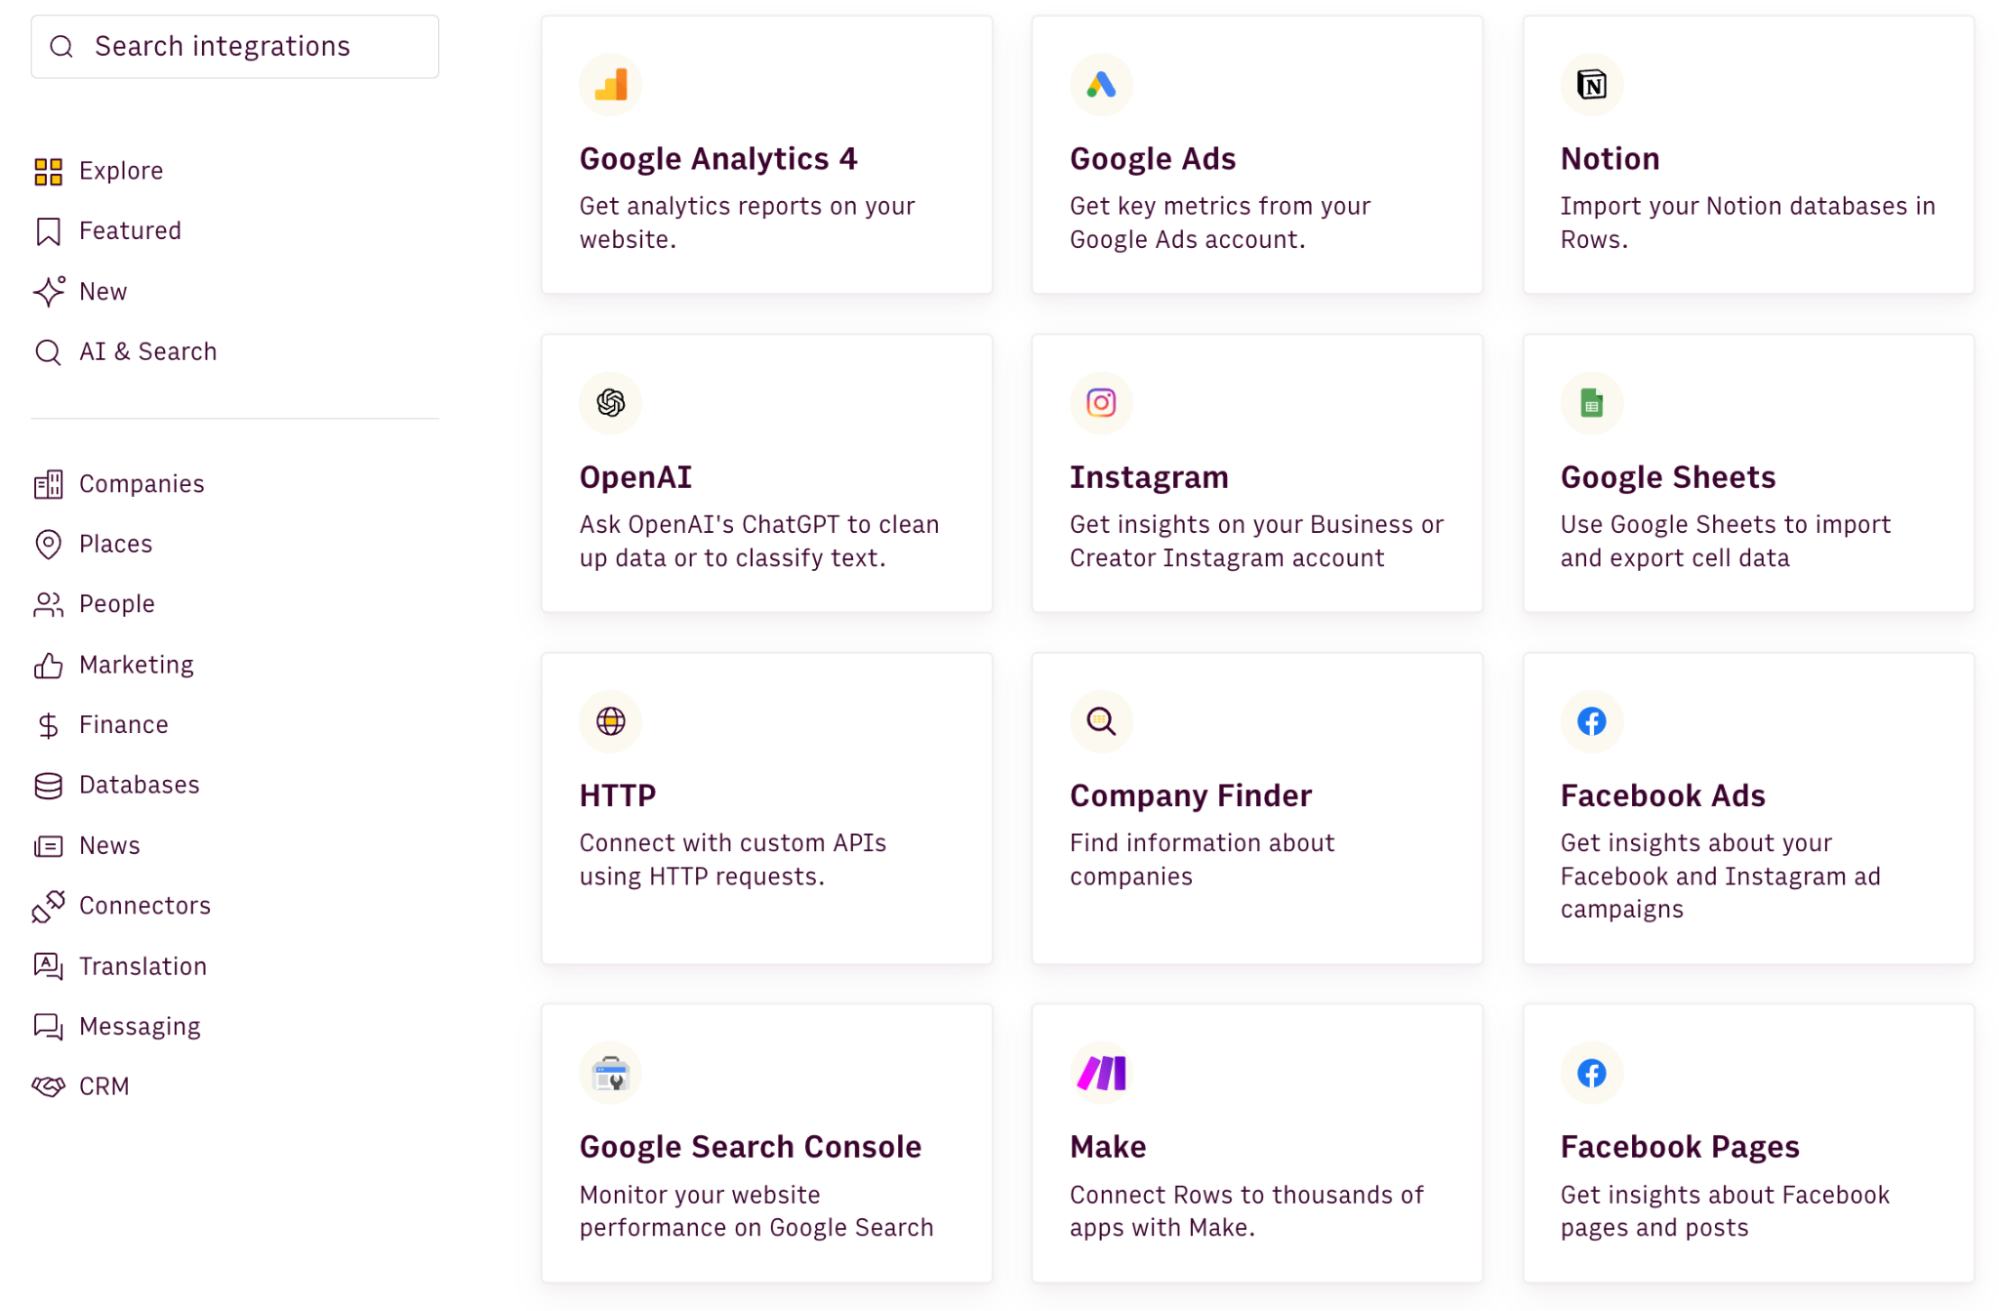
Rows integrates with more than 50 data sources that help you import , automate, and visualize data in a better way.
It integrates with software in categories like finance, marketing, databases, AI, CRMs, and more, such as Google Analytics, Google Search Console, Facebook Ads, Notion and BigQuery.
Rows also integrates with Open AI to use AI when analyzing data, making the whole process easy for the users.
Other major integrations involve software like:
Make
Gmail
HubSpot
Looker Studio
Zapier etc.
It's worth noticing that, if the tool you are using is not in Rows catalog, you can always execute custom API requests to any endpoint with proprietary HTTP functions.
Google Sheets Integration
Google Sheets integrates with other Google Cloud Services. Its integration with Google Forms is a big plus for those collecting data through forms. It also has native data connectors to export/import data from tools like BigQuery and Looker Studio.

To extend integration capabilities, you can choose add-ons from Google Workspace Marketplace. The marketplace offers free and paid add-ons that integrate Google Sheets with tools like Asana, Salesforce, ChatGPT, Jira, Contour, etc.

Excel Integration
Excel misses modern, plug-and-play data integrations. Most of which you'd find in Google Sheets and Rows.
However, Excel offers Zapier integration, allowing you to integrate with 5,000+ apps in a click.
The only native integrations Excel has are for Power BI and a few data warehouses.

Which Spreadsheet Tool Has Better Integration?
Rows undoubtedly has better integrations with data sources, marketing, finance, and other tools when compared to Google Sheets and Excel.
Pricing - Google Sheets vs Excel vs Rows
Rows Pricing
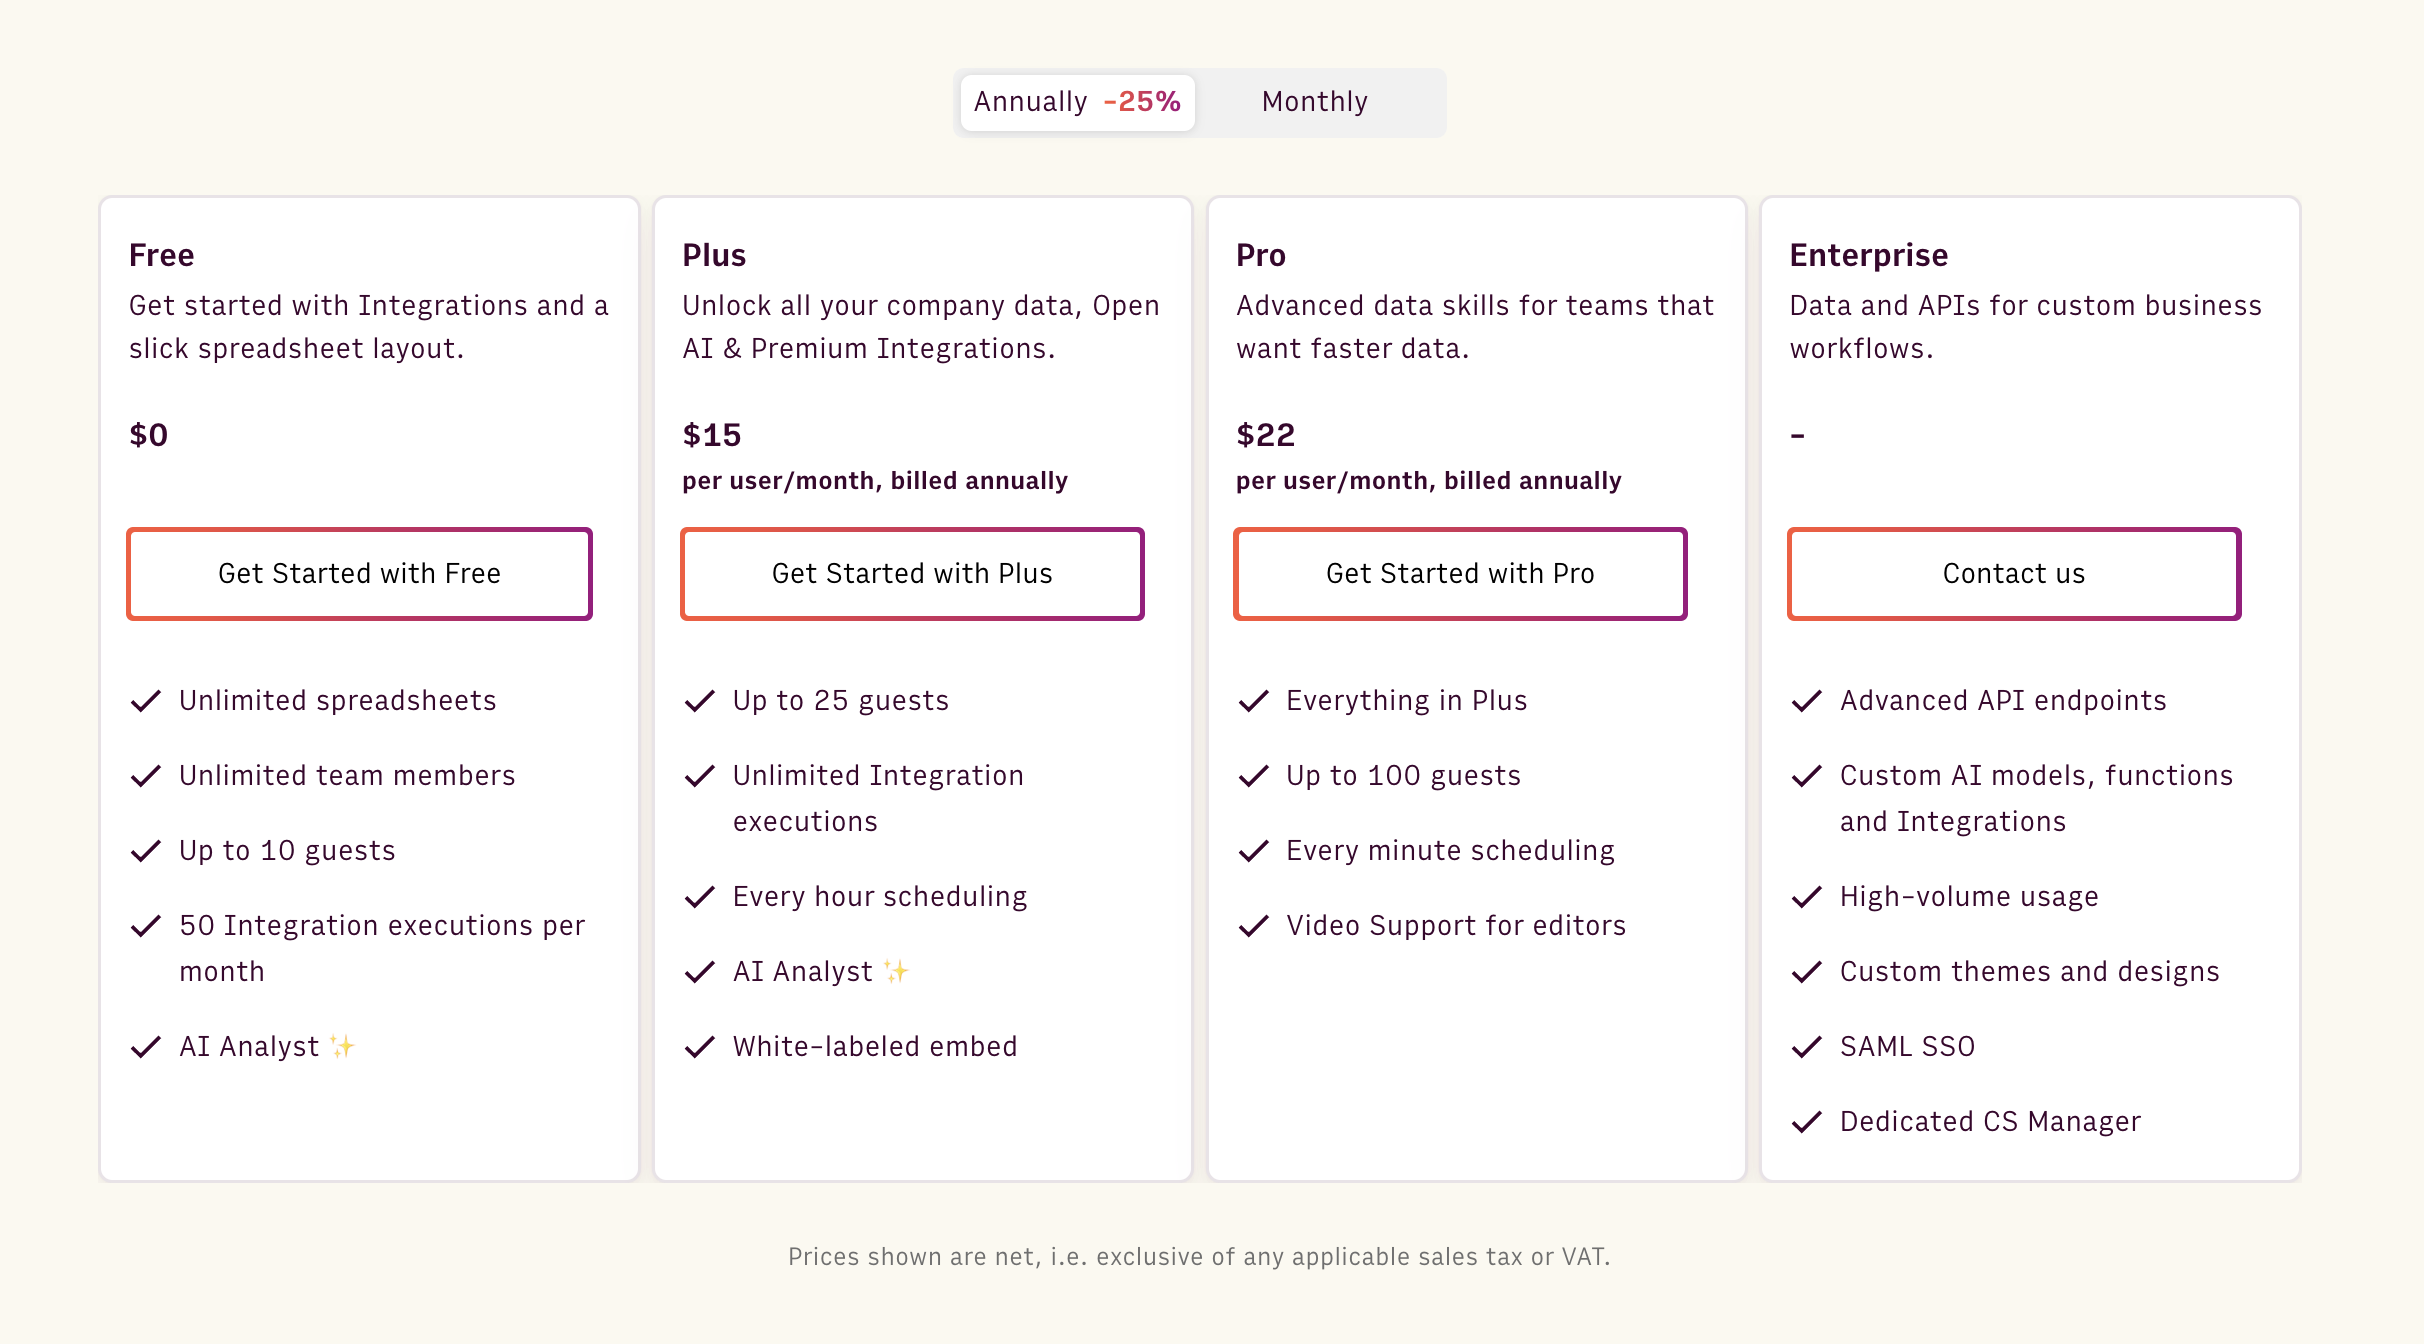
Rows comes with a free forever plan that lets you:
Onboard unlimited team members
Add up to 10 guests
Create unlimited spreadsheets
Execute 50 integration tasks per month
The free plan is quite generous. But if you want to use data integrations at scale, want white-labeled embed, video support, and more, you have the option to upgrade to one of the paid plans Rows offers:
Plus: $15/month/member, up to 25 guests, unlimited integration tasks & daily data refresh.
Pro: $22/month/member, up to 100 guests, unlimited integration tasks & hourly data refresh.
Enterprise: Custom price for advanced API usage and workflows.
Google Sheets Pricing
Google Sheets is free for individual use. However, for businesses, Google Sheets is available as part of Google Workspace.
Here are its four annual plans billed annually:
Business Starter: $6 per user per month
Business Standard: $12 per user per month
Business Plus: $18 per user per month
Enterprise: Custom pricing

👀 Note: Gemini is available as an add-on to your Google Workspace plan.
Excel Pricing
Microsoft Excel (web-only) is available as a standalone app and is free for personal use.
The offline version comes as part of the Microsoft 365 suite and has two subscription categories for personal and professional use:
For Home
Personal: $6.99 per month
Family: $9.99 per month
For Business
Basic: $6 per user per month
Standard: $12.50 per user per month
Premium: $22 per user per month
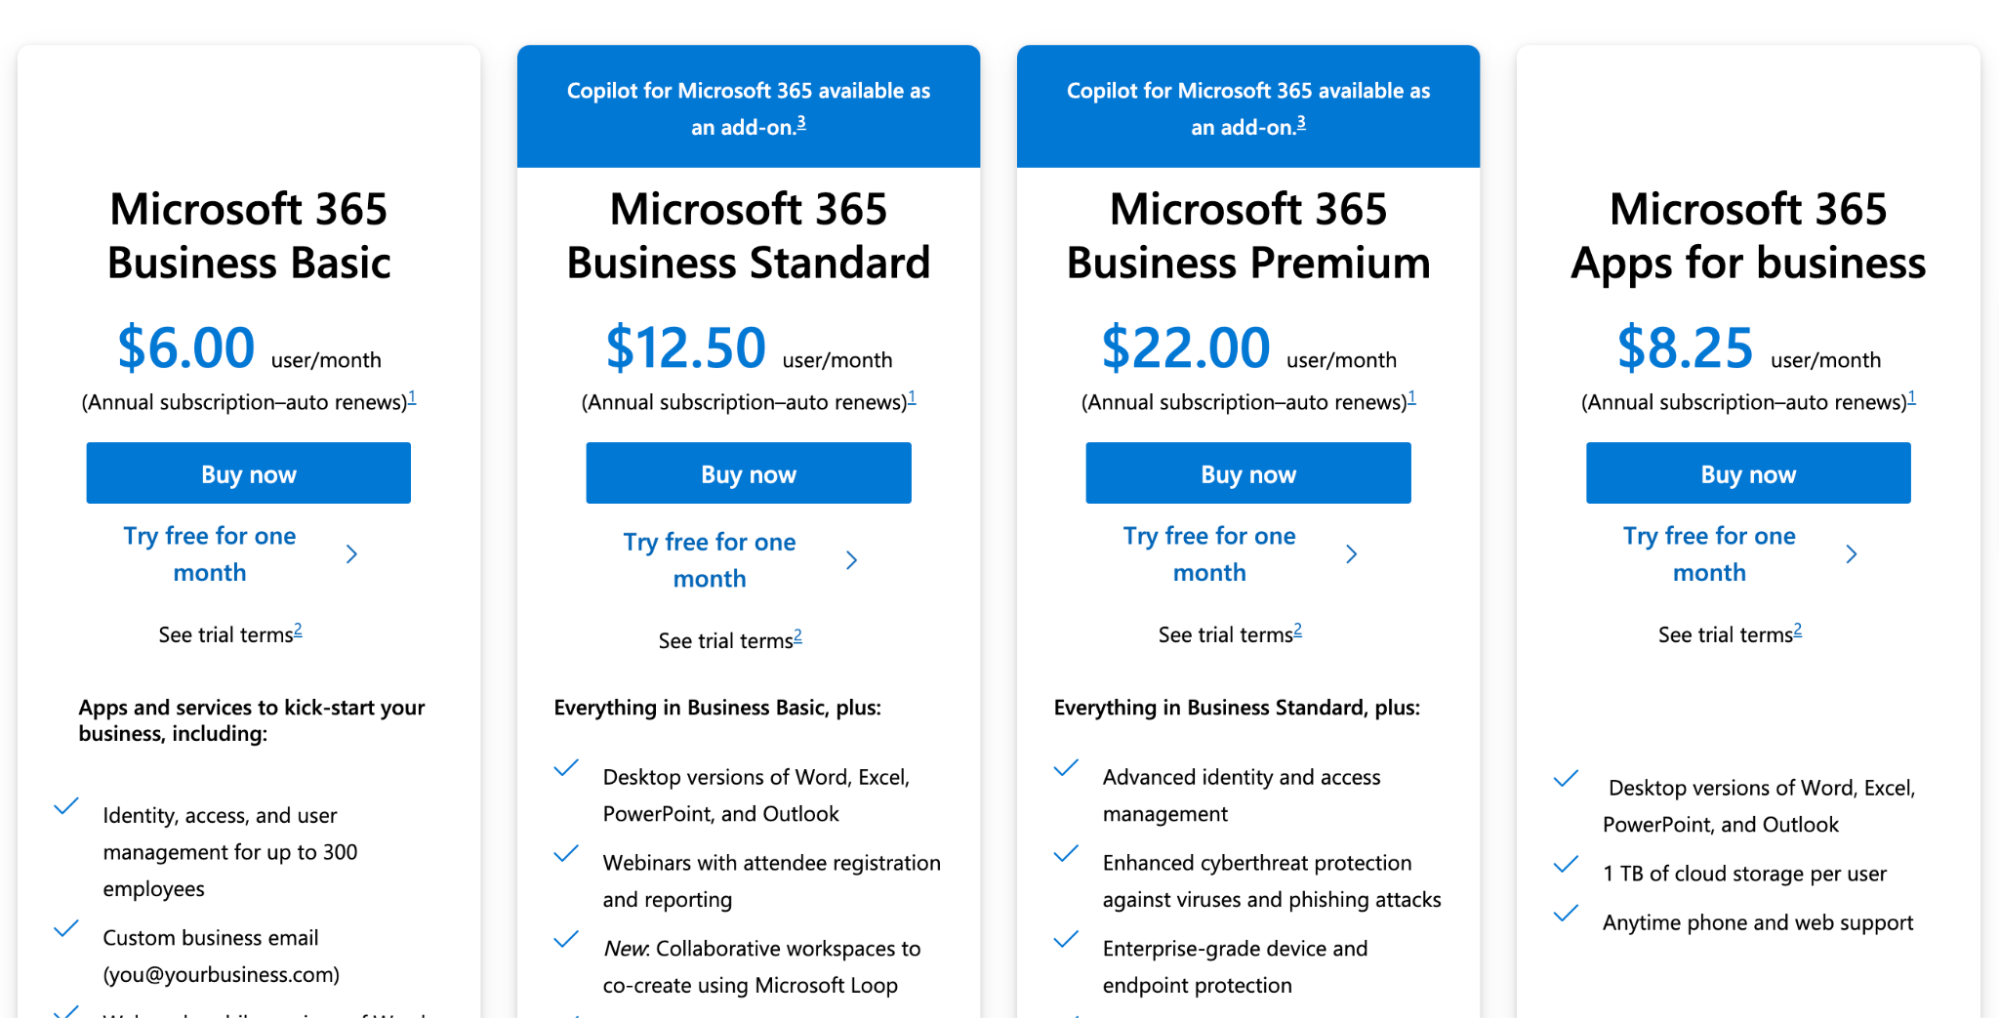
👀Note: Copilot AI is available as an add-on.
What are Customers saying?
Here’s what users of Rows, Google Sheets, and Excel are saying about these spreadsheet software on review sites.
Rows Reviews
The knowledge base Rows offers for every feature and integration is commendable and users love it.
“Excellent job, before beginning to use the Rows, I really love short introduction videos as a taste of getting started tutorial. And also asking the user's level of understanding about spreadsheets was a plus. It is easy to use and easy to share. Good visual design!” - Product Hunt.

Users are happy with the variety of features Rows offers and its AI capabilities.
“I've been using Rows for several years now and I can honestly say it's the best way to work with spreadsheets. 📊 So I'm excited to see the new 2.0 version launch on PH today! 🔥There are so many new features to explore, from the API to the chart embeds, and the GPT-3 integration is just mind-blowing.” - Product Hunt.

A large number of integrations makes it easy for users to import and export data.
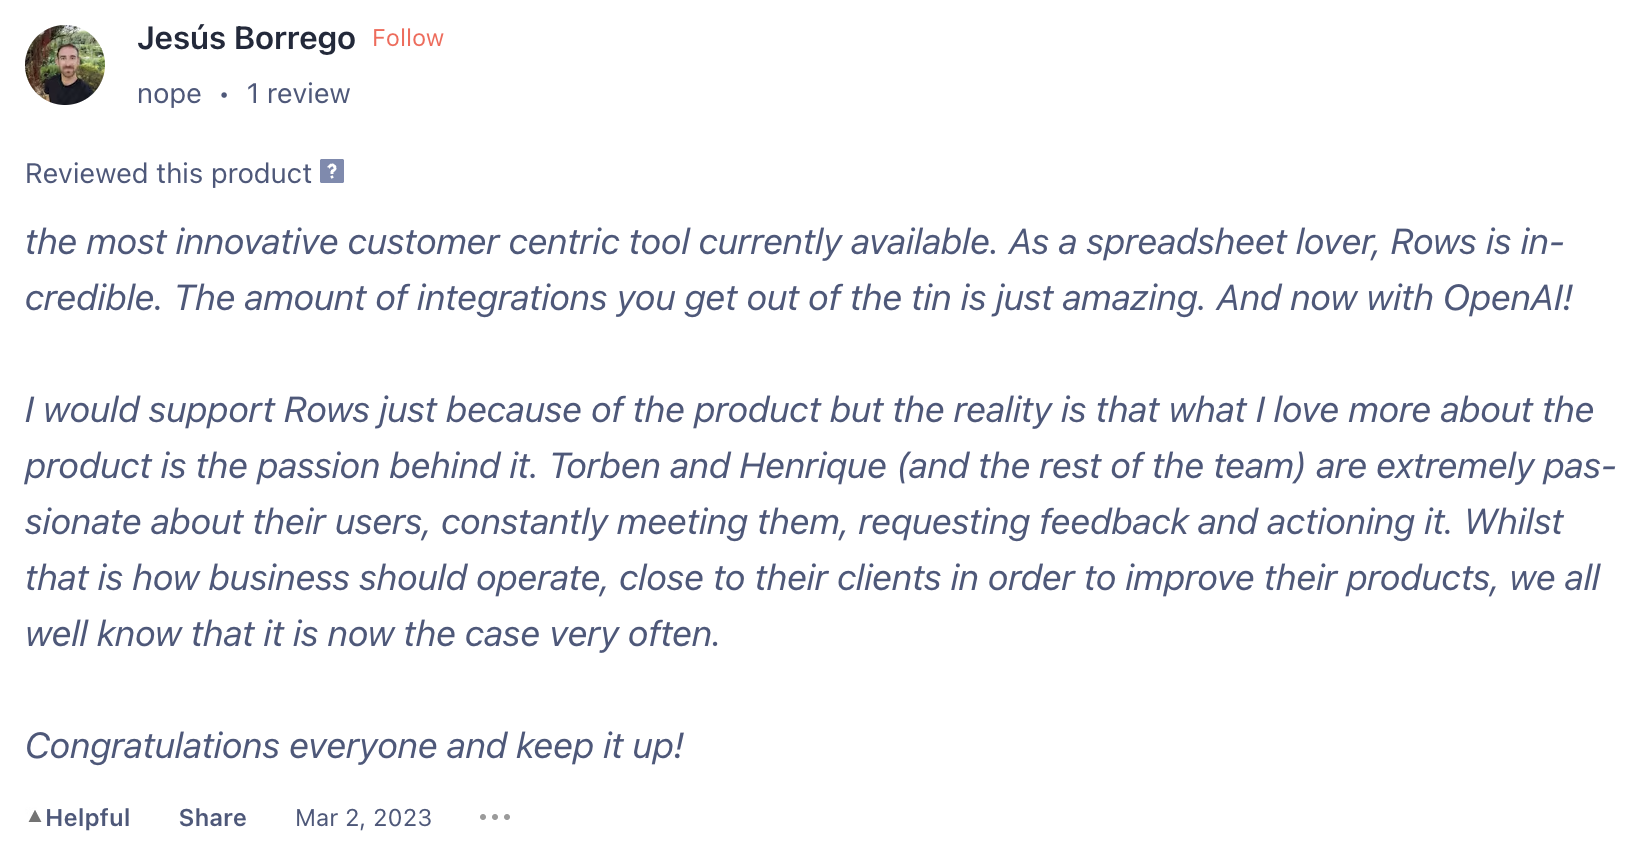
“The most innovative customer centric tool currently available. As a spreadsheet lover, Rows is incredible. The amount of integrations you get out of the tin is just amazing. And now with OpenAI!
I would support Rows just because of the product but the reality is that what I love more about the product is the passion behind it. Torben and Henrique (and the rest of the team) are extremely passionate about their users, constantly meeting them, requesting feedback and actioning it. Whilst that is how businesses should operate, close to their clients in order to improve their products, we all well know that it is now the case very often.” - Product Hunt.
Your new AI Data Analyst
Extract from PDFs, import your business data, and analyze it using plain language.
Try Rows (no signup)Google Sheets Reviews
According to the reviewer, editing and collaborating on Sheets is way smoother than Excel. It's real-time, and the mobile app is highly responsive to perform actions on the go. However, Google Sheets misses Excel's robustness and advanced data handling capabilities.

Another user, who is using Google Sheets for work, commends Sheets for its real-time collaboration and ease of use. Meanwhile, when working with large datasets and multiple collaborators, Sheets showed some severe slowdowns.

Excel Reviews
Based on this user review and similar ones, I realized Excel isn't great at handling large datasets. Of course, it's better than Sheets and Rows in this case, but it does take longer processing time.

Another user review was about how Excel, being a paid tool, lacks compatibility compared to Google Sheets and Rows. While the latter two are free to use and still more accessible than Excel.

Wrapping Up
I believe that with this detailed comparison, you’ll be able to choose a spreadsheet software that would suit your business needs the best.
Here’s a quick recap:
Rows’ AI capabilities, integrations, and unique features makes it one of the best spreadsheet software in the market. It can help you:
Make data analysis easier by leveraging AI, even for non-data-friendly users.
Build charts, graphs, and more elements that help you with data visualization.
Integrate with data warehouses, finance, marketing, and many more apps to import and export data.
Google Sheets is a great free spreadsheet software for individuals looking to analyze mid or large-sized datasets.
Microsoft Excel is a good spreadsheet software for companies dealing with large datasets and complex calculations.
If you or your team don’t have the time to try all three spreadsheet tools, go to Rows.com, import data, automate your report, and see if it's the right match!
Related Reading