9 Best Smartsheet Alternatives & Competitors in 2025

Smartsheet markets itself as a foundation for managing projects, programs, and processes that scale.
Some of these activities are often managed on a spreadsheet, despite not always being the most suitable tool, primarily due to the exceptional flexibility and widespread familiarity with the grid format.
Smartsheet borrows the typical grid interface to solve operational intensive tasks that require more interactive commands, such as a calendar view, task assignment options, GANTT charts, kanban boards, etc.
However, when you need an easy, advanced, and customizable way to transform, analyze, and visualize big chunks of data, Smartsheet may fall short.
In this article, I will tell you why you may want to try an alternative to Smartsheet and discuss the top ones in the market.

Your new AI Data Analyst
Extract from PDFs, import your business data, and analyze it using plain language.
Try Rows (no signup)Why Do You Need a Smartsheet Alternative?
There are three main drawbacks why you might feel the need to switch from Smartsheet to an alternative:
Smartsheet has a significant learning curve.
Doesn’t auto-save your work.
Has limited customization for visual output and inefficient workflows.
Let’s dive into these drawbacks individually.
Reason 1. Smartsheet Has a Learning Curve
With so many features and functionalities, Smartsheet can be overwhelming for new users, especially those who are not familiar with project management and workflow automation.
It may take time and effort to understand how to effectively use all the different tools and capabilities within the platform.
This drawback also often increases the onboarding time for clients or new team members, as they need to invest time and effort to learn the various features and how to use them effectively.

Reason 2. Limited Visualization Capabilities
There are several better alternatives to Smartsheet if you want software for data analysis and visualization. That’s because Smartsheet’s visualization capabilities are limited, and it offers little to no customization.
It has limited charts and graphs, limited card and board views to visualize projects, and limited templates to choose from.

Reason 3. Smartsheet has a Small Function Catalog
If you rely on advanced calculations and complex formulas for data analysis, Smartsheet might not be the best choice for you.
That’s because Smartsheet has a small function catalog of 90 formulas. However, when we look at its competitors, Rows has a function catalog of +150 and Excel of +450.
The limited function catalog of Smartsheet leads to a lack of flexibility in manipulating data with Smartsheet.
What are the Best Smartsheet Alternatives and Competitors
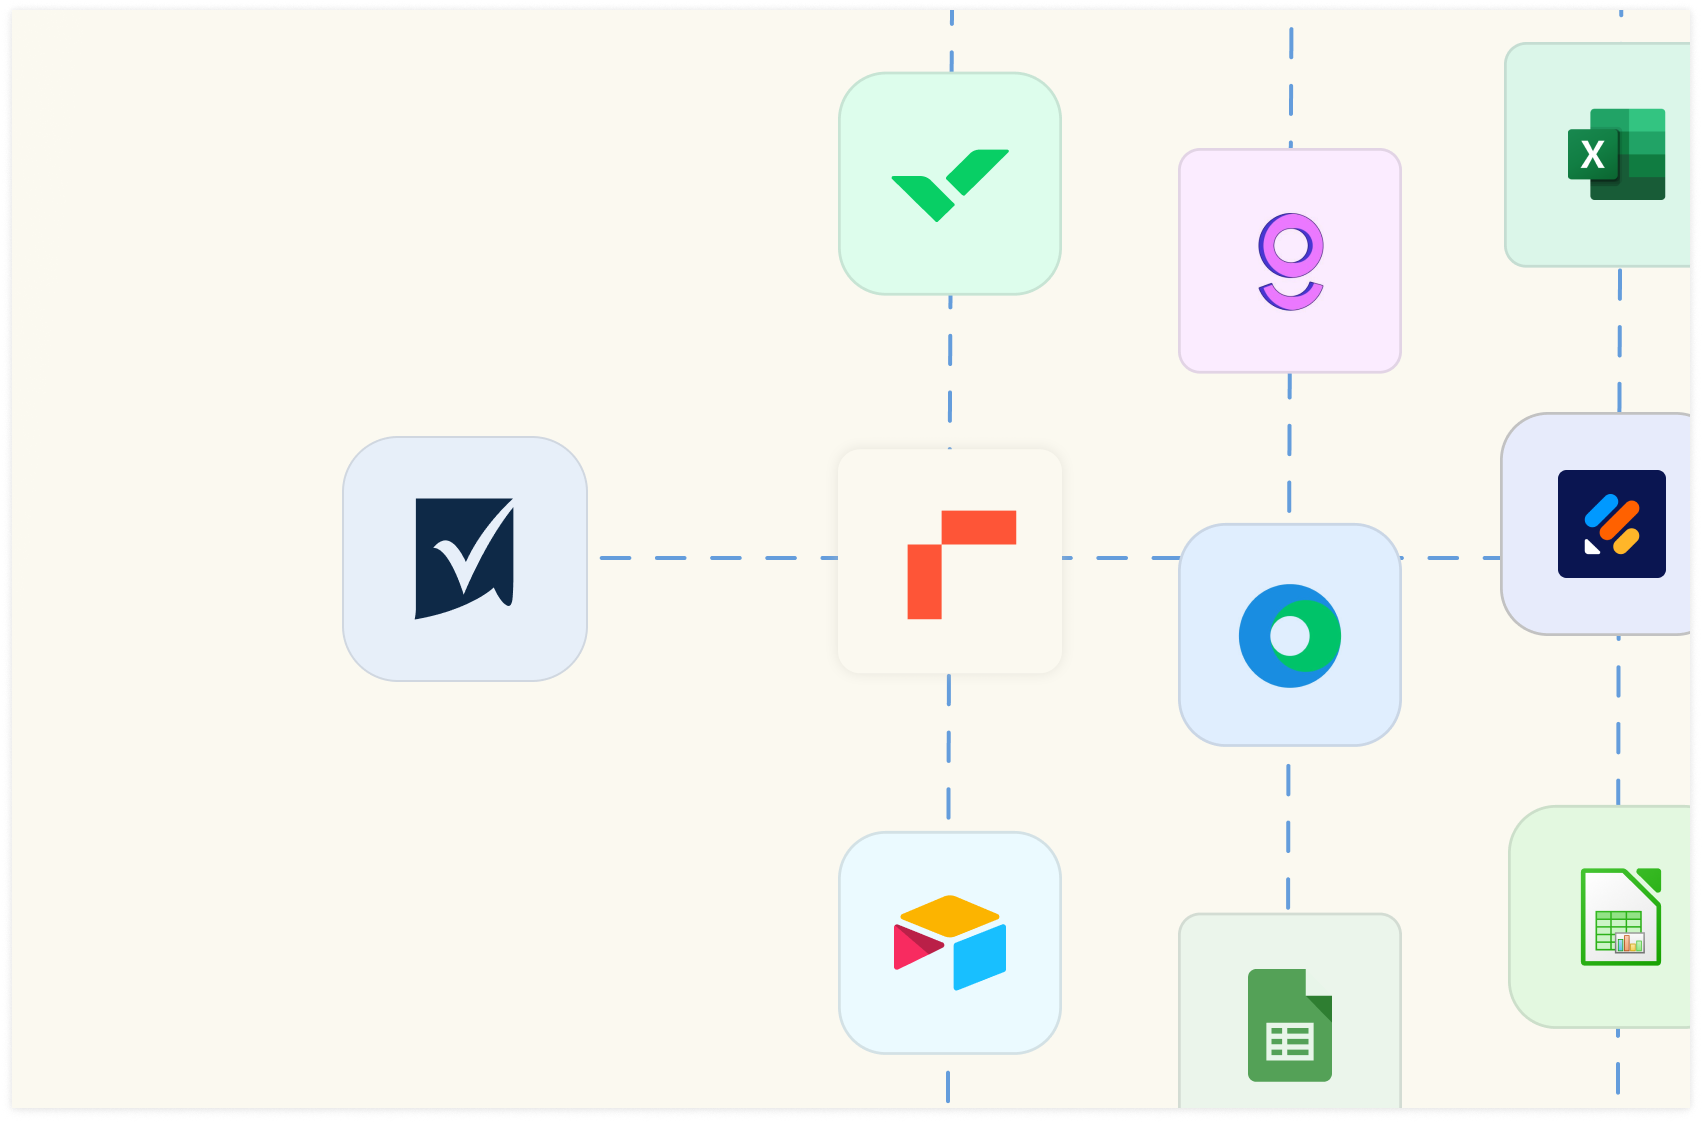
Some of the best alternatives to Smartsheet are:
Rows – The easiest way to analyze data on a spreadsheet.
Gigasheet – Cloud-based spreadsheet software designed to handle massive datasets.
Google Sheets – Create and collaborate on online spreadsheets in real time.
Microsoft Excel – Oldest yet most popular spreadsheet software
LibreOffice Calc – Free, open-source spreadsheet app
Jotform Tables – Intuitive spreadsheet tool that combines the power of data collection with automation.
Airtable – More vivid and colorful alternative to Smartsheet
Workzone – Project management software that offers data visualization tools, reports, and dashboards
Wrike – Versatile project management software for streamlining and visualizing project workflows
In my research, I discovered that users look for Smartsheet alternatives to solve two different issues:
Data transformation and analysis
Workflow building
Here’s a list of the best alternatives in the market in both these categories.
Category 1: Smartsheet Alternatives for Data Transformation and Analysis
Data transformation and analysis feature in any tool helps you convert raw data into meaningful insights so you can make informed data-driven decisions.
1. Rows
Rows is a spreadsheet software that provides extra flexibility when it comes to transforming and visualizing/sharing data.
It’s the easiest way to use data on a spreadsheet – from importing data directly from tools like databases and ad platforms to transforming and sharing it beautifully.
Feature 1. Data Integration
Rows makes it super easy for you to get your data into a spreadsheet with just a few clicks by integrating with 50 data sources.
All data connectors in Rows are built-in native features. You don’t need an external add-on to use AI in your analysis.
Curious about how Rows does it?
It handles JSONs in the grid and converts them into table format.
This feature comes in handy and saves time when building recurring reports or handling messy CSVs.
Some examples of data integration in Rows are:
Import Google Analytics 4 data to Rows and get key analytics and reporting. Pick one of the recommended reports or build your own custom view as follows:
Or you can:
Connect your LinkedIn page and track comments to your posts.
Connect Slack to Rows and set alert automation to your #social channel whenever a new comment appears on your social media posts. All from a spreadsheet.
Import a Notion database in Rows with a few clicks, enrich data, and send it back to Notion.
The HTTP source sends GET, POST, PUT, and PATCH requests to any endpoint using basic or API token authentication methods. This helps you retrieve data from tools that aren’t in the Rows catalog.
See how it works in the interactive demo below:
You feel ready to try it yourself?
💡 Try to make a GET request yourself with our HTTP Request Tester: input the endpoint, the headers and params and visualize the content of the response in a cell.
Feature 2. Inbuilt AI to Solve Complex Problems
Integration of AI in Rows makes it easy to do data analysis, even for non-data-friendly users. It lets you calculate complex problems using natural language rather than formulas.
What’s more, there’s no need for you to install any third-party plugin for the AI to work. Everything is in-built, leading to a seamless user experience.
Rows has three main AI components:
1. AI Functions
Rows integrates with Open AI for its 14 proprietary functions that automate prompts and address specific types of tasks.
Here’s one of the use cases of AI functions – EXTRACT_OPENAI in action:
Similarly, you can also execute sentiment analysis on a social media comment or product review using the function – SENTIMENT_ANALYSIS_OPENAI or clean up data using APPLY_TASK_OPENAI.
Discover more about all possible use cases of AI in Rows.
2. AI Analyst
Use natural language to ask data-related questions to our Analyst. It will do all the calculations for you, including descriptive statistics, data summarization, transformation and pivoting. Check out our guide or watch our demo.
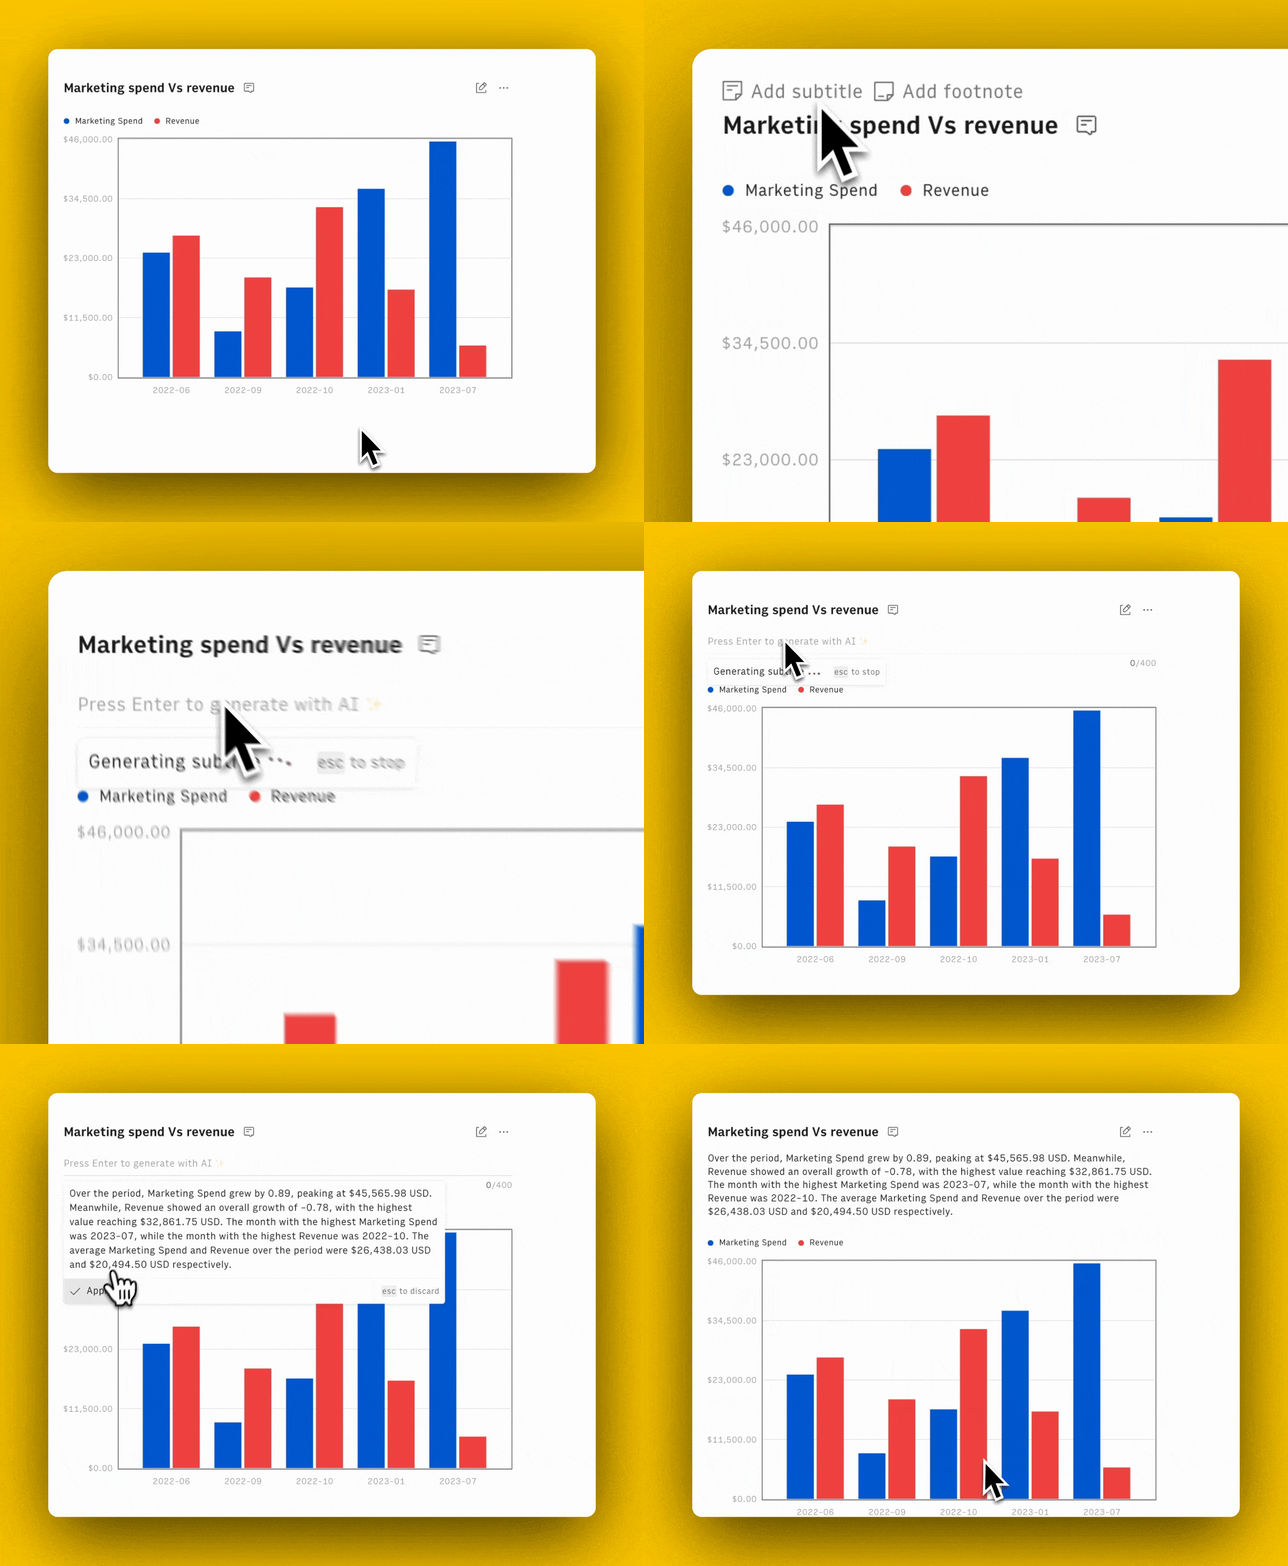
3. AI Subtitles
Ask AI to generate subtitles for your tables and graphs that include key insights from the data displayed.
Feature 3. Build Layout That Are Delightful to Share
Rows layout lets you build elegant dashboards that are great to share. See an example of our investor dashboard (numbers are dummy).
Apart from this, you can also embed tables and charts beautifully on Notion, Confluence, website, wiki, or other internal tools that support iframes with ease.
It’s a simple 4 step process:
Choose Embed in the settings menu located in the right-hand corner of the element you want to embed.
Click the Share Privately toggle.
Click <> Copy code. You can use the Copy link to paste directly into tools that automatically embed via the link - e.g., Notion.
Paste the embed code on your website, wiki, or destination tool.
See for yourself in the following interactive demo:
Learn how to use Embed in the most recent documentation tools, like Notion, Confluence, and Slite.
Pricing
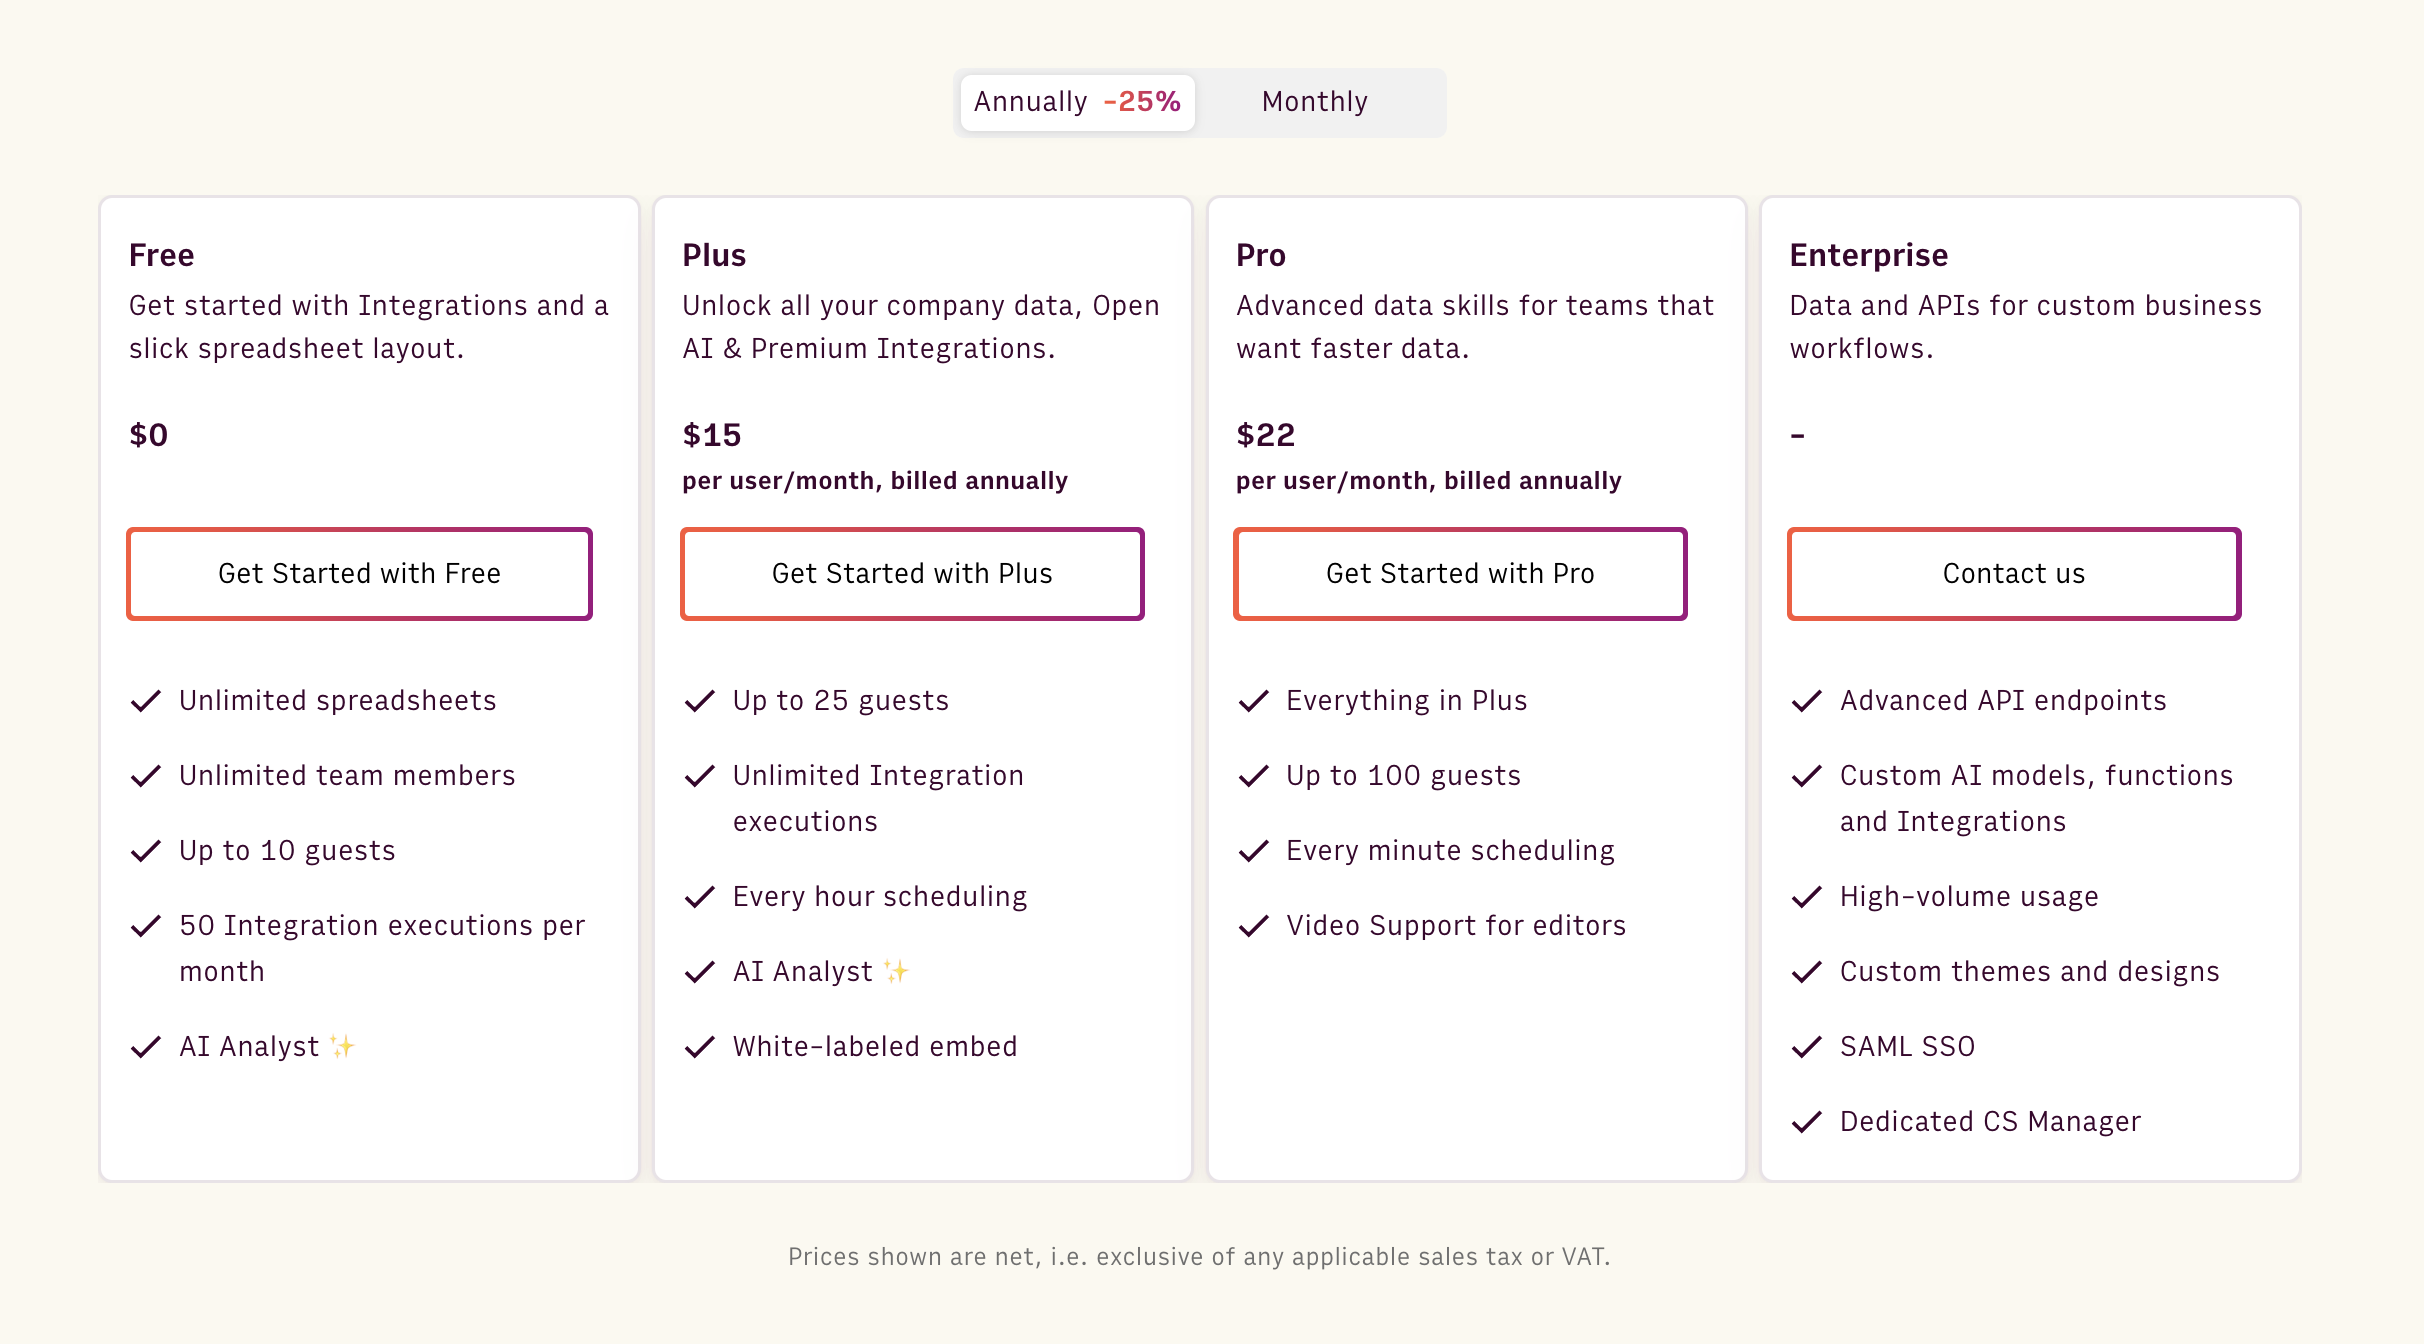
Rows offers a generous free plan where you can onboard unlimited members, up to 10 guests, and execute up to 50 integration tasks per month. If you want premium features and increased limits, Rows also offers 3 paid plans to choose from:
Plus: $15/month/member, up to 25 guests, unlimited integration tasks & daily data refresh.
Pro: $22/month/member, up to 100 guests, unlimited integration tasks & hourly data refresh.
Enterprise: Custom price for advanced API usage and workflows.
How Does Rows Compare to Smartsheet?
Smartsheet should be your go-to choice if you want to do resource planning, manage and track projects, or use spreadsheets for marketing processes and delivery.
However, if your priority is data analysis and transformation or you want to share/visualize data, Rows is a better spreadsheet software than Smartsheet.
In addition to data analysis and transformation features, some workflows built on Smartsheets can be replicated on Rows thanks to its data integration, but the overall focus of the platform is substantially different.
The ease with which you can build dashboards and share reports with Rows is unmatched.
Pros and Cons
✅ AI functions, Analyst, and subtitles make data analytics easy for beginners.
✅ Lets you make spreadsheets interactive using buttons, input fields, and data pickers.
✅ Has easy-to-use API, so you can import data into Rows from anywhere.
❌ Rows does not have a desktop app, which caps its performance with big chunks of data.
Curious to see Rows in action? Get a head start with our Google Analytics templates, such as SEO Backlink Checker or Social media report.
Wanted to try out ChatGPT on the grid? Use one of our templates and explore how to extract, classify, or clean up data using only natural language.

Your new AI Data Analyst
Extract from PDFs, import your business data, and analyze it using plain language.
Try Rows (no signup)2. Gigasheet
Gigasheet is a cloud-based spreadsheet software designed to handle massive datasets. It helps explore and analyze huge databases without the issue of storage while keeping AI by your side.
Features
Gigasheet lets you merge scattered data sheets into a unified master-sheet for quick and easy data analysis.
Use Gigasheet's cross-file VLookup function to correlate data between multiple sheets simultaneously.
Has dedicated tools for data cleanup, such as duplicate remover, for harmonizing and preparing data for analysis.
Create nest queries using conditional filters, AND/OR, or even wildcard and Regex matching without requiring special syntax.
Ask AI to filter, group, and aggregate data on your request using natural language commands.
Offers version control features, allowing you to review or restore previous versions of your sheets if necessary.
Pricing
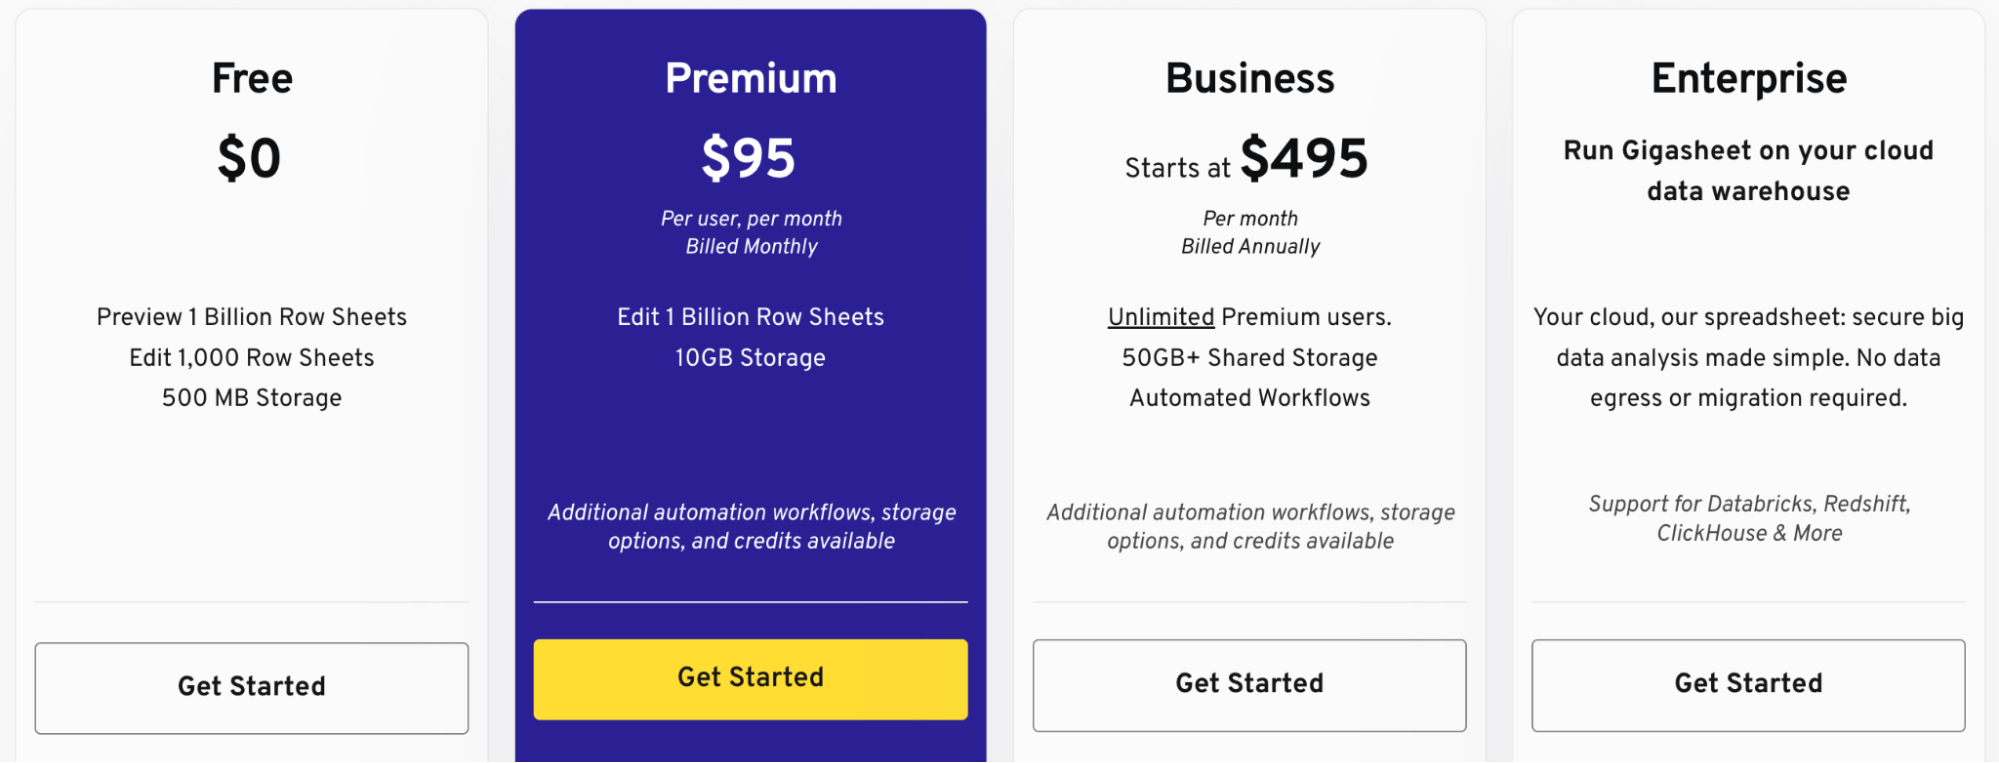
Gigasheet offers a free forever plan with 500 MB of data storage, AI assistance, and basic data analysis features. Apart from the free plan, it also offers three paid plans to choose from:
Premium: $95 per month
Business: $495 per month
Enterprise: Custom Pricing
Pros and Cons
✅ Gigasheet can handle and analyze large datasets.
✅ Supports various file formats, including CSV, JSON, HTML, and more.
❌ Lacks granular features like in-cell editing.
❌ Slight rendering time for large JSON files.
3. Google Sheets
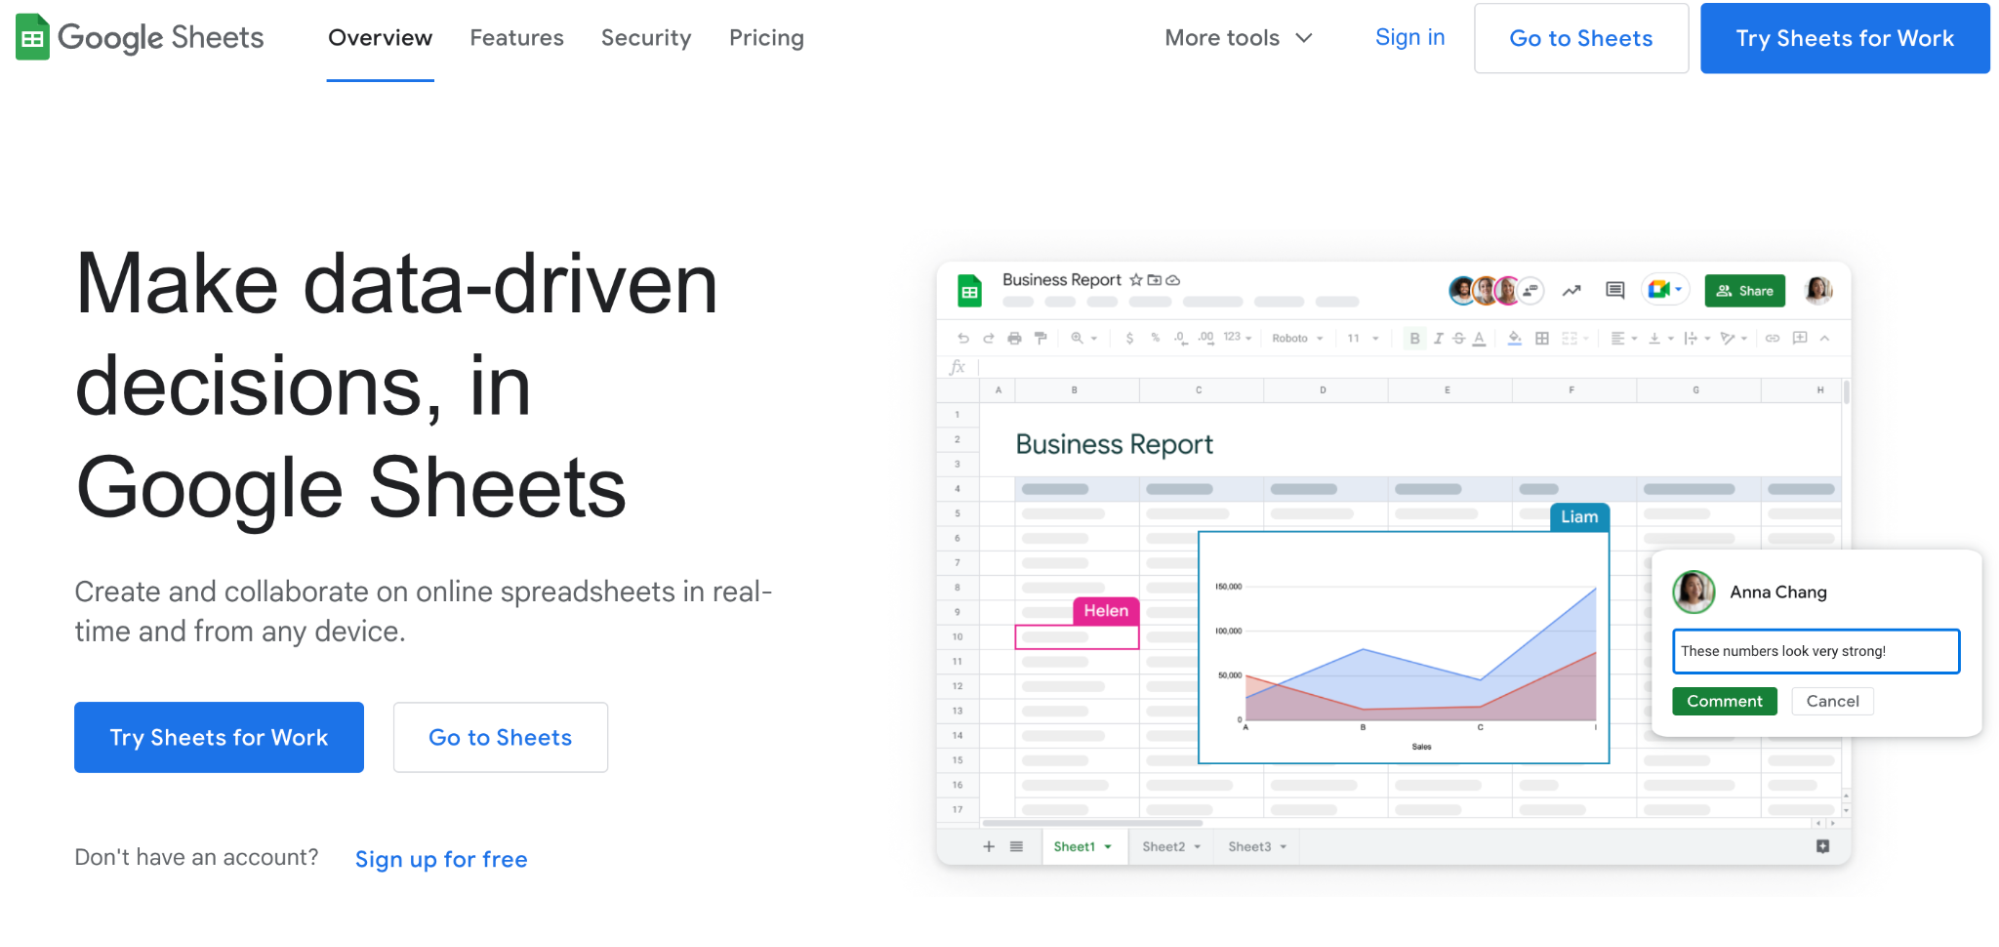
Google Sheets is a free spreadsheet software in the Google Suite. The software helps you create and collaborate on online spreadsheets in real-time from any device.
Features
Google Sheets provides data validation and cleanup tools to harmonize and prepare bulk datasets for analysis within minutes.
Perform granular analysis using in-cell comments, notes, smart chips, cell version history, and cell data validation.
Comes with advanced features like autofill, formula suggestions, and auto-corrections that minimize errors and speed up the data analysis process.
Google Sheets has an extensive gallery of preset functions and formulas in 20+ languages, allowing cross-border teams to analyze and automate calculations.
Real-time versioning makes it easy to undo, redo, and review data changes in specific cells or entire spreadsheets as they happen.
Pricing
Google Sheets is available as part of Google Workspace. Like all other apps in the Google Workspace, it’s free for personal use, but there's also a paid plan with extensive cloud storage and priority support priced at $12 per user per month.
Pros and Cons
✅ Google Sheets is easy to use, with little to no initial learning curve.
✅ Promotes real-time collaboration via comments, mentions, and versioning.
❌ Has limited options for customization and a smaller set of advanced formulas and functions.
❌ Integration capability is limited to native connectors and apps in the Google Workspace Marketplace.
4. Microsoft Excel
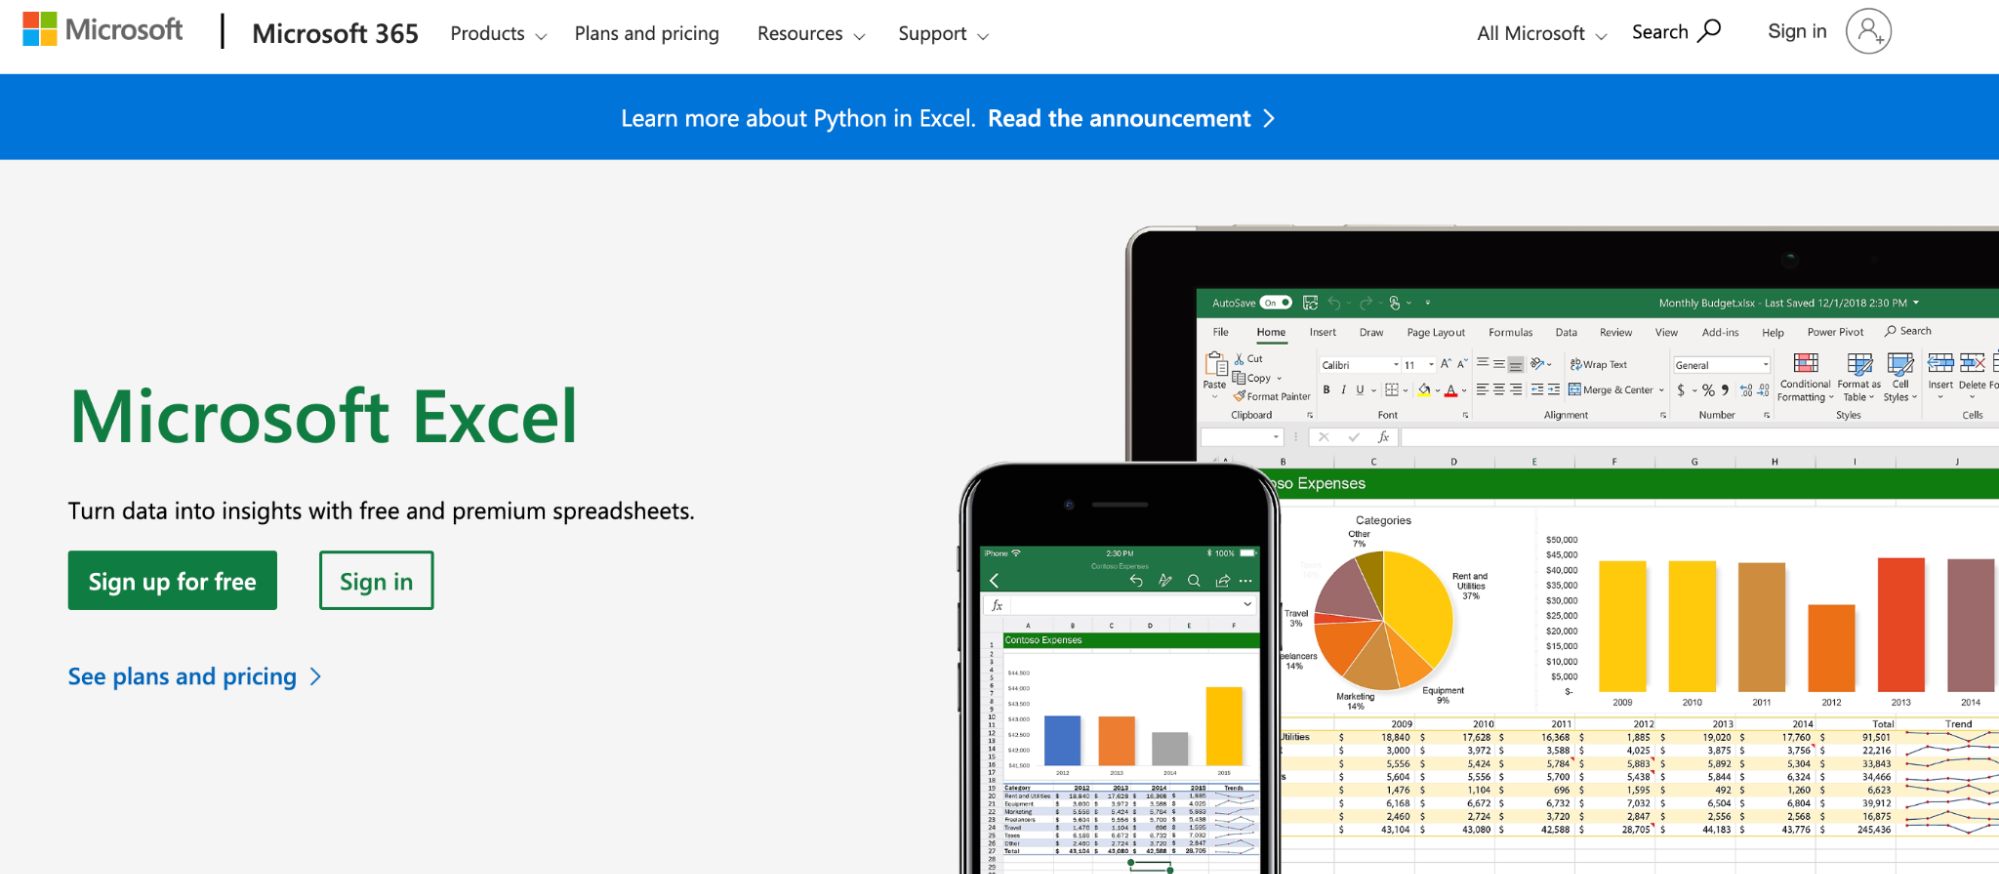
Microsoft Excel is the oldest yet most popular spreadsheet software for organizing, managing, and analyzing work data. Although old-school, Excel's recent AI integration has made it a formidable competitor to Smartsheet.
Features
Excel's AI Copilot lets you analyze data for trends, propose what-if scenarios, and suggest ideas for data harmonization via simple text-based commands.
Use AI to automatically sort, highlight, and filter tables and quickly draw attention to what matters the most.
Excel has 450+ functions and formulas, including popular ones like VLOOKUP, SUMIF, COUNT IF, and more. You can also ask Copilot to generate or suggest formulas and explain how they work.
Has built-in optical character recognition (OCR) tech to convert data stored in physical documents into a fully editable Excel table.
Create Macros in Excel to automate repetitive tasks such as auto-filling cells, updating cell values, and applying auto-formatting.
Pricing
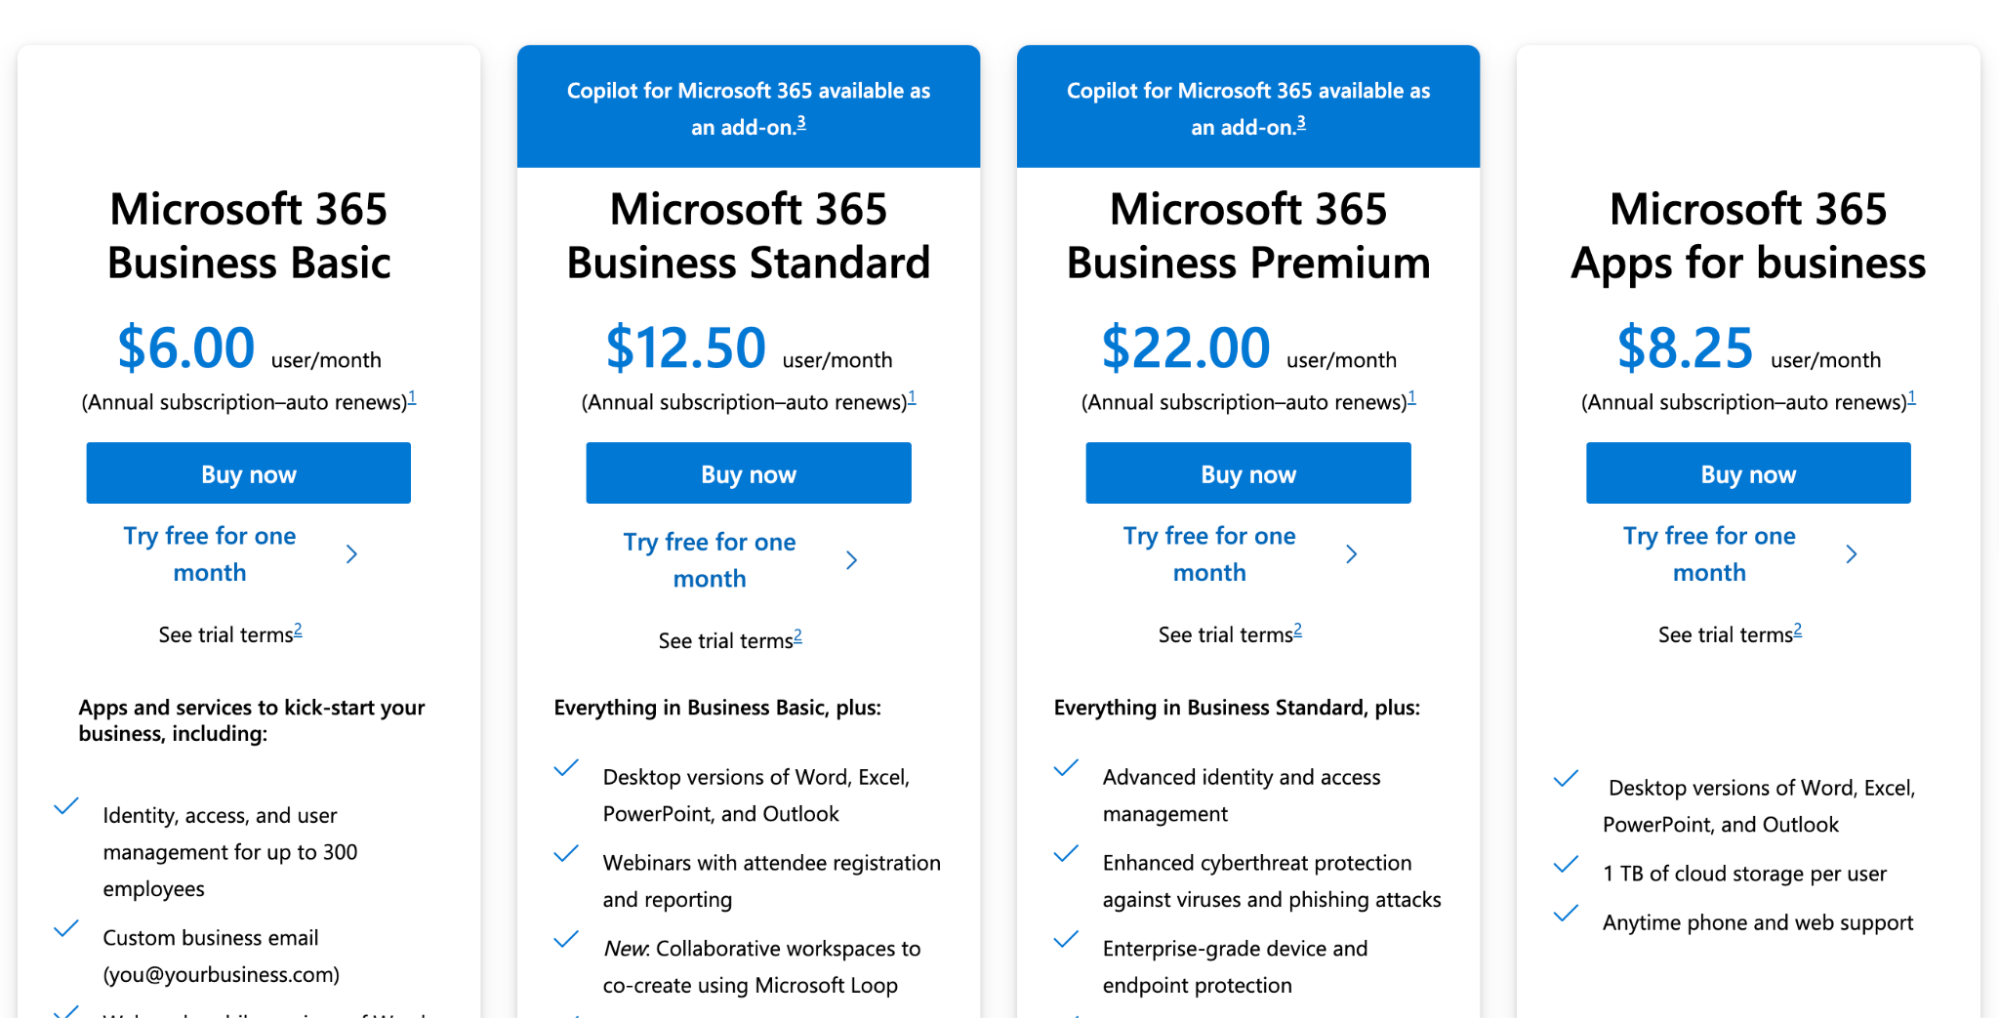
Microsoft Excel is free to use online and available (paid) as part of the Microsoft 365 product suite for on-premise usage. It has two subscription categories for personal and professional use:
For Home
Personal: $6.99 per month
Family: $9.99 per month
For Business
Basic: $6 per user per month
Standard: $12.50 per user per month
Premium: $22 per user per month
Pros and Cons
✅ Free to use (web-only).
✅ Integrated AI capabilities for quick and accurate data analysis.
✅ Has an extensive library of functions.
❌ Excel on-premise app faces versioning issues, making it hard to collaborate on data with teams.
5. LibreOffice Calc
LibreOffice Calc is a free, open-source spreadsheet app offered within LibreOffice Suite.
Calc's spreadsheet-like interface makes it easy to use for non-data-friendly users, while its comprehensive data analysis functions benefit professional data analysts.
Features
LibreOffice Calc offers a comprehensive range of functions and formulas for various purposes, such as mathematical, statistical, and financial calculations.
Has a function wizard that lets you create formulas and explain how a particular formula was composed.
Use Scenario Manager to run different cell values in your calculations and instantly view the results of changes.
LibreOffice's advanced formula editor, coined as Math, allows the creation of sophisticated mathematical and scientific formulas using elements like fractions, exponents, integrals, and matrices.
Calc provides traditional data analysis functions to arrange, organize, sort, format, hide, or sum up cells for quick and efficient data analysis.
Advanced DataPilot tech makes it easy to load data from corporate databases and cross-tabulate, summarize, and convert it into meaningful information.
Pricing
LibreOffice Calc is a free open-source software.
Pros and Cons
✅ LibreOffice Calc is free to use.
✅ Allows you to edit and modify Excel spreadsheets.
✅ Offers advanced functions and valuations for in-depth data analysis.
❌ Calc doesn't work online.
Category 2. Smartsheet Alternatives for Workflow Building
Establishing a well-defined workflow helps data analysts streamline their processes, automate repetitive tasks, and work more efficiently.
6. Jotform Tables
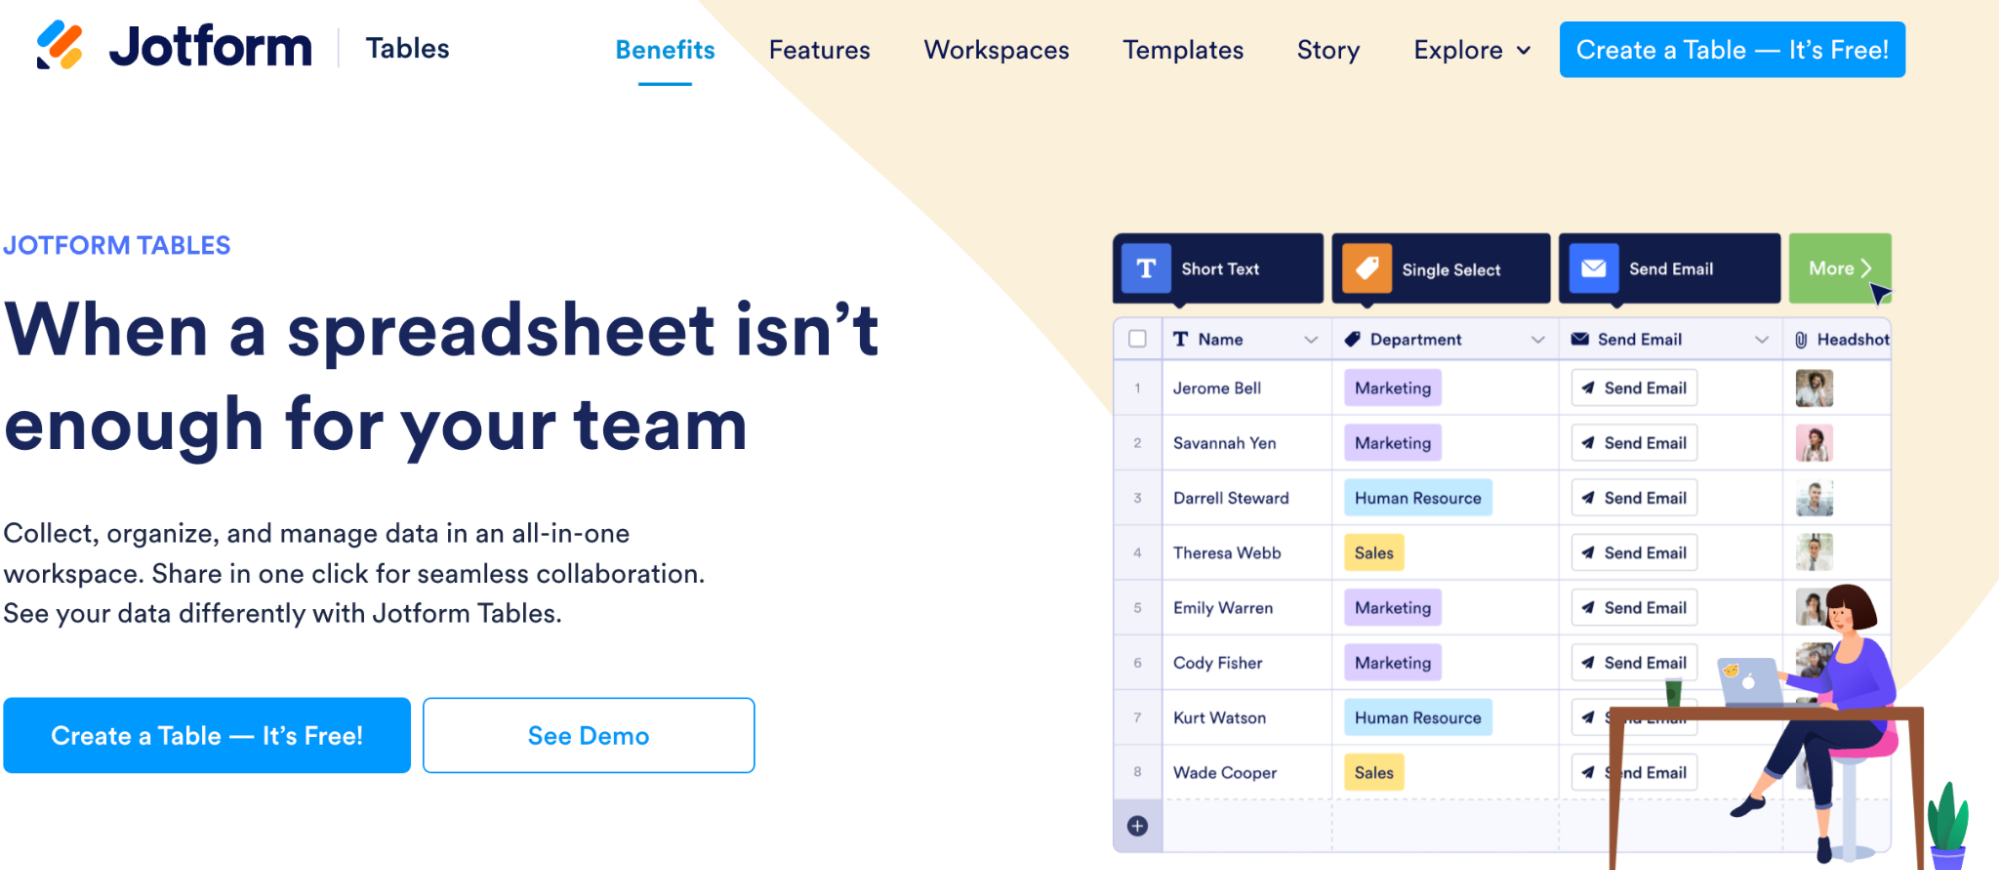
Jotform Tables is an intuitive spreadsheet tool that combines the power of data collection with automation and in-depth analysis. It enables easy data import using robust integrations and assists in data harmonization with preset functions and tools necessary for data analysis.
Features
Jotform allows you to auto-populate tables for analysis by collecting responses via dynamic forms or directly uploading CSV or Excel files.
Tables let you organize and manage datasets using preset columns, labels, groups, filters, advanced search, and formulas.
Build dynamic formulas to automatically add up totals and calculate or combine text, numeric, and logical functions.
Lets you link cells from multiple tables or even entire tables, so when data changes, your linked cells or tables automatically adjust to it.
Use action buttons to create workflows between 270+ products or third-party apps, including Google Sheets, to complete tasks without leaving the spreadsheet.
Pricing
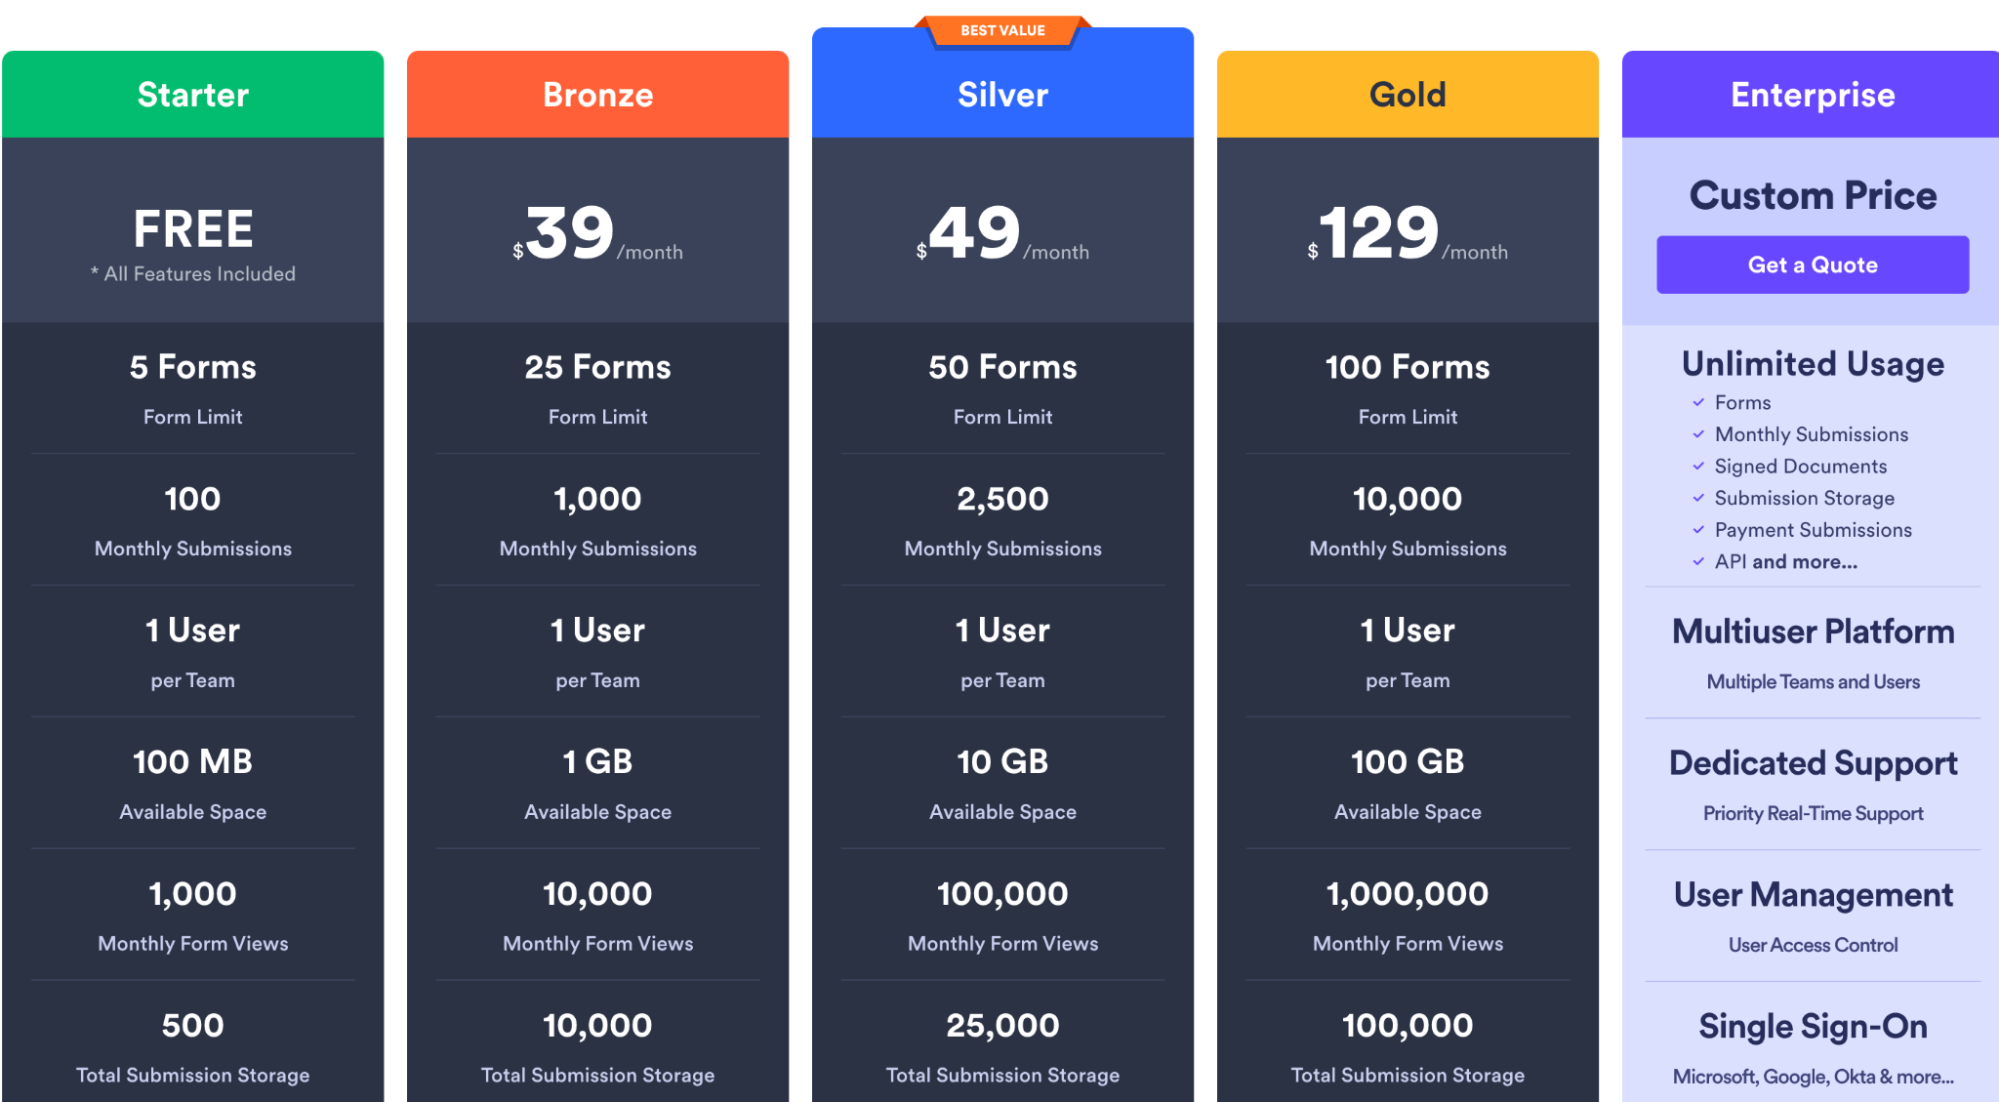
Jotform offers a free forever plan with some basic features and four paid plans:
Bronze: $39 per month
Silver: $49 per month
Gold: $129 per month
Enterprise: Custom pricing
👀 Note: Jotform offers discounts for educational and non-profit purposes.
Pros and Cons
✅ Let you add custom data fields in forms and side-by-side custom columns in tables to store responses on that field.
✅ Integrates with CRMs, data warehouses, and popular apps.
✅ Jotform is cost-effective and easily scalable as your team grows.
❌ Extensive features and functionalities levy an initial learning curve for new users.
❌ Lacks proper customer support.
7. Airtable
Airtable is a more vivid and colorful alternative to Smartsheet. It offers AI-powered features to automate data workflows, perform data visualizations, and collaborate on the go.
Features
Airtable offers seven distinct views — List, Grid, Timeline, Gantt, Gallery, Calendar, and Form views — to organize and manage data across departments and roles.
Airtable's gallery view helps add context to data by showcasing images, designs, and creativity more effectively and in a comprehensive, organized format.
Leverage Airtable extensions to create dashboards using charts, graphs, and top-line metrics to suit your team's reporting use cases.
Use Airtable AI to get suggestions and feedback on improving data visualizations.
Airtable has a gallery of ready-made templates for tracking and planning data without starting from scratch.
Pricing
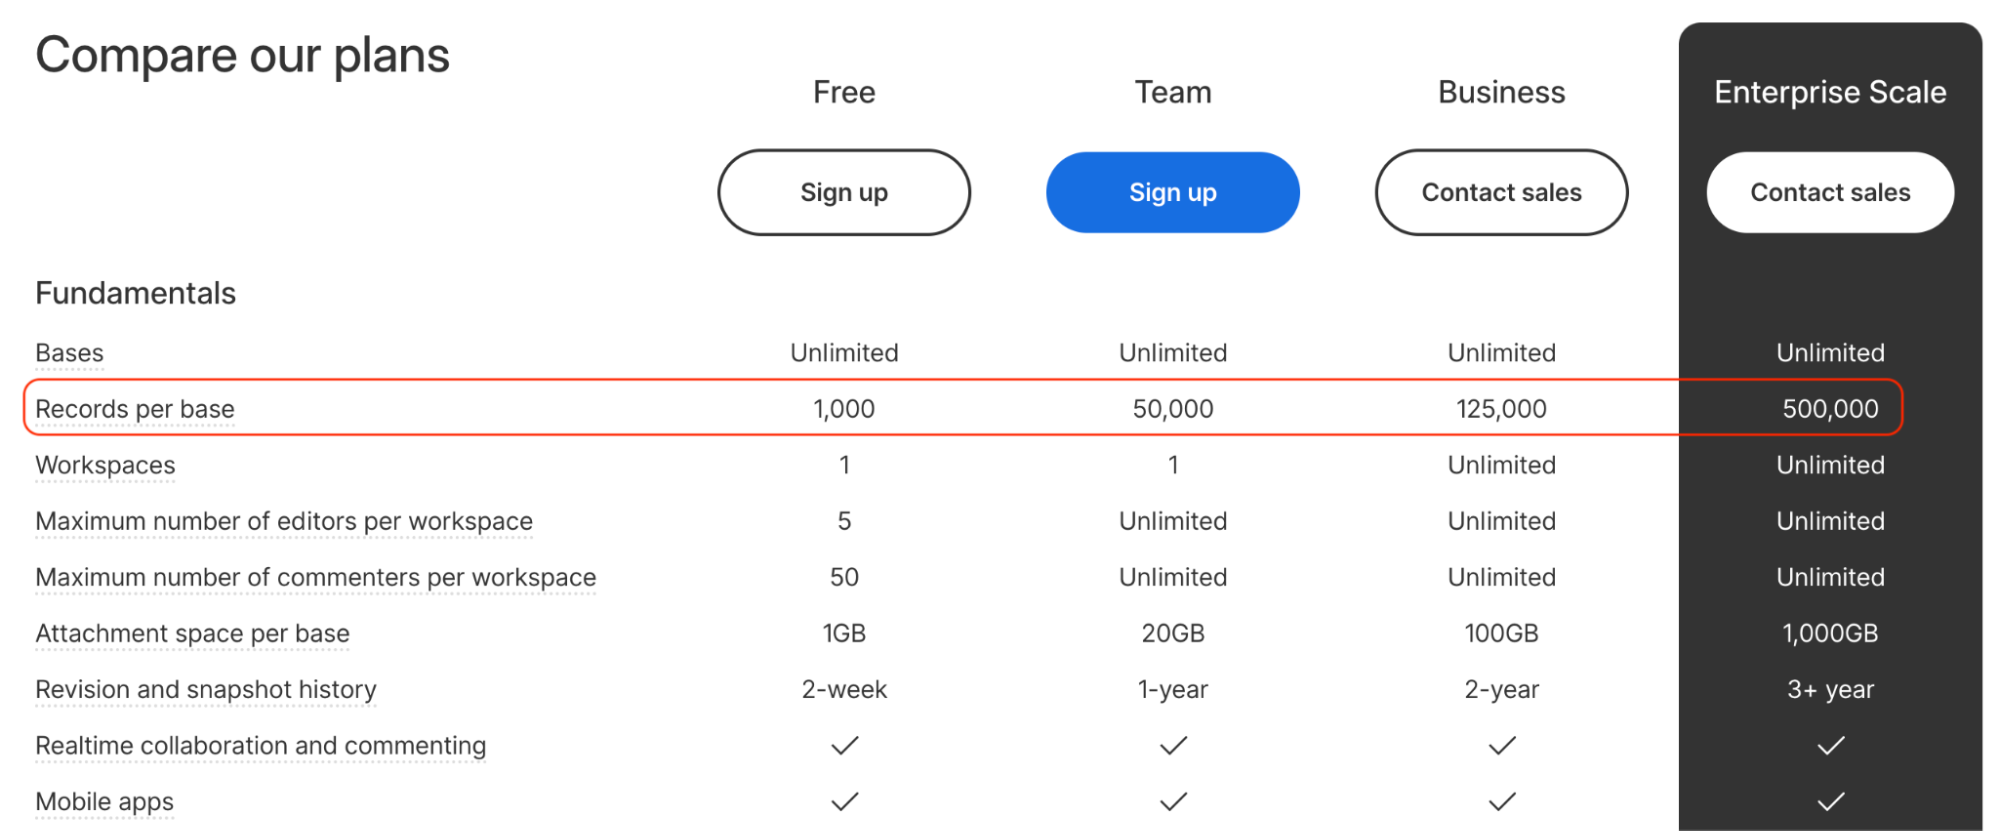
Airtable offers a generous free version with unlimited bases, 1,000 records per base, and 5 editors. It also has three paid plans:
Team: $24 per seat per month
Business: $54 per seat per month
Enterprise: Custom pricing
Pros and Cons
✅ Integrated AI capabilities.
✅ Integrates with apps such as Gmail, Twilio, or custom apps via Zapier.
✅ Offers multiple views to manage data (more views than Smartsheet).
❌ Lacks certain advanced features found in specialized data analysis tools.
❌ Becomes expensive as your team scales because of user-based pricing.
8. Workzone

Workzone is a project management software that offers data visualization tools, reports, and dashboards to increase team productivity and efficiently manage data.
Features
Workzone provides a unified project dashboard offering a big-picture view of all projects, which is great for status review meetings.
Has an extensive gallery of 20+ project reporting and dashboarding templates for different industries and versatile purposes.
Leverage interactive Gantt (timeline) chart to graphically represent project schedules across a timeline.
Use Workzone's workload reports to identify resources that are over/under-allocated using colors, charts, and graphs.
Pricing
Workzone offers three subscription plans with the most advanced features (increases as you upgrade) and unlimited training and support:
Team: $24 per user per month
Professional: $34 per user per month
Enterprise: Custom pricing

Pros and Cons
✅ Impressive reporting and dashboarding templates for data visualization.
✅ Allows you to save projects as templates.
✅ Lightning-fast support (promises under 10 mins) and personalized training.
❌ No free version is available.
❌ Workzone's UI is slightly outdated.
9. Wrike
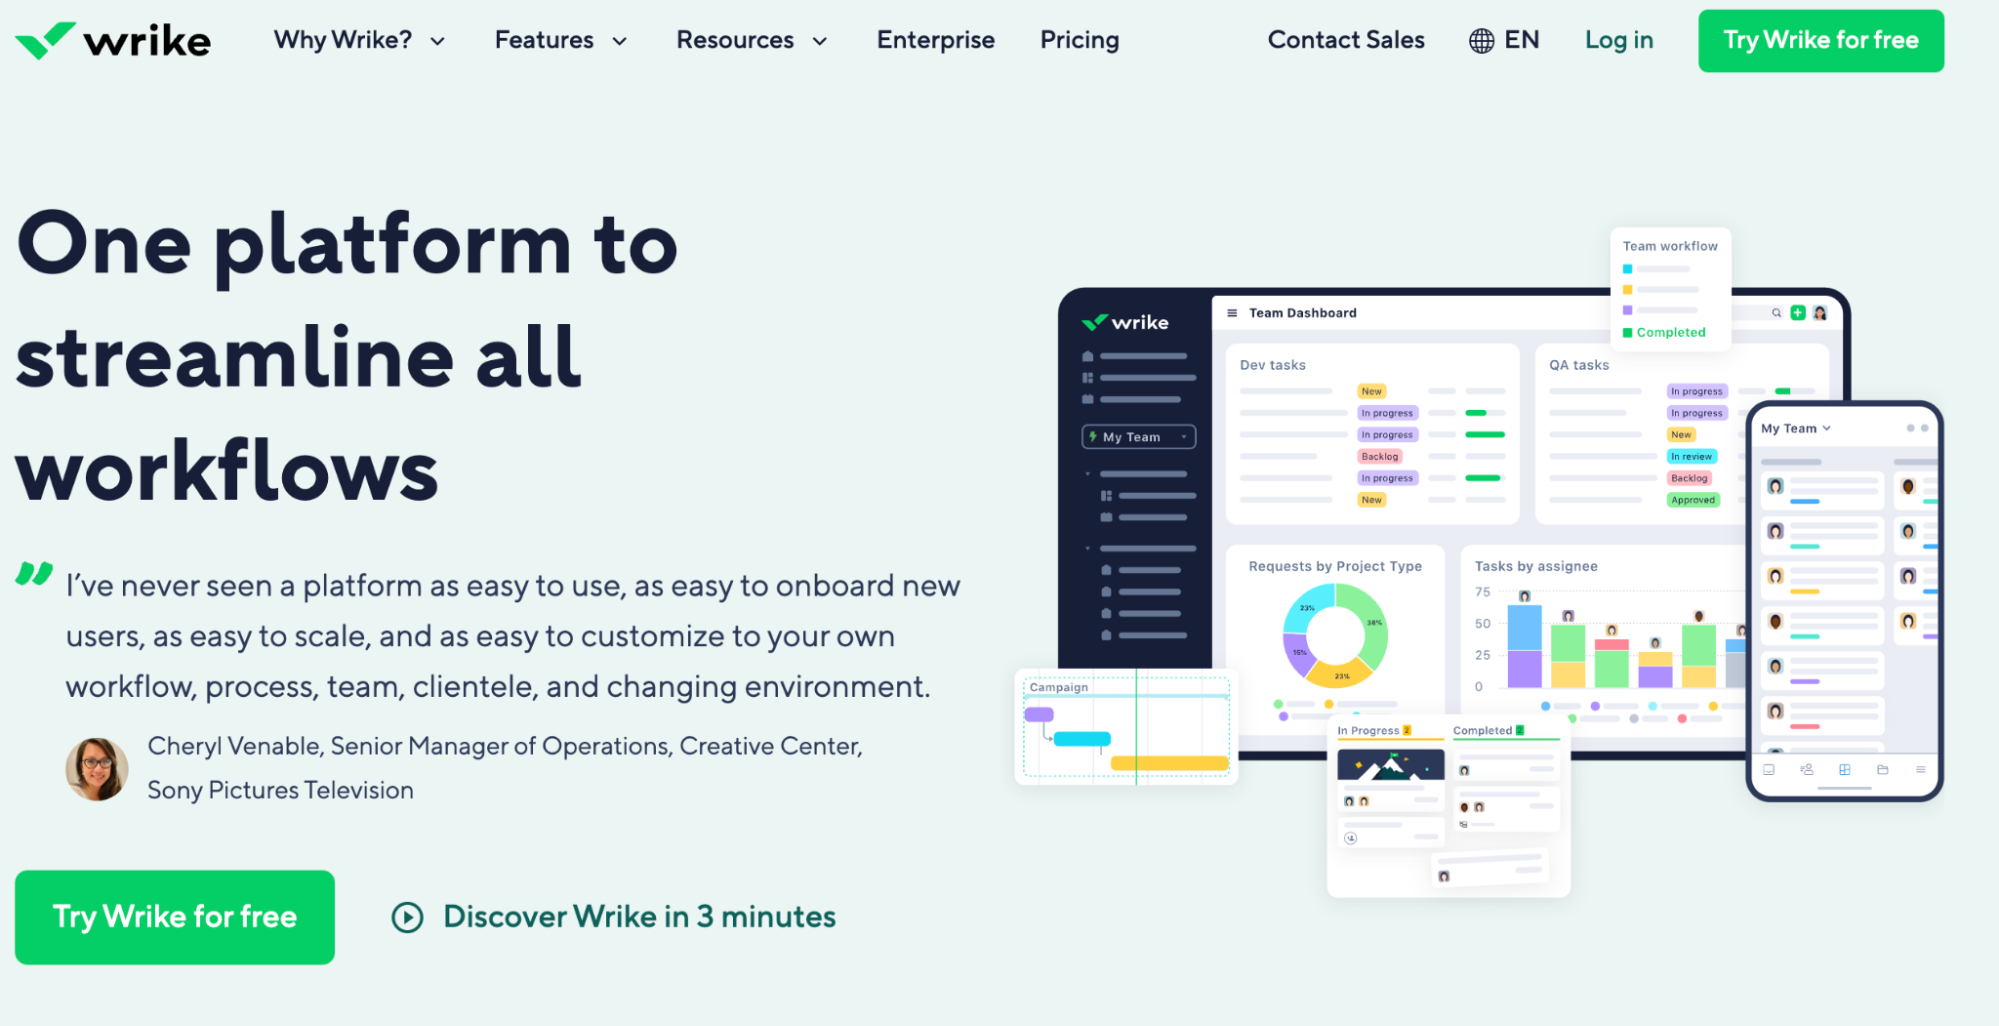
Wrike is a versatile project management software for streamlining and visualizing project workflows. Although not a typical spreadsheet software, Wrike helps visualize results, plans, and workloads via highly visual dashboards and analytics.
Features
Wrike provides 5+ customizable views, including Board, List, Kanban, Gantt, and Table, to organize and manage data.
Has an extensive gallery of 60+ agile project management templates for IT, marketing, sales, manufacturing, and other departments.
Leverage the drag-and-drop builder to create interactive reports with customizable widgets and advanced charts, such as scatter plots, burnup, and burndown charts.
Allows you to customize widgets to visualize data based on custom formulas and filters.
Pricing
Wrike offers a free forever plan with unlimited users and 2 GB storage but limited features. To get the most out of Wrike's visualization features, you can opt for its paid plan:
Team: $9.80 per user per month
Business: $24.80 per user per month
Enterprise: Custom pricing
Pinnacle: Custom pricing

Pros and Cons
✅ Integrated AI capabilities for content generation.
✅ Accessible via web, desktop, and mobile app.
✅ Wrike supports multiple languages.
❌ Wrike’s UI is hard to navigate, posing an initial learning curve for new users.
❌ Some features on the mobile version are not available on the desktop version.

Your new AI Data Analyst
Extract from PDFs, import your business data, and analyze it using plain language.
Try Rows (no signup)Automate Data Analysis with Rows
All the tools mentioned above are great alternatives to Smartsheet and successfully alleviate Smartsheet’s drawbacks. Data analysis and visualization are among the most important processes of any growing business.
But how do you find out which Smartsheet alternative is right for you?
Well, there’s no better way than signing up for free trials and judging products for yourself.
If you or your team don’t have the time to try every product on our list, go to Rows.com, import data, automate your report, and see if it's the right match!
