
Keyword Ranking Report Template
Find the keywords that bring the most people to your website, see what people search about on your site, and hone in on organic search terms that individual pages on your site rank for on Google.
 100% spreadsheet
 Connected to your data
 Daily+ refresh
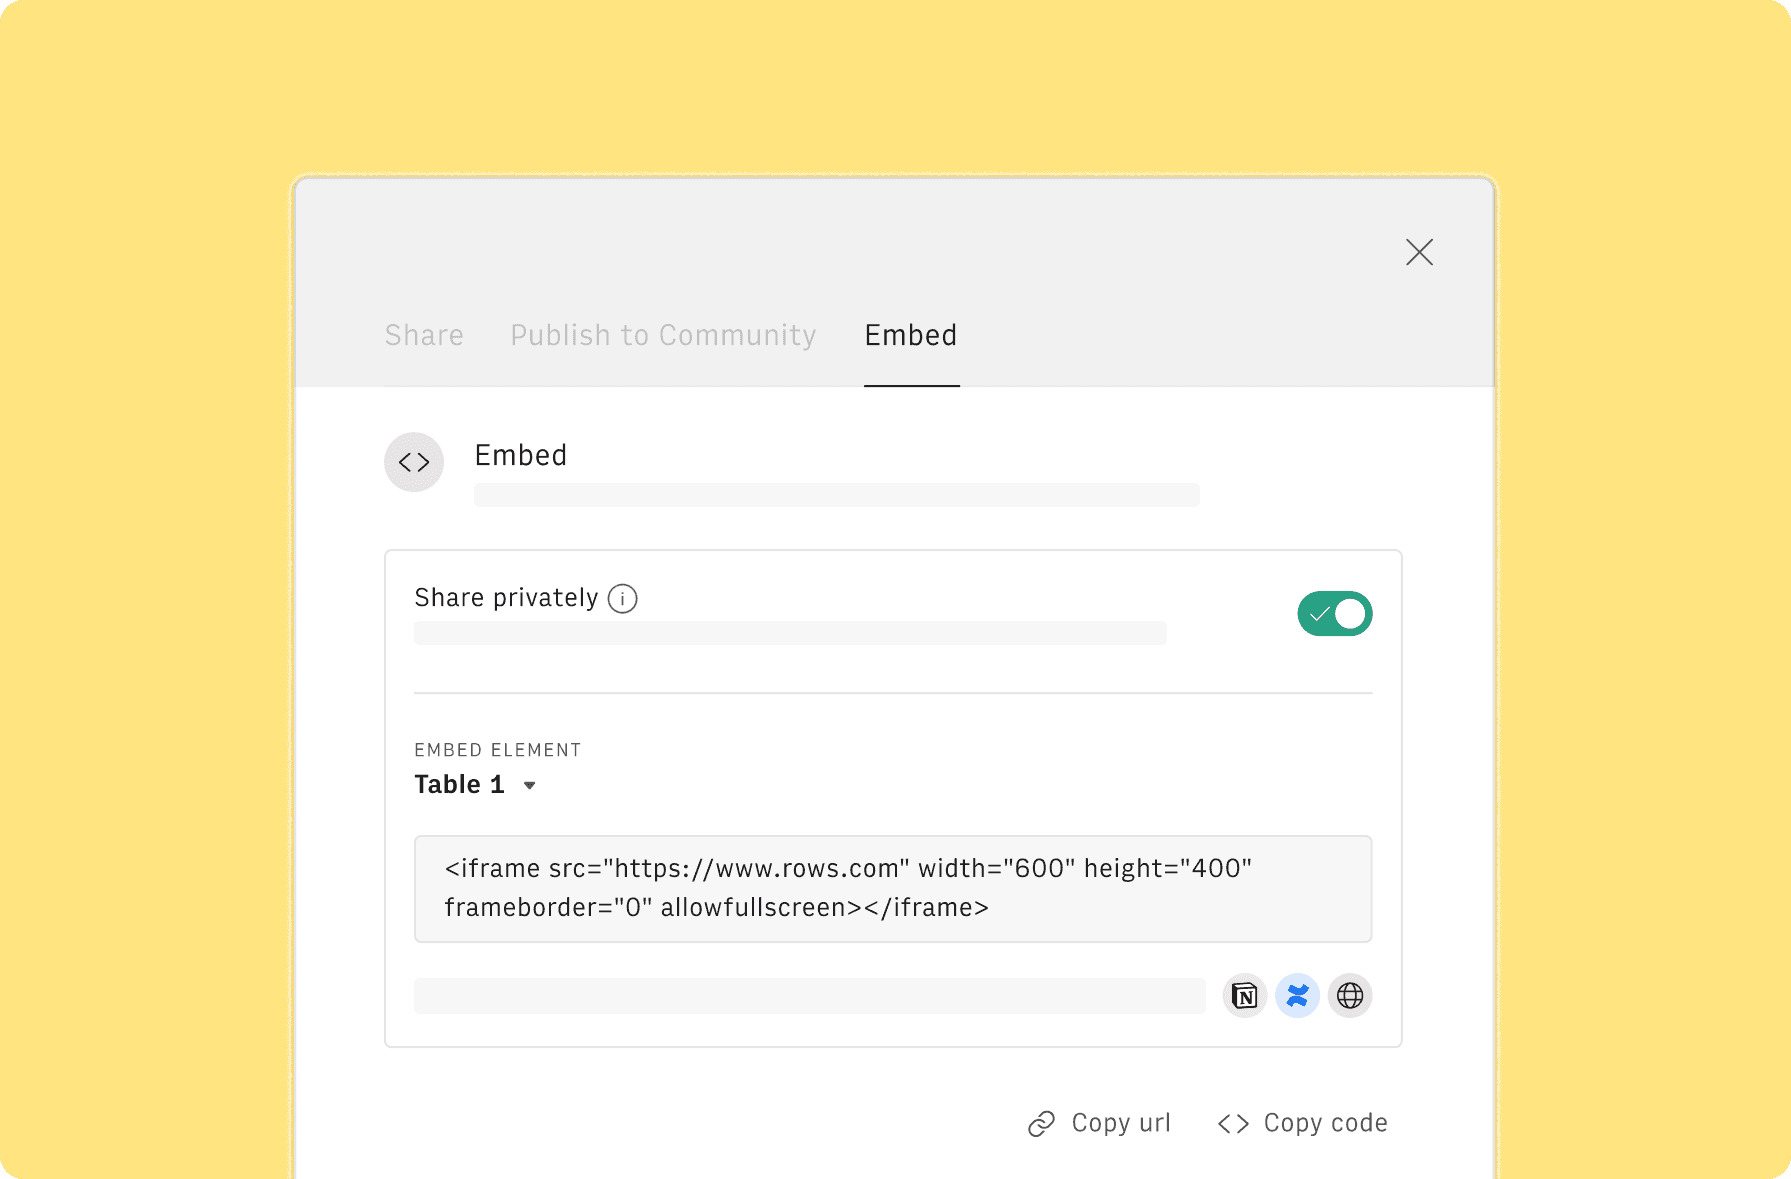
 Embed everywhere
About Keyword Ranking Report Template
What is a keyword ranking report template?
The keyword ranking report template is used to find the highest-ranking keywords on your website.
This template makes use of live data from GSC and GA4 accounts. When you connect your accounts to Rows, this report template automatically drafts out insights from these live data sources about your webpages. This template gives you a bird-eye view about what your prospects search about on your site and hone in on organic search terms that individual pages on your site rank for on Google.
At Rows, we believe that keyword research is at the core of every brand’s content marketing strategy — and we practice it wholly — because it powers your brand visibility on search engines.
This template acts as a revealer to map out all the search keywords that bring people to your most popular pages and drafts out all of your keyword data in a spreadsheet.
What can you do with this SEO keyword ranking report template?
With this SEO keyword ranking report template, you can:
- Map high-potential keywords to your current pages, identifying where you can improve on-page SEO to boost rankings for valuable search terms.
- Group keywords by user intent and topic to gain insights into different segments of your target audience, informing buyer persona development and content strategy.
- Analyze which keywords trigger specific SERP features (like featured snippets or People Also Ask boxes) to optimize your content for these high-visibility placements.
How to use this keyword ranking report template?
Below are steps on how to use our keyword ranking report template:
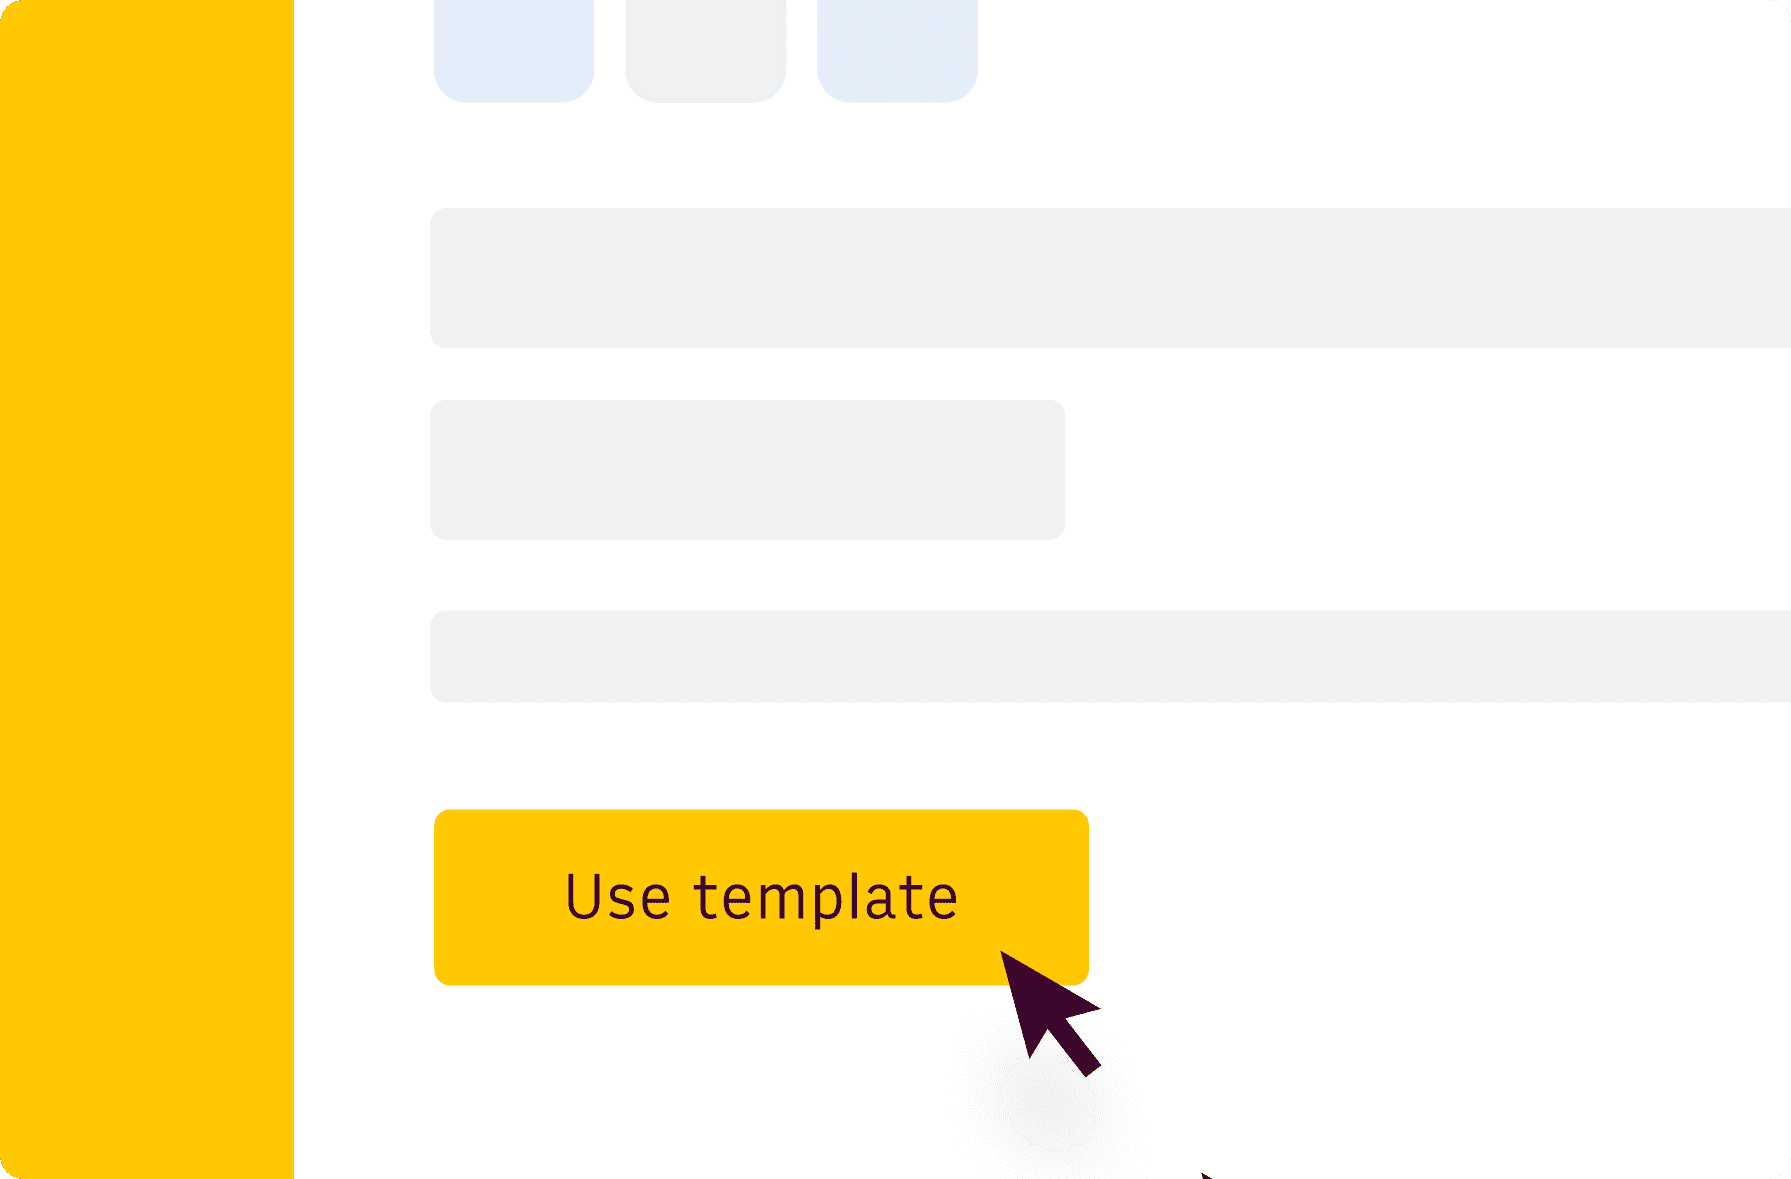
Step 1: On this page, click on "Use Template"
Once done, you'll see a pop-up that shows — “Select spreadsheet destination” — click on “Create a spreadsheet.”
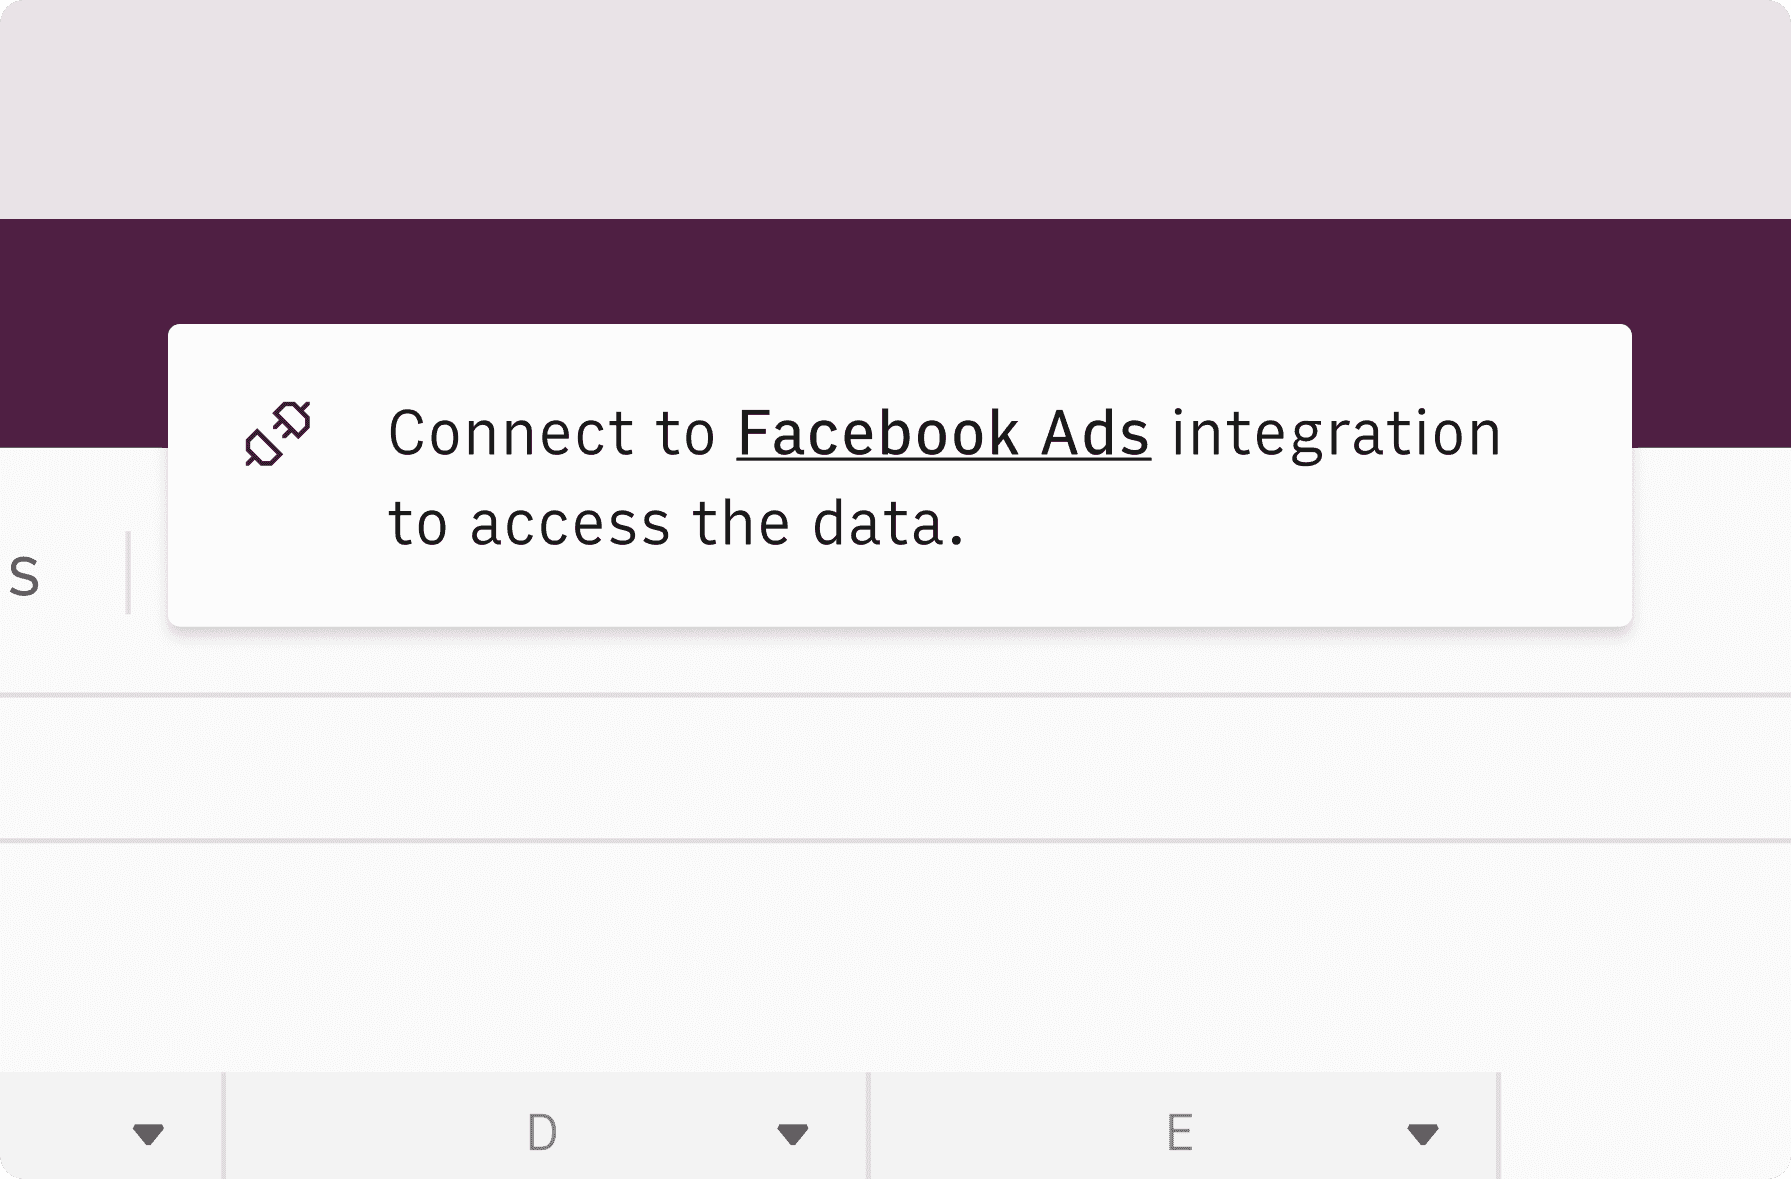
Step 2: Connect Google Analytics 4 and Google Search Console to Rows.
Without connecting your accounts, you'll be unable to access insights and analytics about your page. You can see search keywords inside Google Analytics if you connect your Analytics and Search Console accounts. You can also see site-specific searches via Google Analytics Search Terms.

Step 3: Pick a date range.
You can observe how your keyword rankings change over time by specifying a date range. This allows you to identify trends, whether your rankings are improving, declining, or remaining stable.
Step 4: Insert keywords to ignore.
This lets you exclude branded keywords (like your company name) from the report. By filtering out these terms, you can focus on how easily people find your website when searching for solutions you offer, rather than when they're already looking for your brand.
For example, ours is "Rows." and we sell spreadsheet software, when filling this space in our report template, we might ignore keywords like "Rows". This helps us concentrate on how well we rank for searches like "best data aggregation software 2024" which potential new customers are more likely to use.
Step 5: Insert page to check for keywords.
This helps you narrow down the keywords analysis to a single page.

Key components of the template
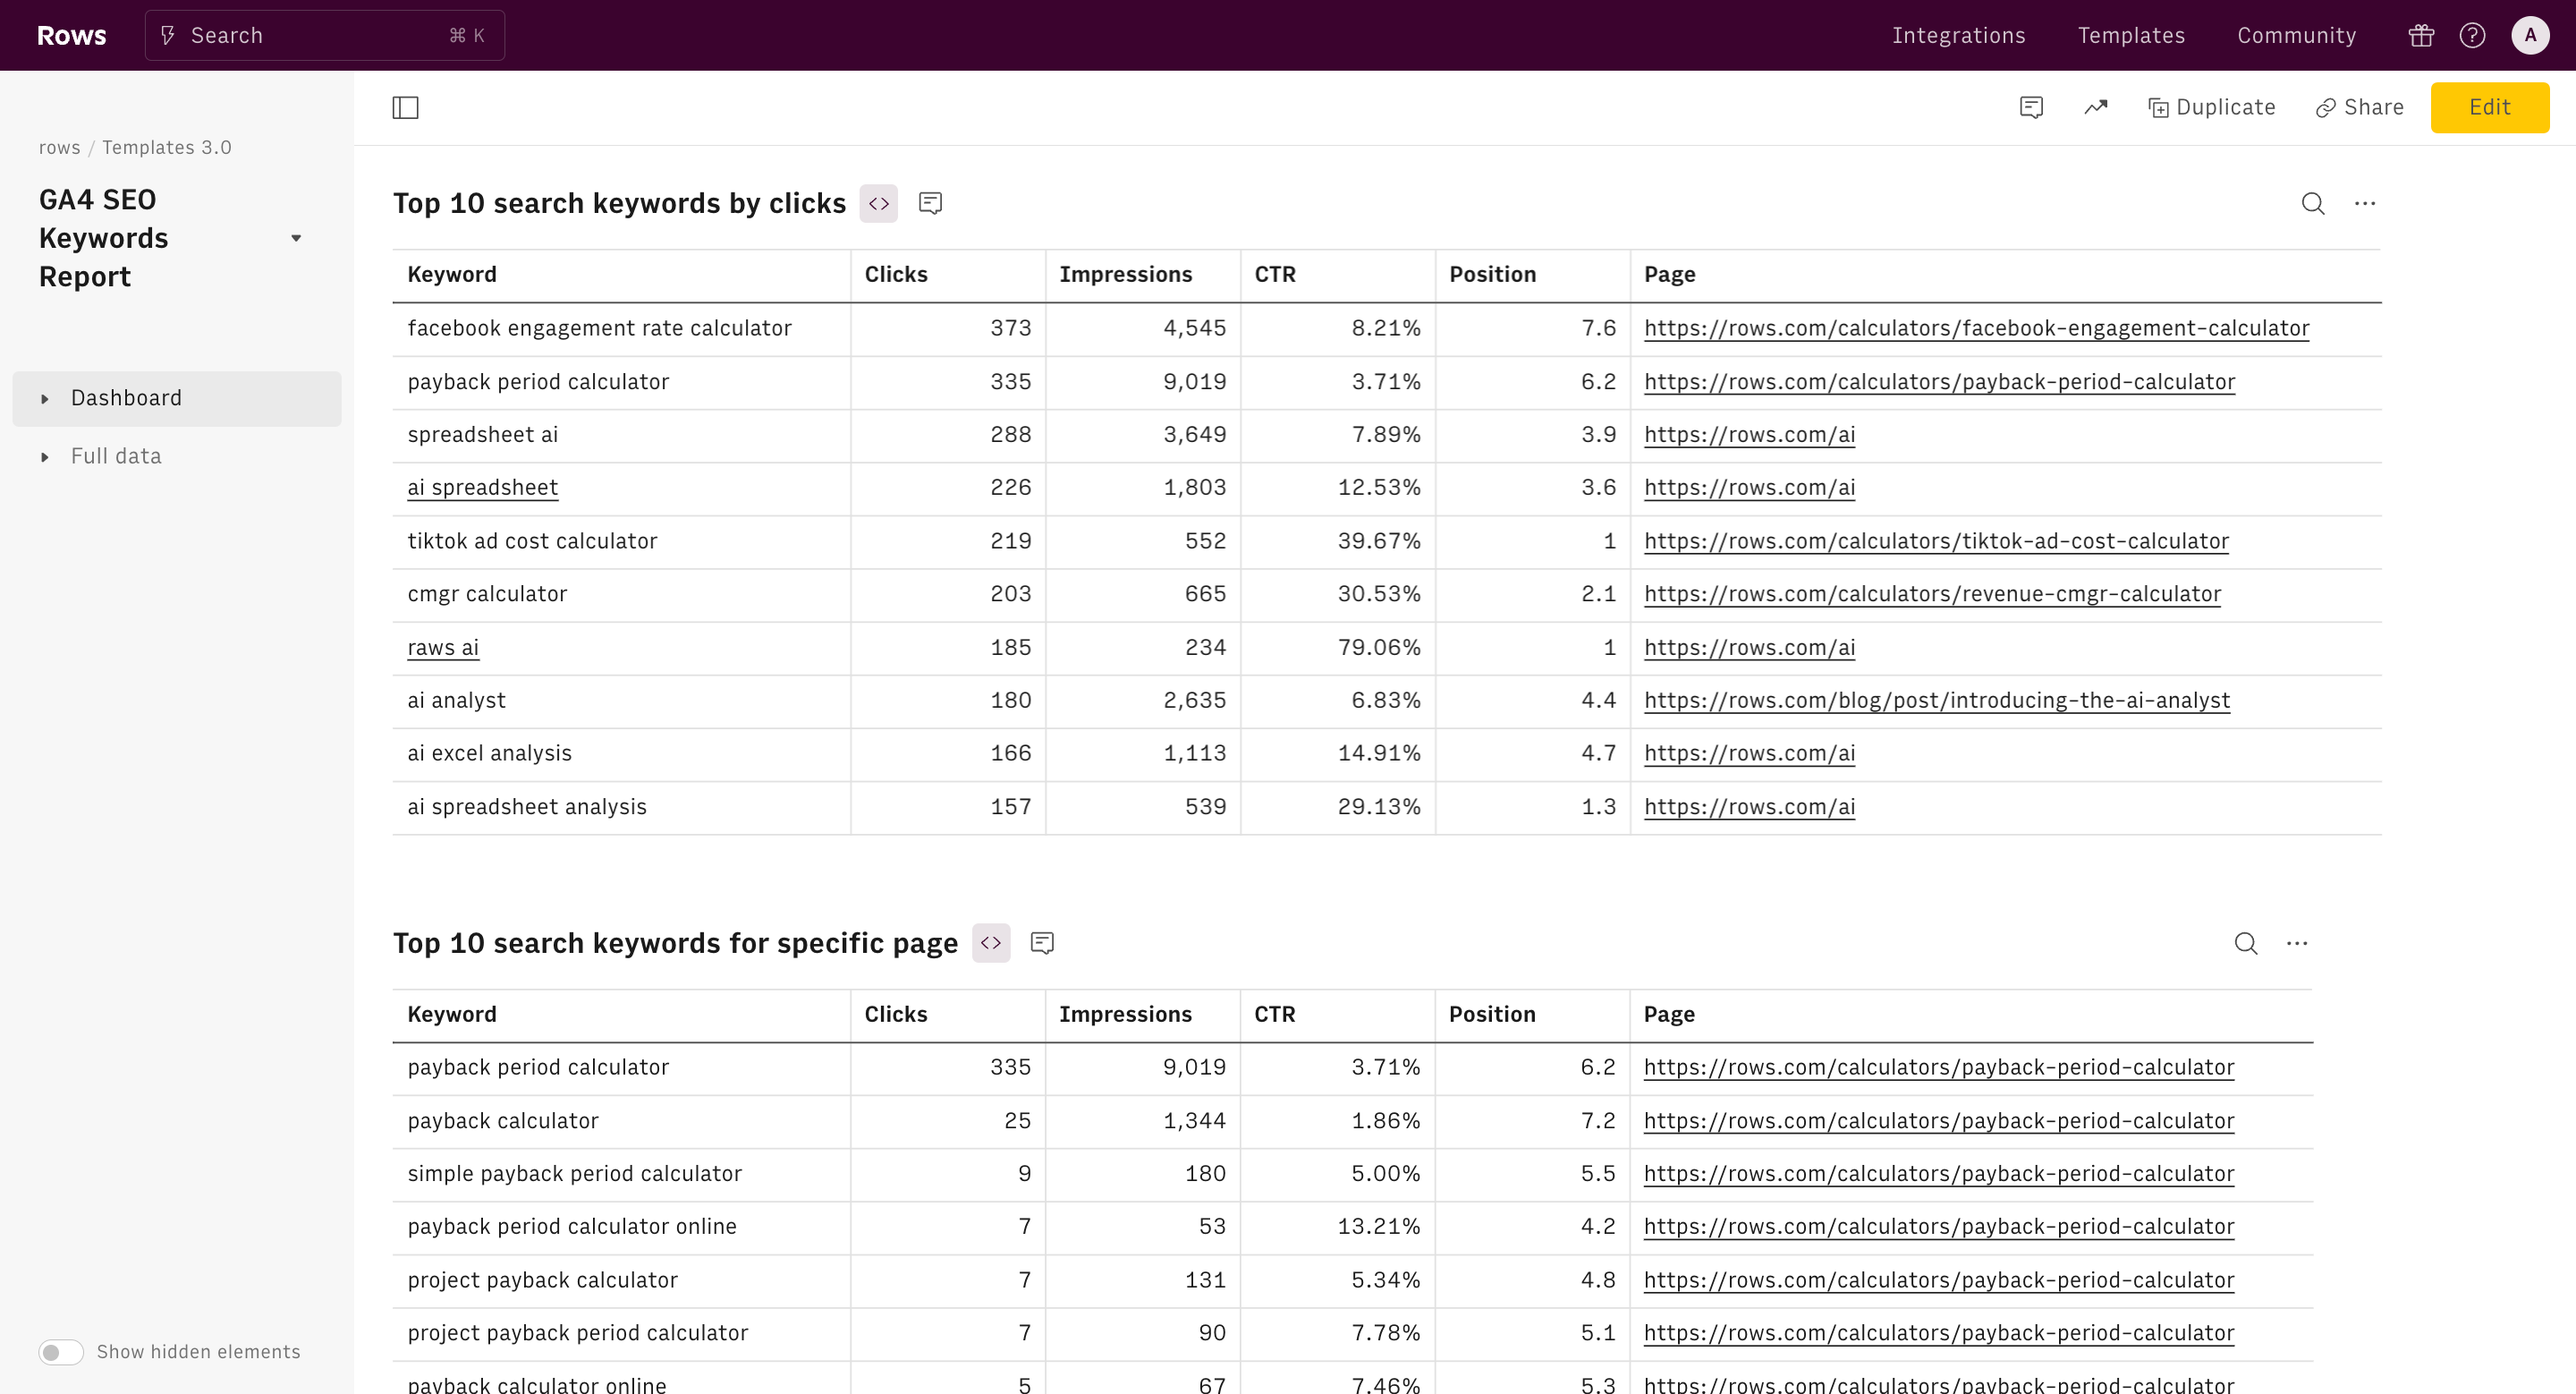
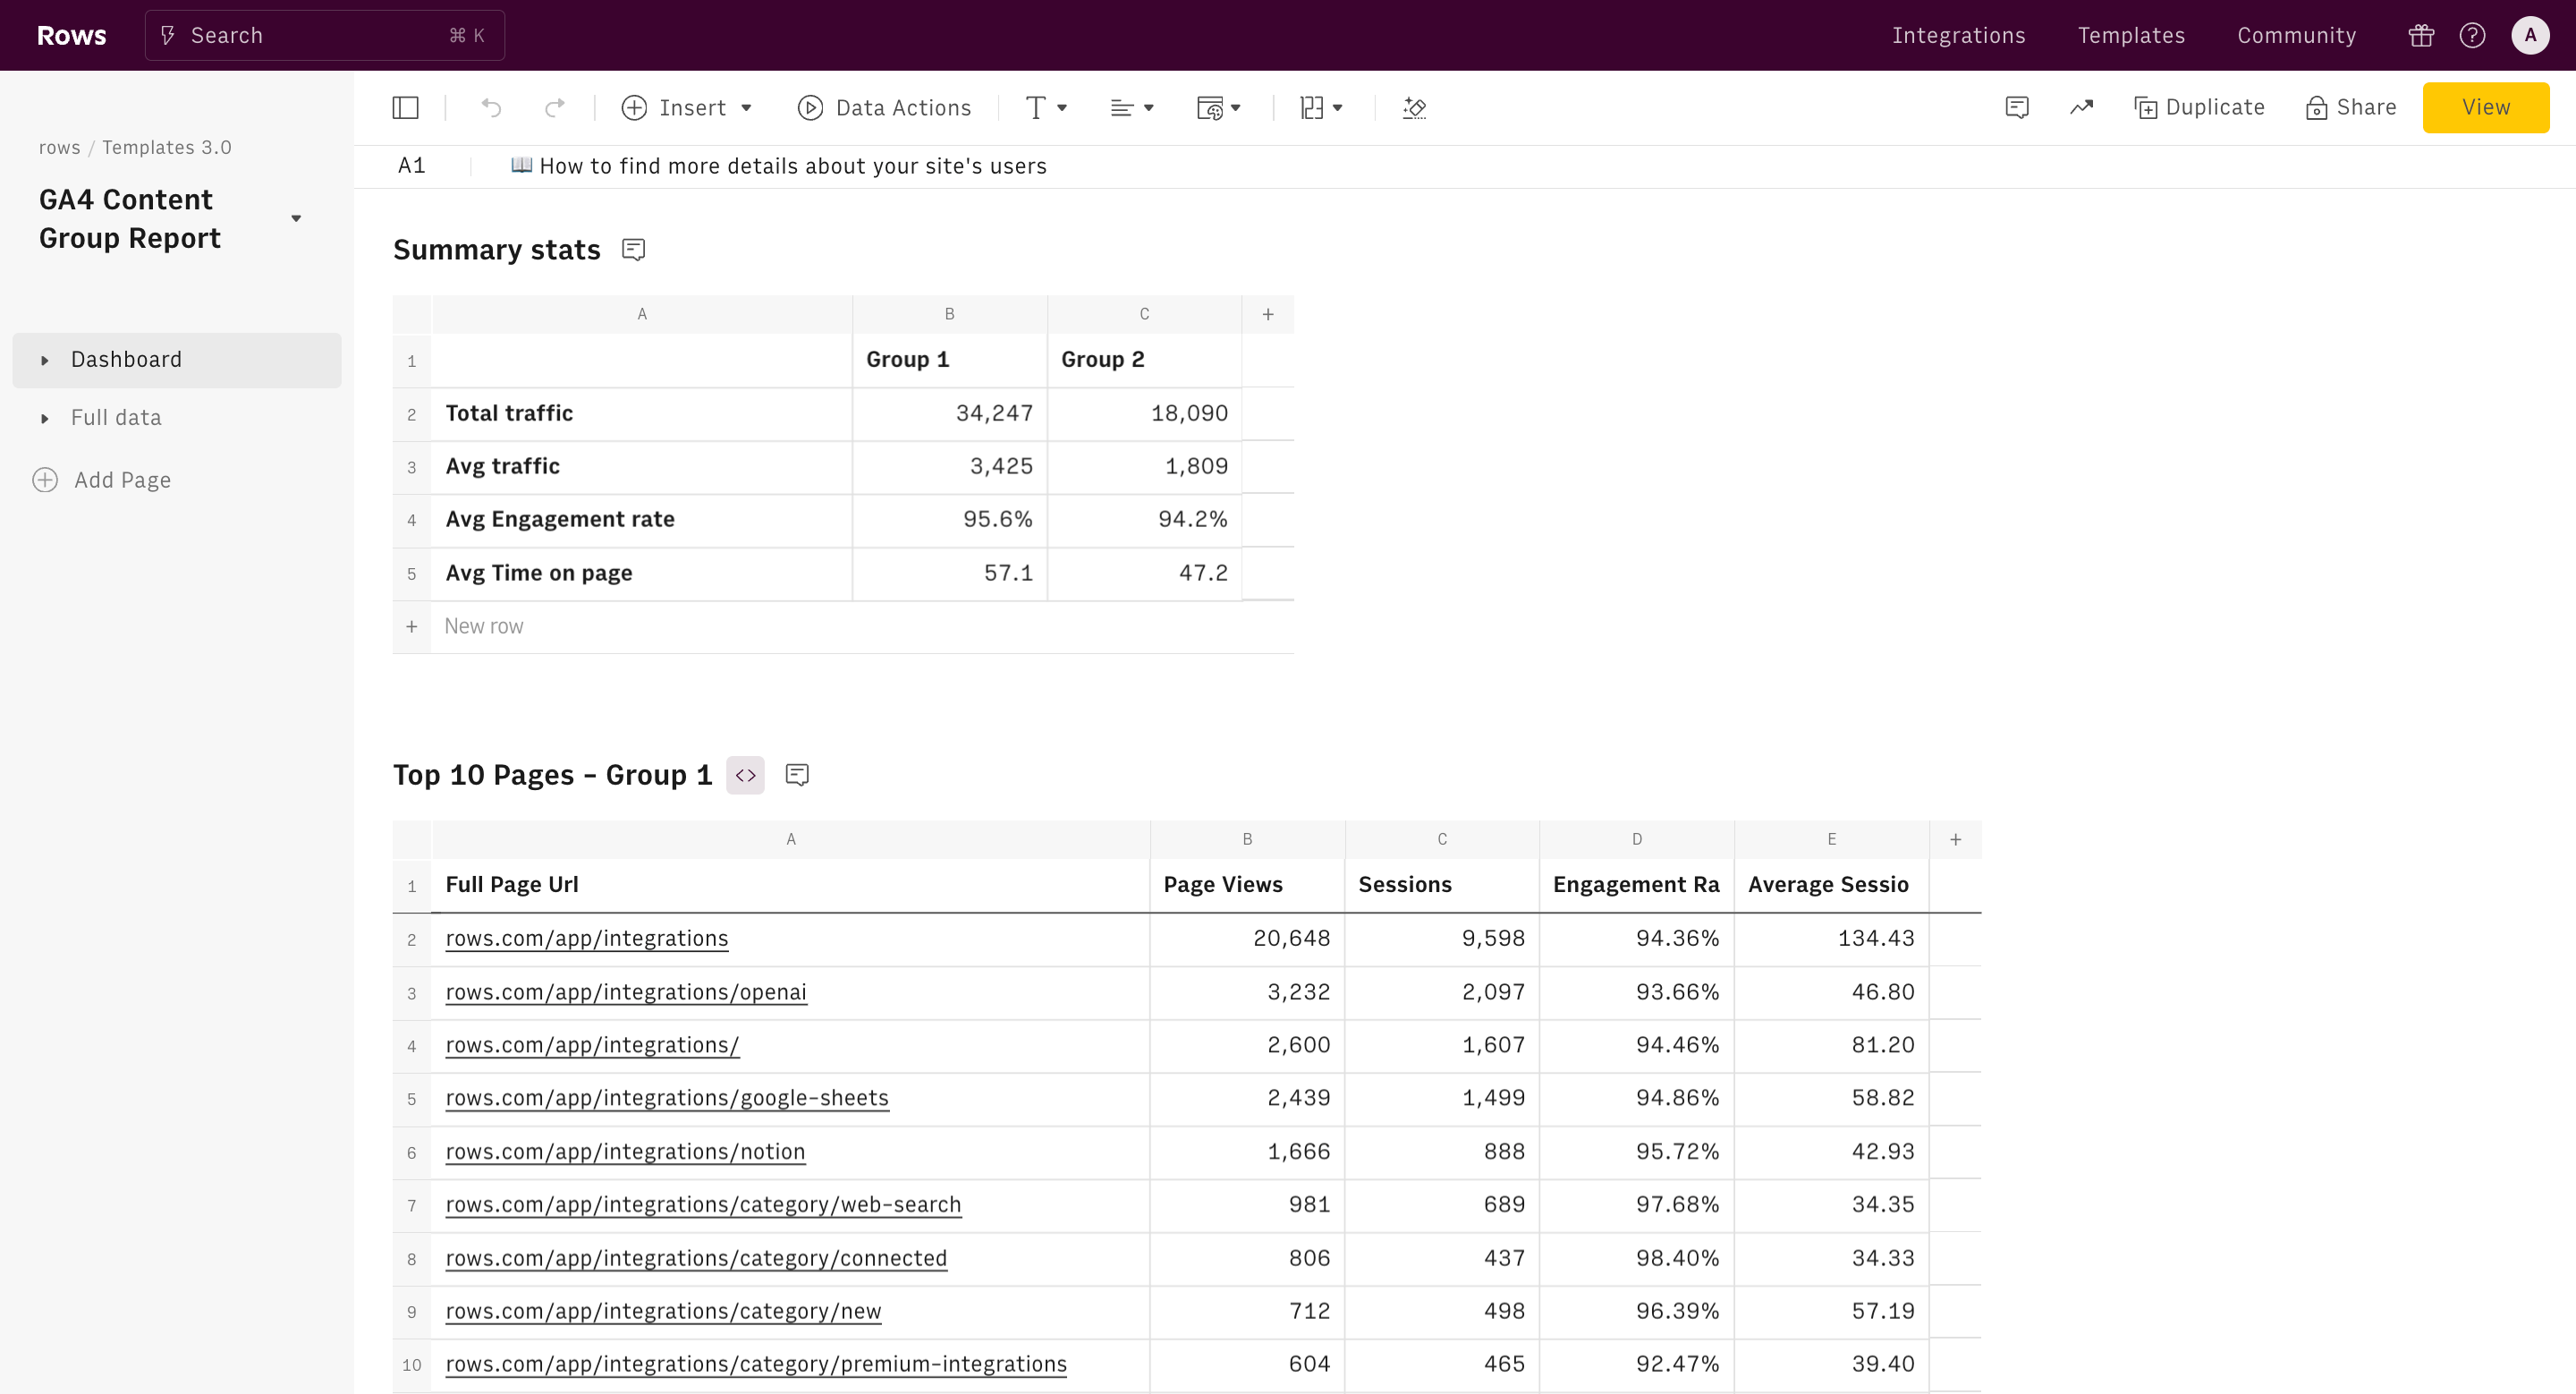
Top 10 search keywords by clicks
Want to know the keywords that are driving the most traffic to your site? Then, look no further than this metrics table on the keyword ranking report template.
This table shows key metrics for the top 10 search keywords by clicks for a website. Its function is to provide an overview of how different search terms are performing in terms of driving traffic and engagement to the site. Let's break down each column:
- Keyword: The search term users are entering.
- Clicks: The number of times users clicked on the website's link in search results for that keyword.
- Impressions: How often did the website appear in search results for that keyword?
- CTR (Click-Through Rate): The percentage of impressions that resulted in clicks. Calculated as (Clicks / Impressions) * 100.
- Position: The website's average position in search results for that keyword.
- Page: The specific page on the website that the search result links to.
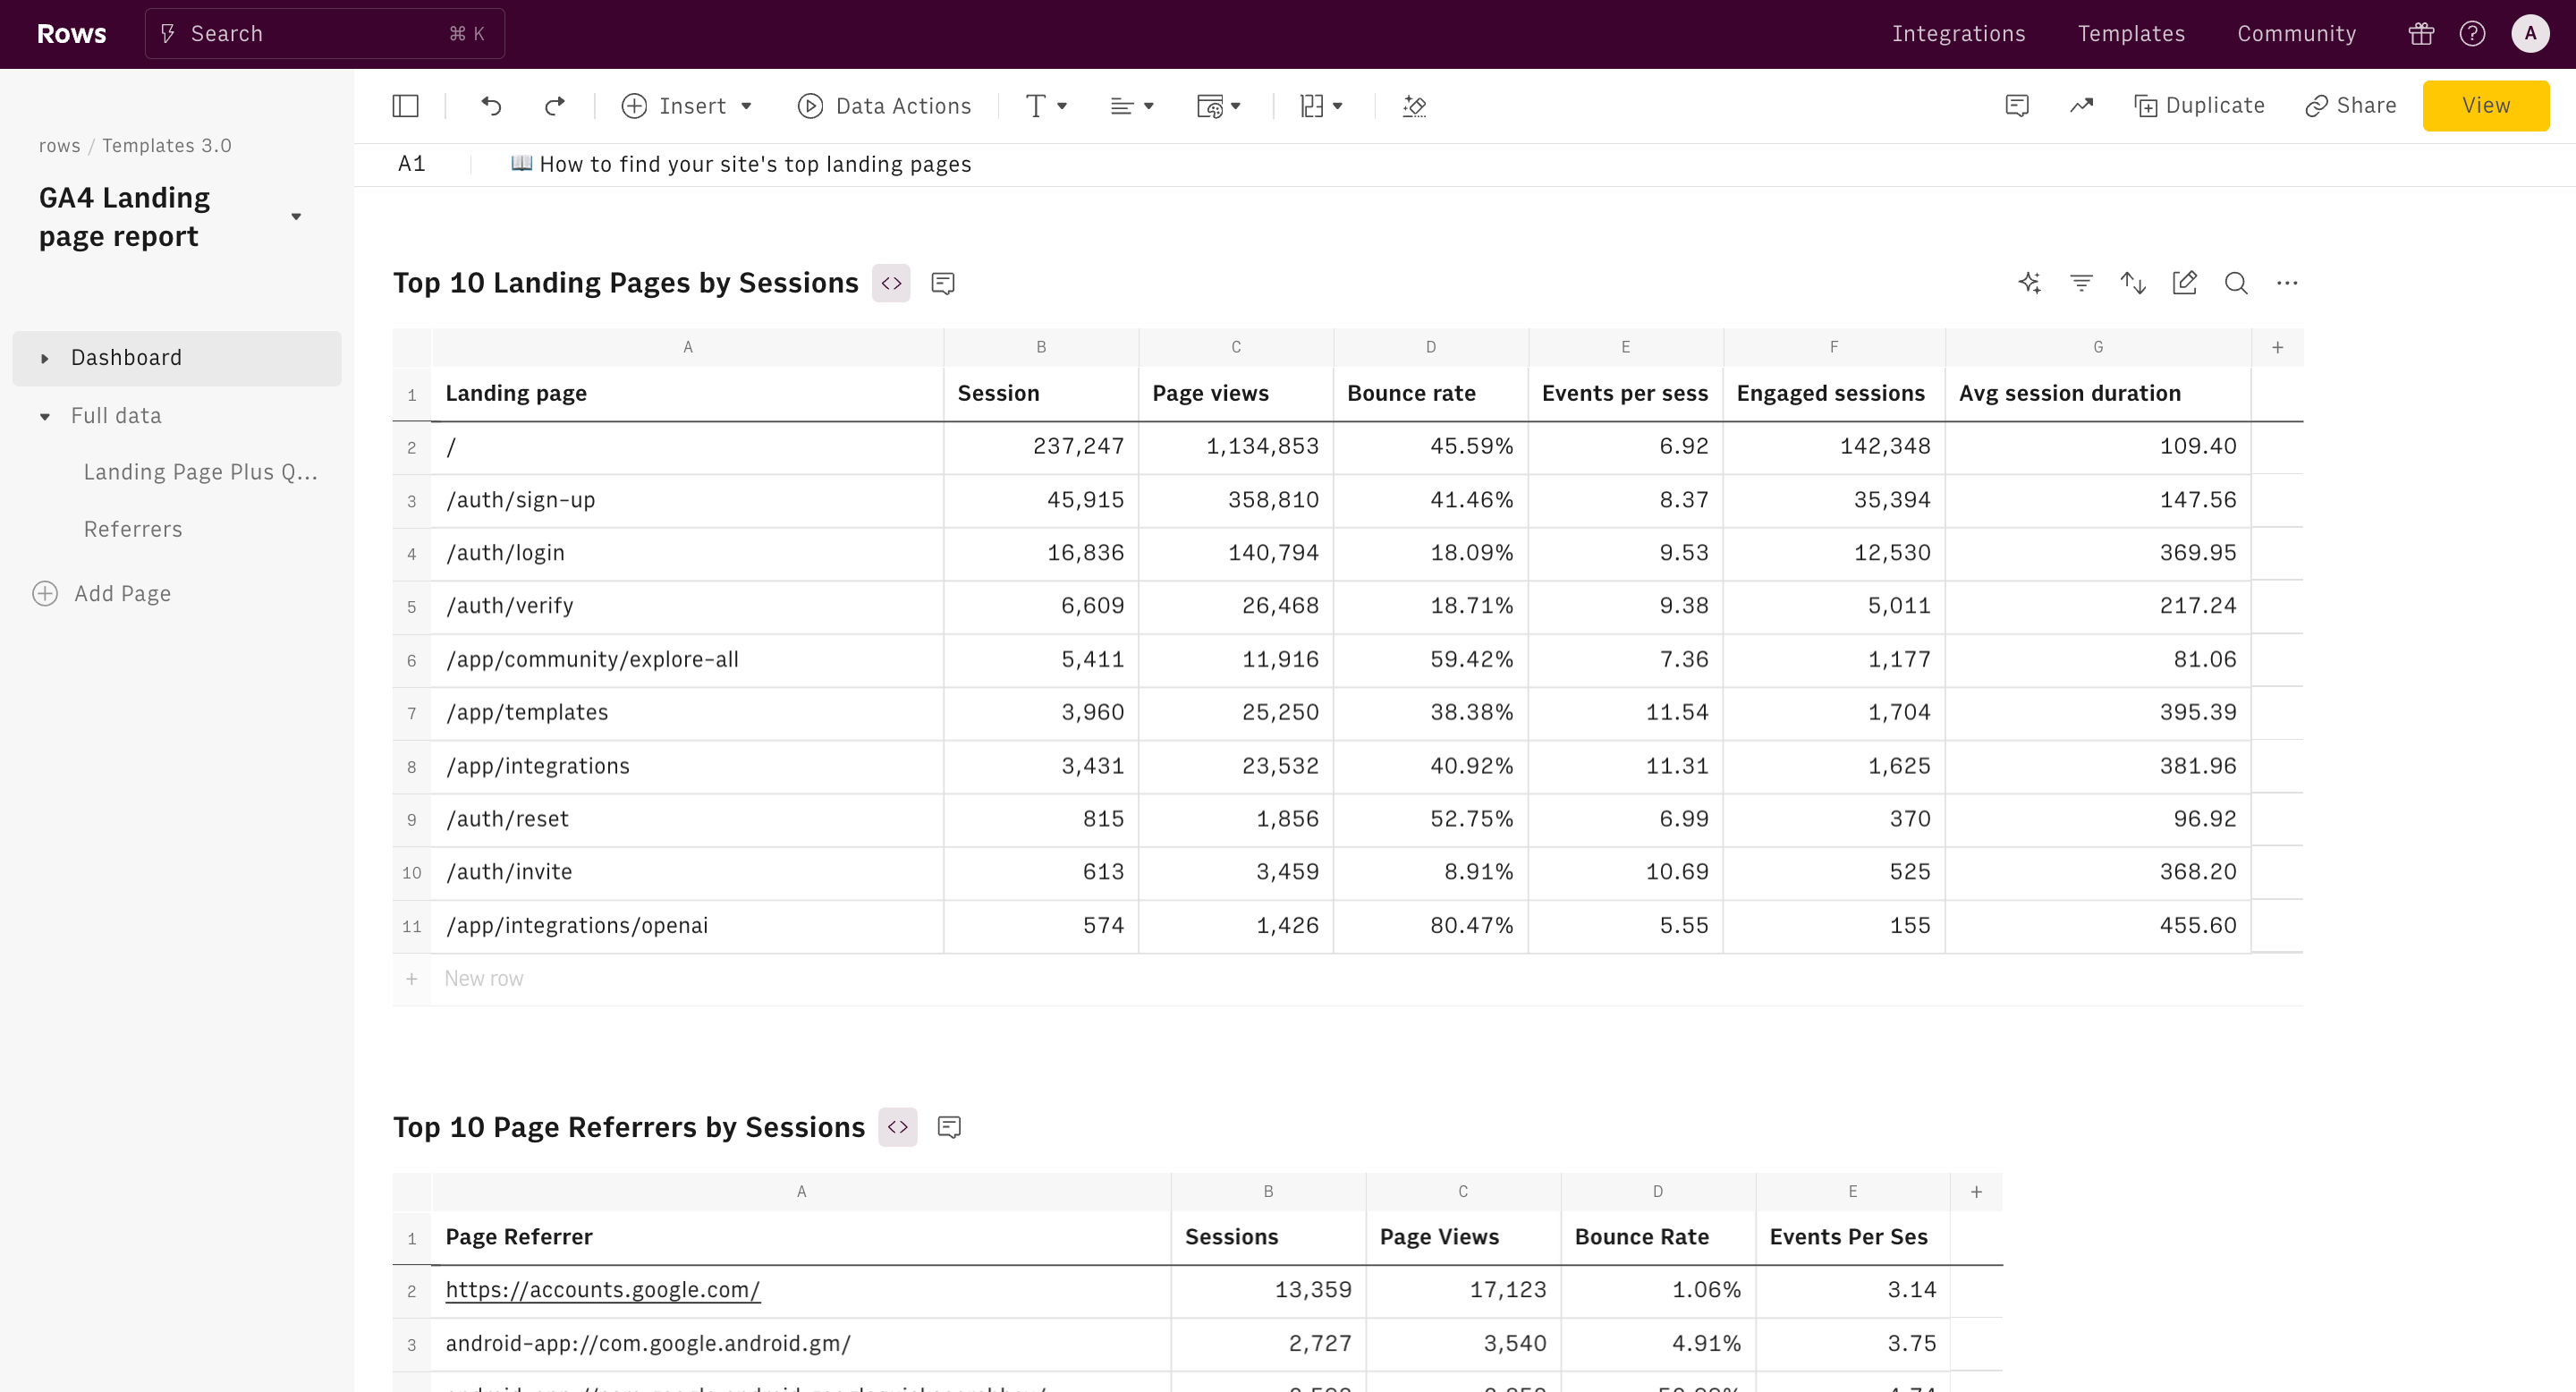
Top 10 search keywords for specific page
This table appears to be empty in the image, but based on its structure, it's designed to show:
Function: To display the performance of search keywords that lead to a specific page on the website.
Columns:
- Keyword: The search term used
- Clicks: Number of clicks the page received from this keyword
- Impressions: How often does the page appear in search results for this keyword
- CTR (Click-Through Rate): The percentage of impressions that resulted in clicks
- Position: The average position of the page in search results for this keyword
- Page: The specific page URL these metrics apply to
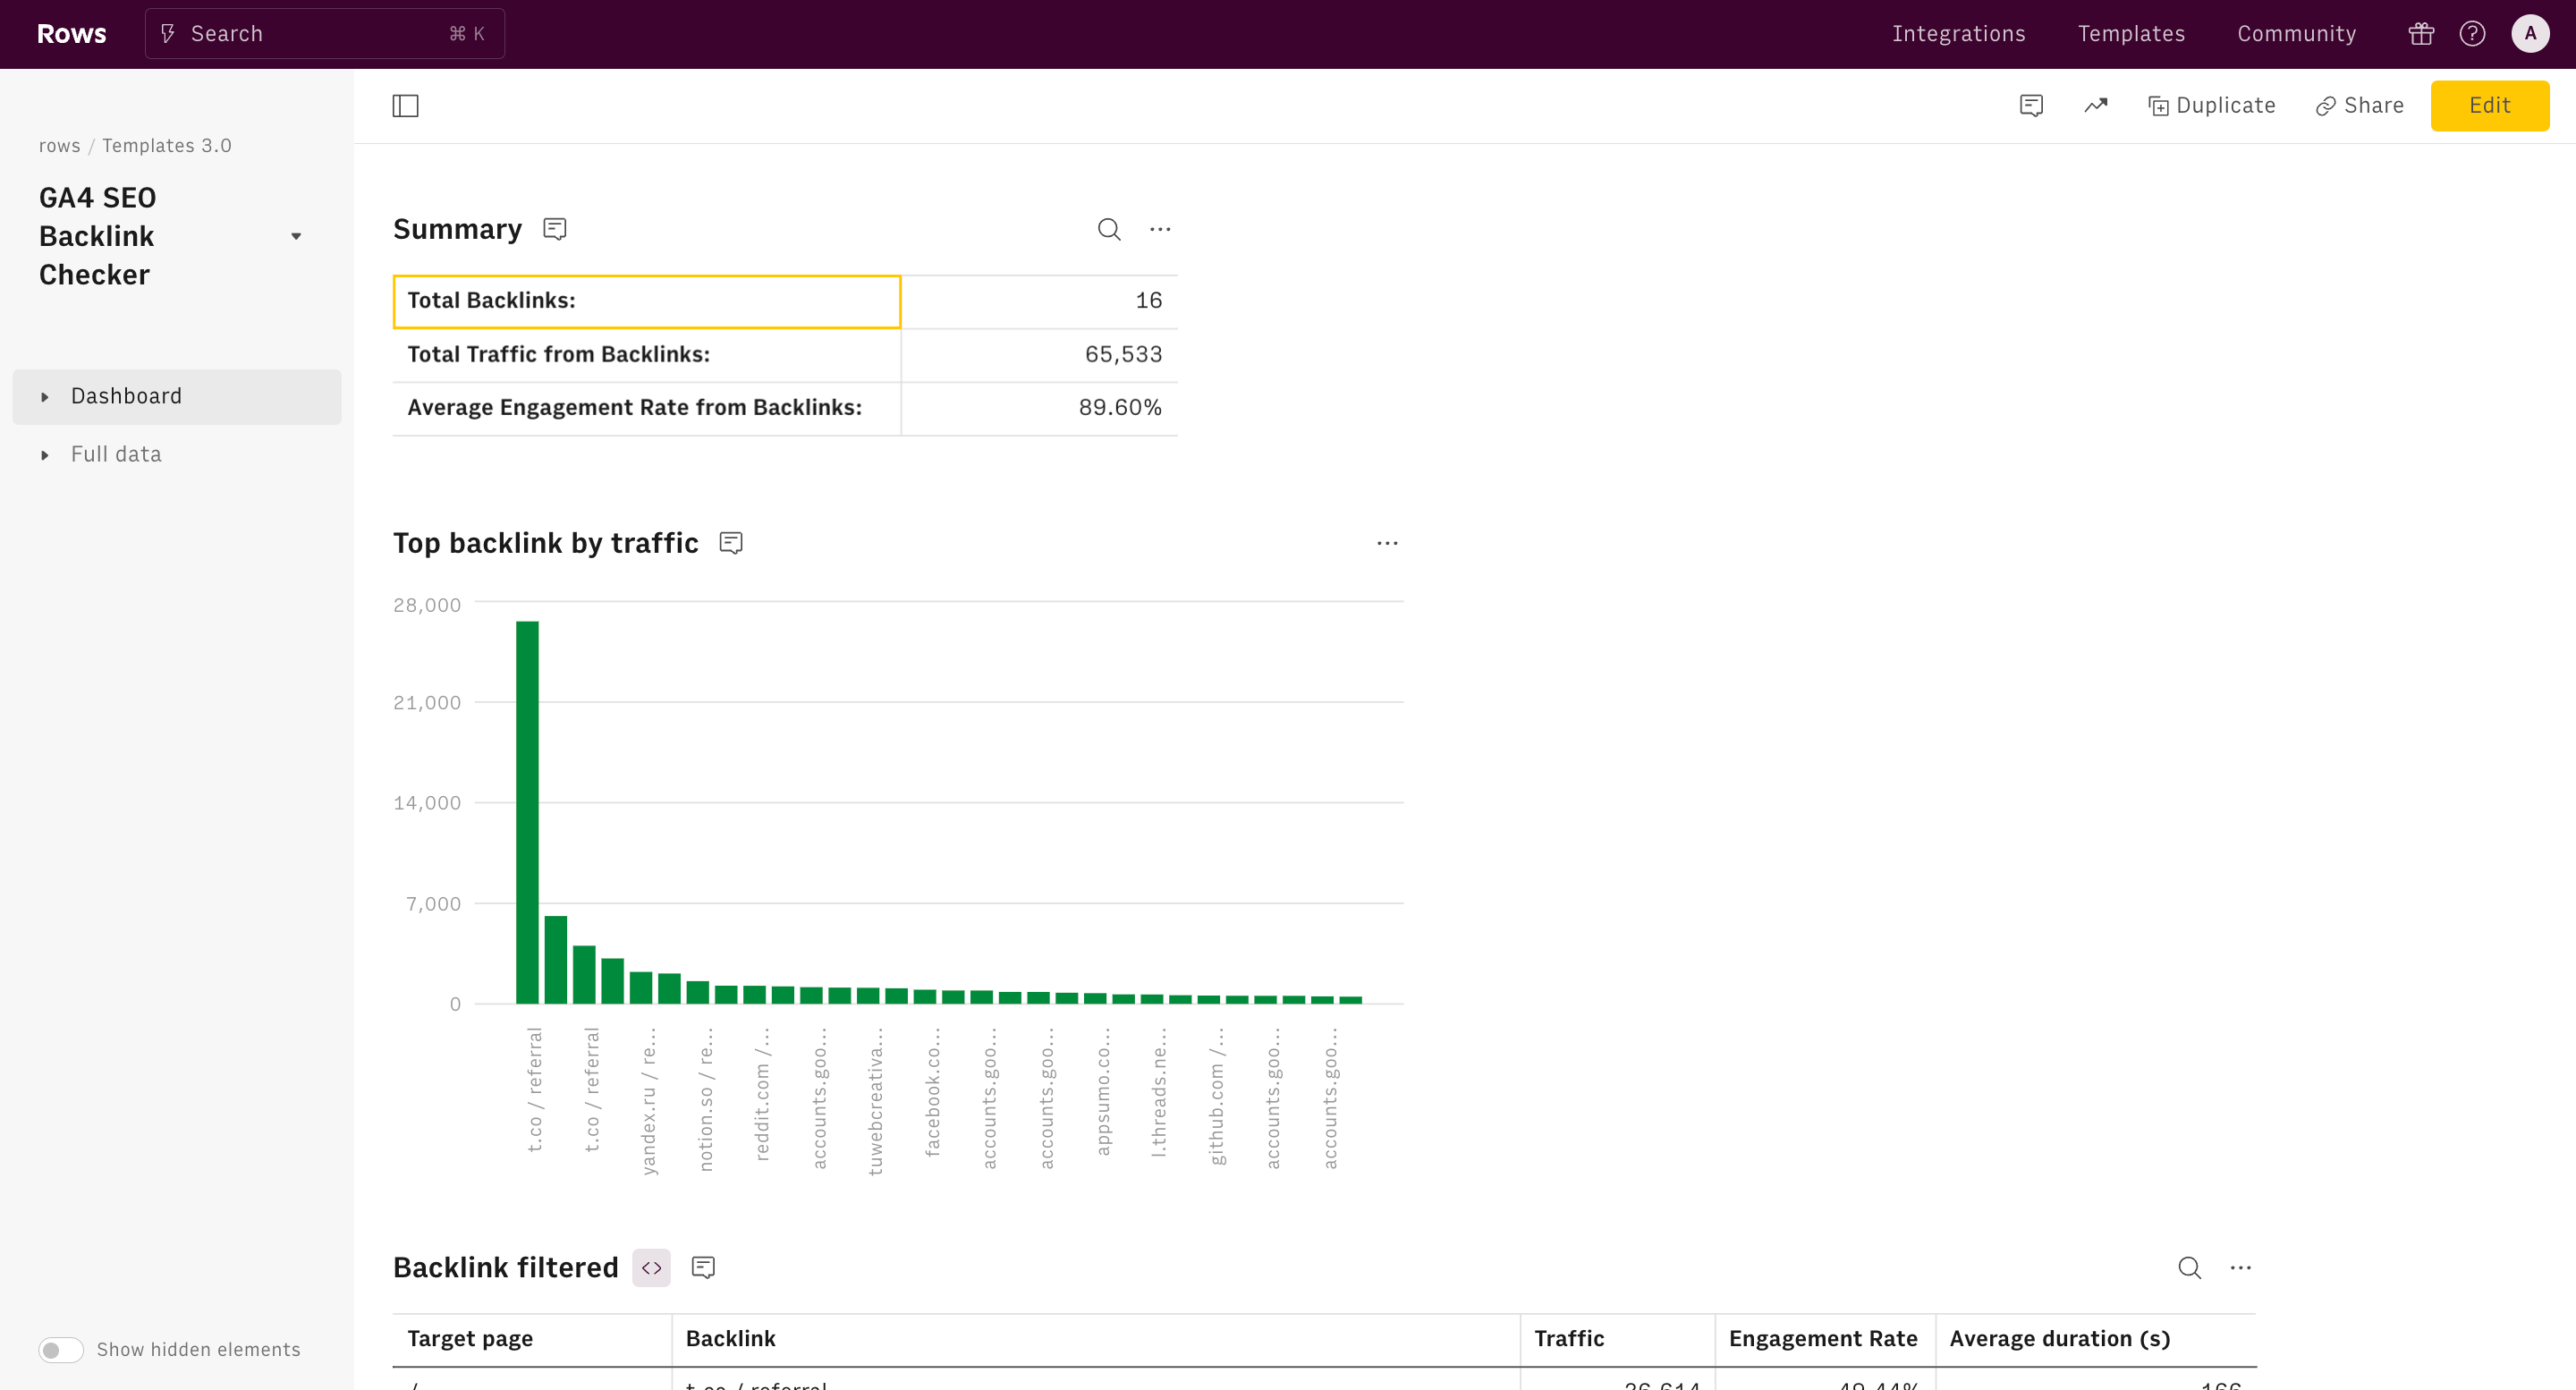
Top 10 on-site search queries
This table displays the most common search terms used within the website's search feature.
- Query: The search term used on the website.
- Searches: The number of times this term was searched on the site.
What are the benefits of using this keyword ranking report template?
1. It helps you identify high-performing keywords
The "Top 10 search keywords by clicks" table in the template helps businesses focus on the keywords that are driving the most traffic. This helps you discover relevant, customer-related keywords to jump up search engine results on high-converting or high-traffic keywords.
2. It helps you optimize specific pages with high-performance
If you are looking to spot high-value keywords opportunities in specific pages, then look no further than this template. With it, you can understand which keywords are most relevant for each individual page.
3. It helps you improve your SEO content by matching user intent
Google is big on relevance and search intent. By analyzing top on-site search queries, you can tailor your content or product offerings to match the exact needs of their visitors, which can boost conversion rates.
The on-site search queries table provides a direct insight into what users are looking for on a website, helping to identify potential content gaps. If visitors are frequently searching for something that isn't covered sufficiently, it signals a strong opportunity to create or optimize content around that top.
How it works
How it works
Get started
Click on 'Use template' and start using it right away. No forms, no signup. Your data first.
Connect your accounts
Once landed on the spreadsheet, follow the instructions to connect the required integrations and pick your accounts.
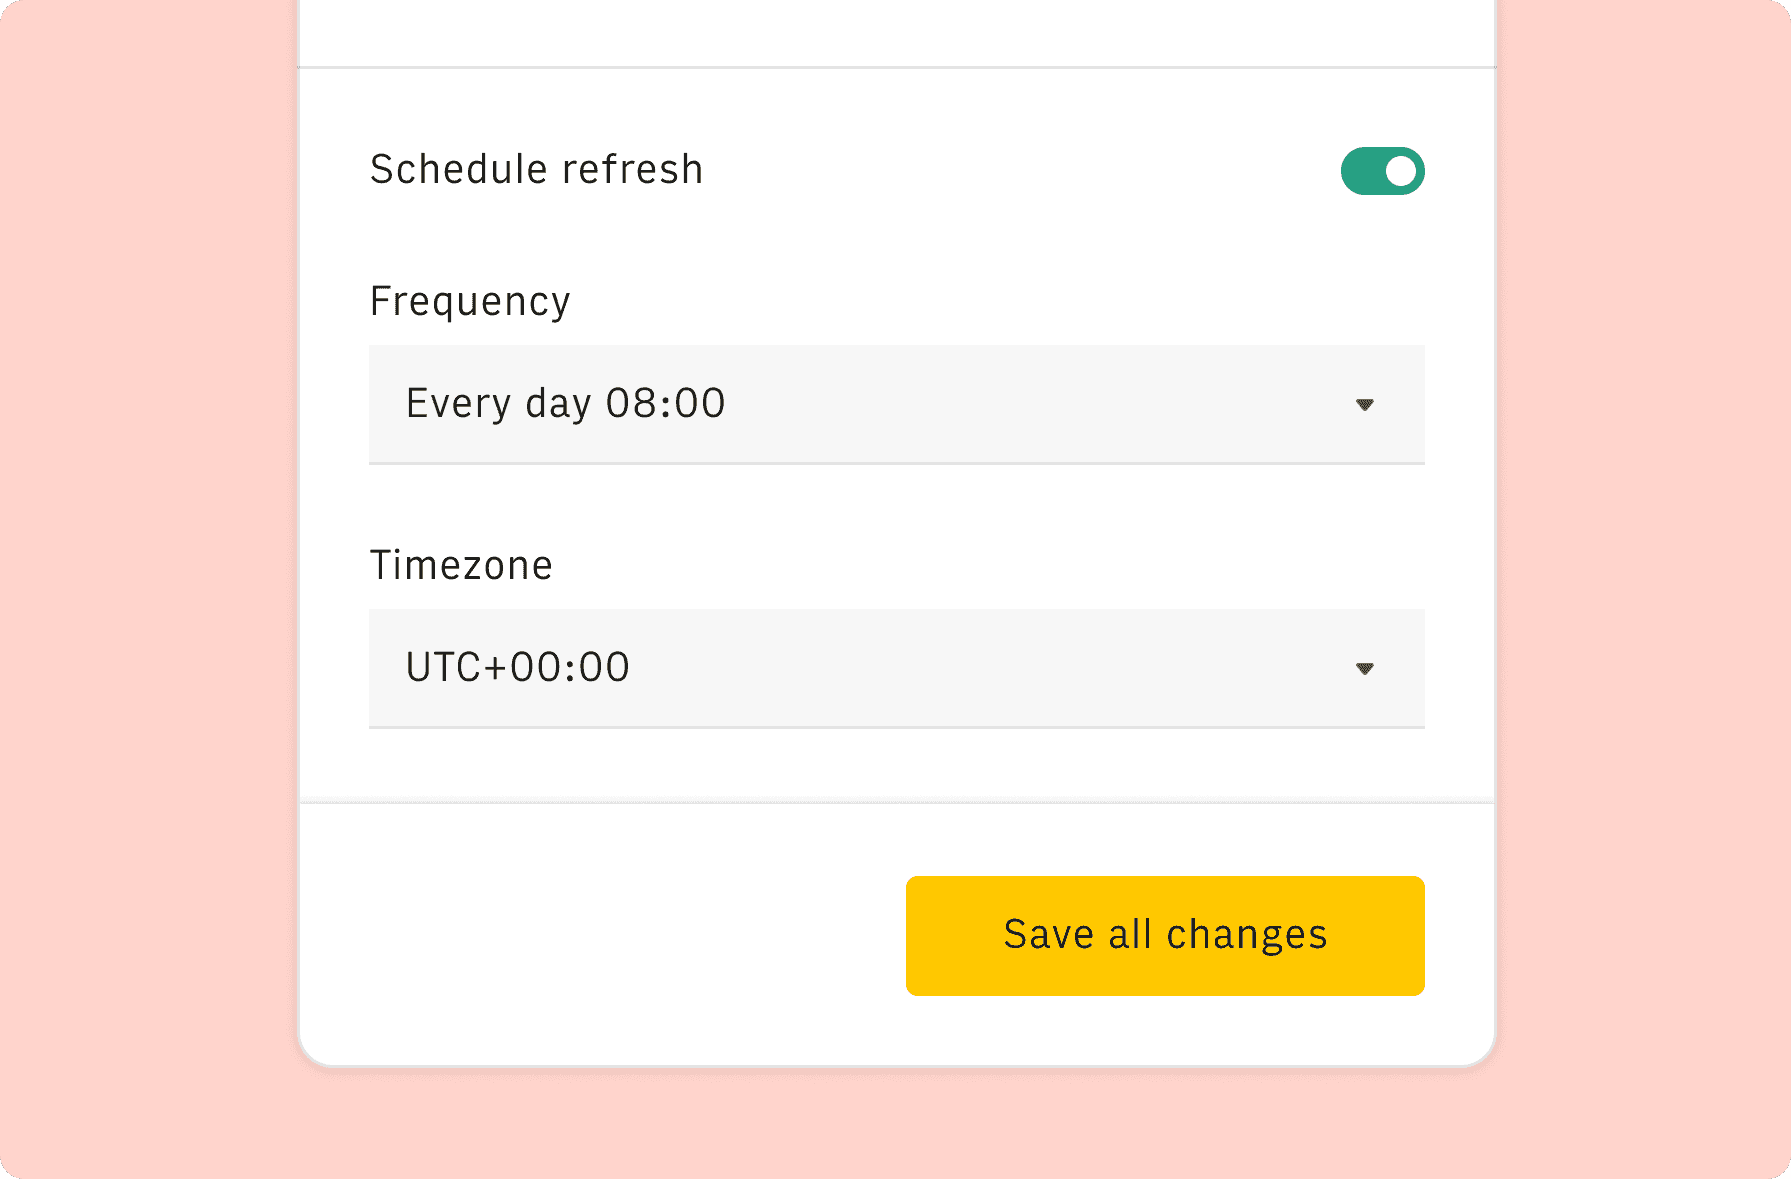
Customize the template and schedule refresh
Once all the integrations have been connected, all tables will update automatically with your own data. Click on 'Edit Source' to change the retrieved data and automate the data refresh. You can then insert a chart or a pivot table, add a column or personalize formats, using all the regular functions and shortcuts that make spreadsheets great.
Embed tables and charts
Click on the option menu to embed tables and chart on your Notion, Confluence or any other iframe-ready documents.


Questions and answers
Can I use Rows for free?
More than a Keyword Ranking Report Template
Rows is your new AI Data Analyst. It lets you extract from PDFs, import your business data, and analyze it using plain language.
Signup for free

Import your business data
Extract from PDFs and images, import from files, marketing tools, databases, APIs, and other 3rd-party connectors.
Know moreAnalyze it with AI
Ask AI✨ any question about your dataset - from VLOOKUPs to forecasting models - and surface key insights, trends, and patterns.
Know moreCollaborate and Share
Seamlessly collaborate and share stunning reports with dynamic charts, embed options, and easy export features.
Know more