16-Feb-2026 Update
Improvements 💪
- The first table on a new spreadsheet now comes with 100 rows by default so you have more room to work right away.
9-Feb-2026 Update
New Features 🤩
- You can now insert and preview a pdf/image file in a cell.
- Cells now support vertical alignment.
Improvements 💪
- We added the option to Merge Cell in any cell contextual menu.
- We Simplified the sum-up experience by moving it into the formula bar, reducing UI clutter and making calculations easier to access
Bugs 🐛
- We fixed an issue that prevented formulas to be preserved in merged cells.
- Some users discovered several issues with conditional formatting, where rules using the date picker and cell references behaved incorrectly. In some cases, also the preview of applied rules would sometimes disappear. Now they have been fixed.
- We fixed an issue where COUNTIF could return incorrect results when certain conditions were applied.
- We resolved generic errors that occurred for some users when setting up Comparisons in Data Tables.
2-Feb-2026 Update
New Features 🤩
- You can now select two or more cells and merge them together, either horizontally, vertically or into a single cell, making it easier to organize your data exactly how you want.
Improvements 💪
- We added a dedicated option to remove the background fill from any cell. Check it under the 'Edit cells' menu.
- Guest users can now download tables without needing to log in—nice and easy!
Bugs 🐛
- We fixed a quirky scroll issue that sometimes made a selected table cell bounce back.
- Pressing a single quote no longer kicks a cell out of AI mode—your cell stays right where you left it.
- Double-clicking a text block now expands it properly, just like it should.
23-Jan-2026 Update
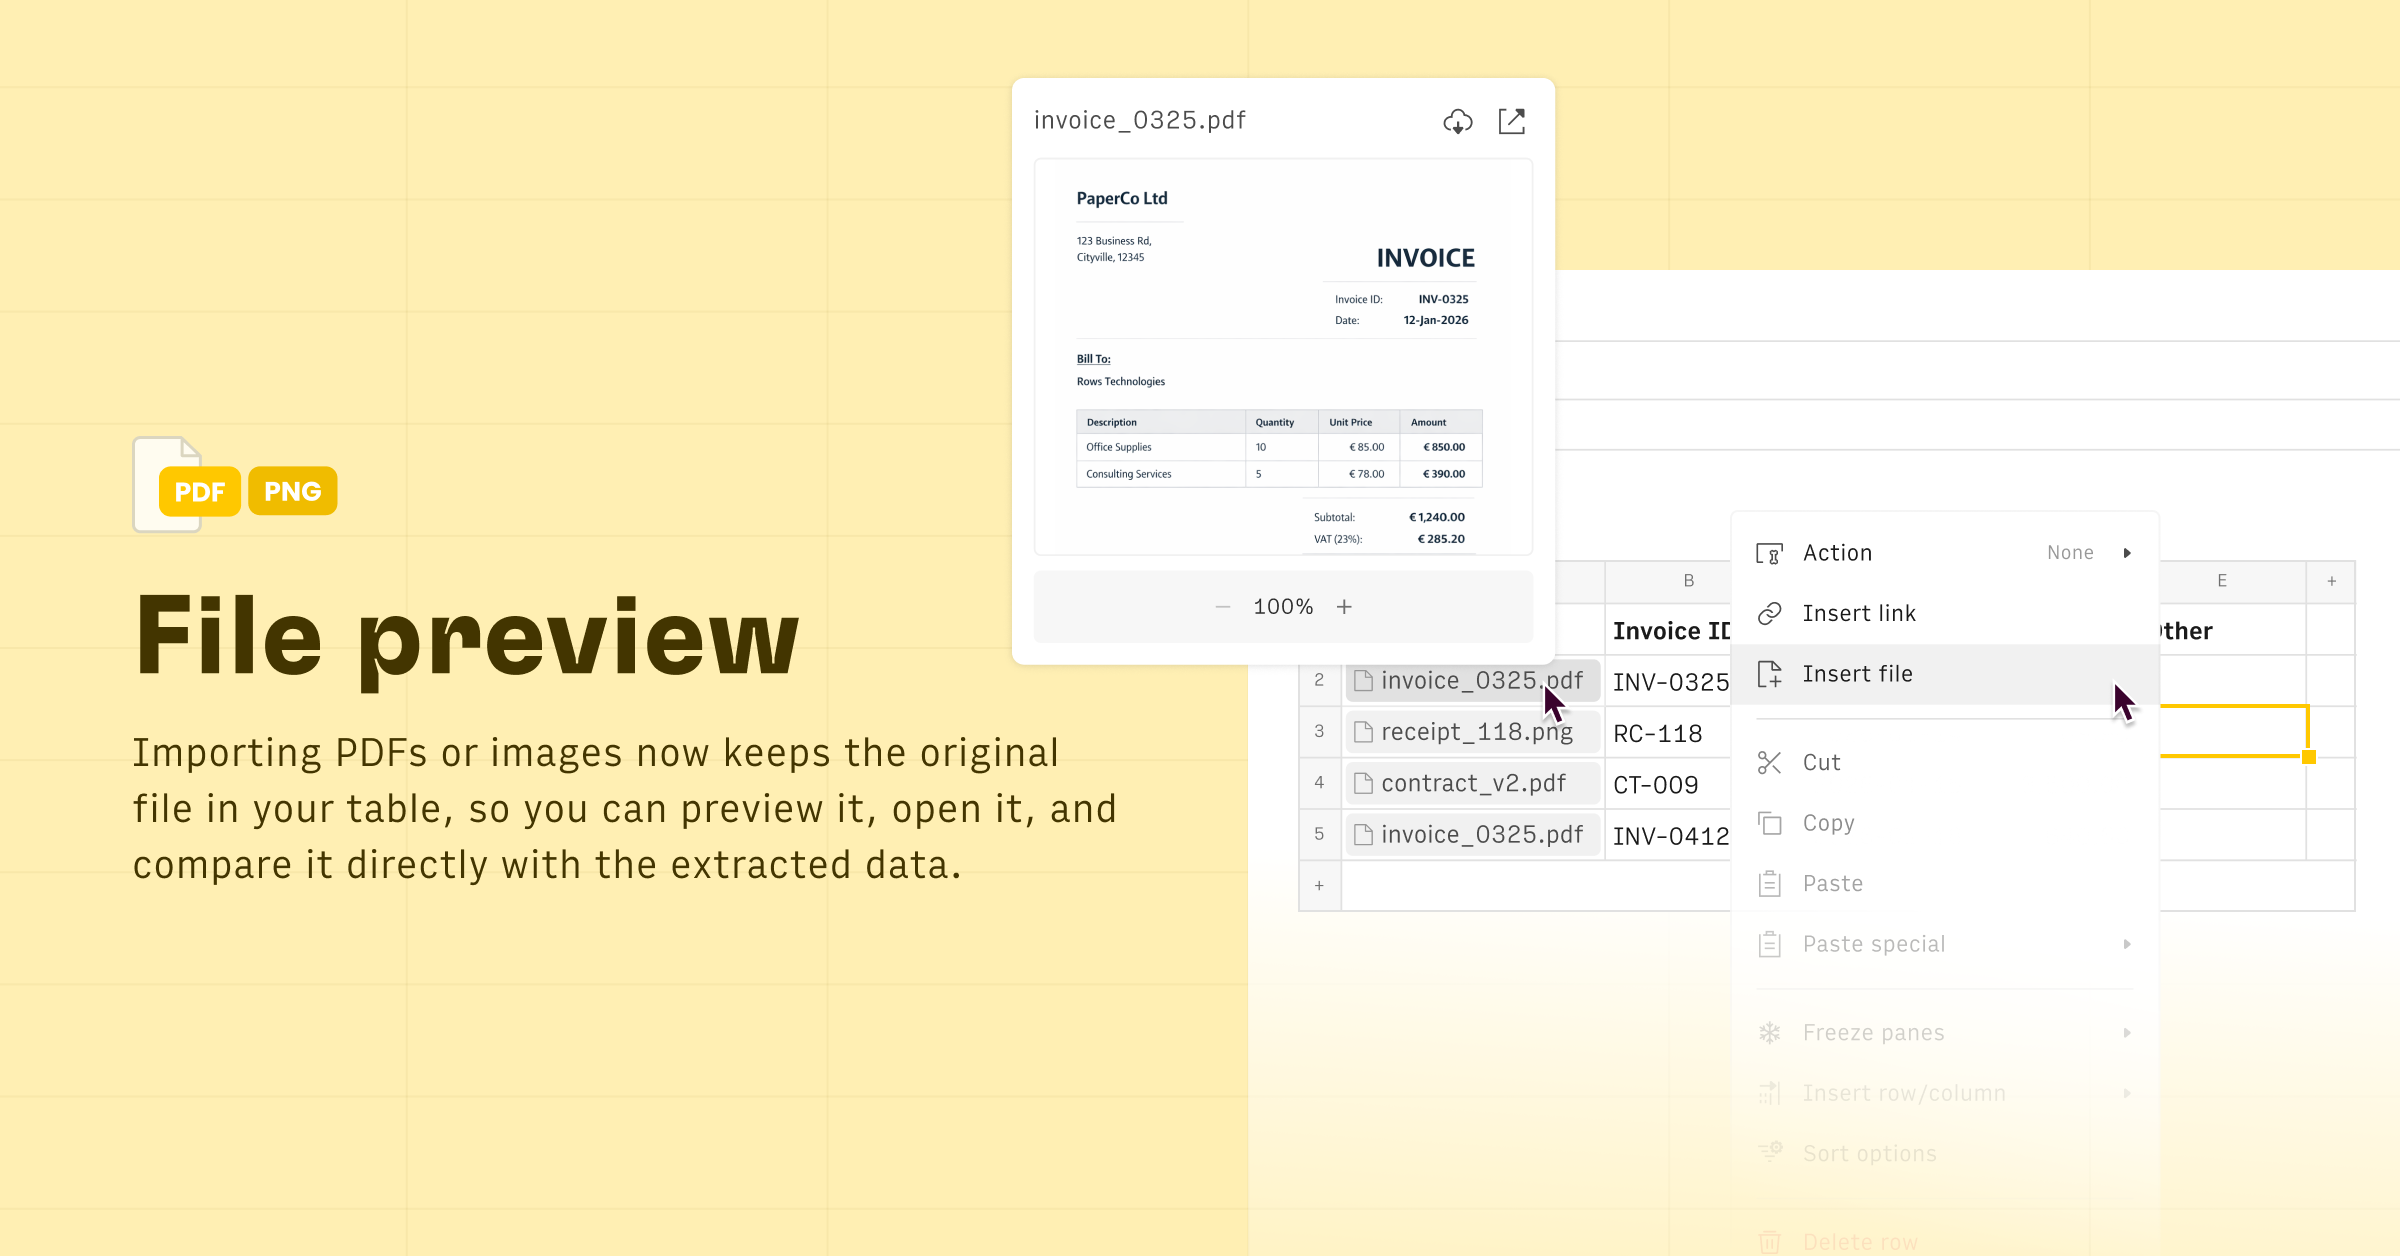
File preview 👁️
When you import a PDF or image, the original file is now stored directly in your table. This lets you preview or open it and easily compare it side-by-side with the extracted data, so you can verify accuracy without switching contexts.
19-Jan-2026 Update
New Features 🤩
- You can now apply Color Scales 🌈 in your conditional formatting rules, automatically shading cells based on their relative values (for example, from low to high).
Improvements 💪
- Charts now have a setting to react to source table filters. This lets you choose whether a chart reflects the current filter or always shows the complete data.
16-Jan-2026 AI✨ Update
New Features 🤩
- At the end of every AI thread, you can now give quick feedback with thumbs icons 👍/👎. When negative, you’ll be able to share feedback to help us improve the AI output.
Improvements 💪
- We further simplified the AI Analyst interface, by making contextual actions (copy formula, copy text, go-to) only appear on hover on returned messages.
- Plus, checkpoints are now reachable with a button next to thread thumbs feedback.
09-Jan-2026 AI✨ Update

Introducing the AI Analyst 6.4, now with Web Search 🌐
You can now ask AI to look up data on the web or scrape a URL to create a table in Rows or enrich an existing one.
Try prompts like: "Look up the most funded startups in Germany in 2025" "Scrape the 5 most visited museums from this link: https://en.wikipedia.org/wiki/List_of_most-visited_museums" "Look up the pricing plans of Notion, Coda and Confluence and compare them in table"
05-Jan-2026 Update
Improvements 💪
- When you upload an Excel file, all chart types supported in Rows, along with Pivot Tables, will be automatically imported alongside your data.
- We’ve overhauled View Mode: we simplified the experience, unified most interactions with Edit mode, and made it easier to consume your spreadsheet. You can also use the AI Analyst in both Build and Chat modes if you have edit permissions on that spreadsheet.
- You can now unlink any Data Table from its data source and turn it in a regular table.
2023-2025 Changelog
📖➡️ Open on github.