How to pick your activation metric

This is the second post in our PLG Series, where we write a monthly deep dive on a topic that we experienced while building a Product-Led Growth company at Rows.
Read last month's article on the Do's and don'ts of managing a product waitlist.
It is long known that high user retention is the holy grail of successful tech products. And behind every retained, happy, and active user there’s an activated one. User activation is the moment when a customer experiences a (or set) key milestones in the product that predicts long-term retention in the product.
Borrowing from Lenny’s recent blog post about user activation, it is the % of your users who hit the milestone divided by everyone that completed the sign-up flow:

At Rows we’ve obsessed about our activation metric. Over the past couple of years we’ve iterated on it 4 times, and came out of it with a good sense of what a good, bad, and useful activation metric is.
This post is about that process, where we landed, and why. Our definite guide on how to pick the activation metric for a PLG company.
What makes a good activation metric
 A look into our user activation metric
The first step in picking your activation metric is understanding why it matters. Activation is what happens before someone establishes the habit of using a product. It is the moment in which you can reliably predict the behavior of a customer in the mid-term - typically from a couple of weeks to several months - from the actions they are taking on the product today.
And because “habit” means different things to different products, activation milestones can be very different between products. If you’re Airbnb, it might be the first time a customer does a booking, or leaves a review. But if you’re Spotify - a product where users are expected to engage for longer periods of time - activation can be creating your first playlist, or listening to x minutes of music in your first y days.
Regardless of the product, good activation metrics share the same characteristics:
Aligned with customer value: The metric should be a proxy for the value your customer gets from using the product.
A good predictor of long-term engagement: It should be something that predicts whether a user will continue to use the product in the following weeks and months.
Quantitative: It should be measured in a clear and unambiguous way.
Easy to understand and measure: Everyone in your company should understand what it is, how a user reaches the milestone, and how it is measured. It should be available in your data warehouse or product analytics tool, and be calculated automatically. At Rows, we use a mix of Segment and Google BigQuery to track, compute, and store it.
Bottom line, a good activation metric is something that is valuable to the customer, that predicts whether a user will continue to use the product in the long run, it is easy to measure, and even easier to understand.
How to use the activation metric
Once you have a good activation metric, you can use it in a number of ways:
As a leading indicator: The metric should predict future behavior. This means that if you see a change in the metric, you should expect a change in long-term engagement in the future.
As a target for growth: The metric should be something you can move. As a team, you should be able to increase the activation rate by changing something in the product, going after a different user persona, or revisiting your product positioning.
To assess product-market fit across user segments: The activation metric will vary across your user base. You can use activation rate to segment your users, and look at how different segments behave in the product. This is useful to understand what to do next. You might find that a certain segment of users is not activating (or activating 2x better than average), and you can focus on trying to figure out why, and how to fix it. At Rows we look at user activation broken down by user role and level of spreadsheet skill to assess product-market fit across segments of users.
To build cohorts: At Rows, once a user crosses the activation threshold, they are attributed to a cohort based on the week/month when it happened. This is the base to construct our user cohorts, and measure user retention. That’s how we know that 60% of people come back to the product the week after they reached the activation milestone.
Note: Don’t use the activation metric as a benchmark with other products. The definition of activation varies too much across products, even in the same industry. So unless you know exactly how other companies compute their activation rate, comparing them will be meaningless, and might misguide you from doing what actually matters - focusing on building a better product, converting customers better, and growing the business.
Picking an activation metric at Rows
 The 4 phases in our activation rate
When we started working on Rows, we didn’t have a clear idea of what our activation metric was going to be. We knew it was going to be related to the use of the spreadsheet but exactly what. It took 4 phases to get us where we are now:
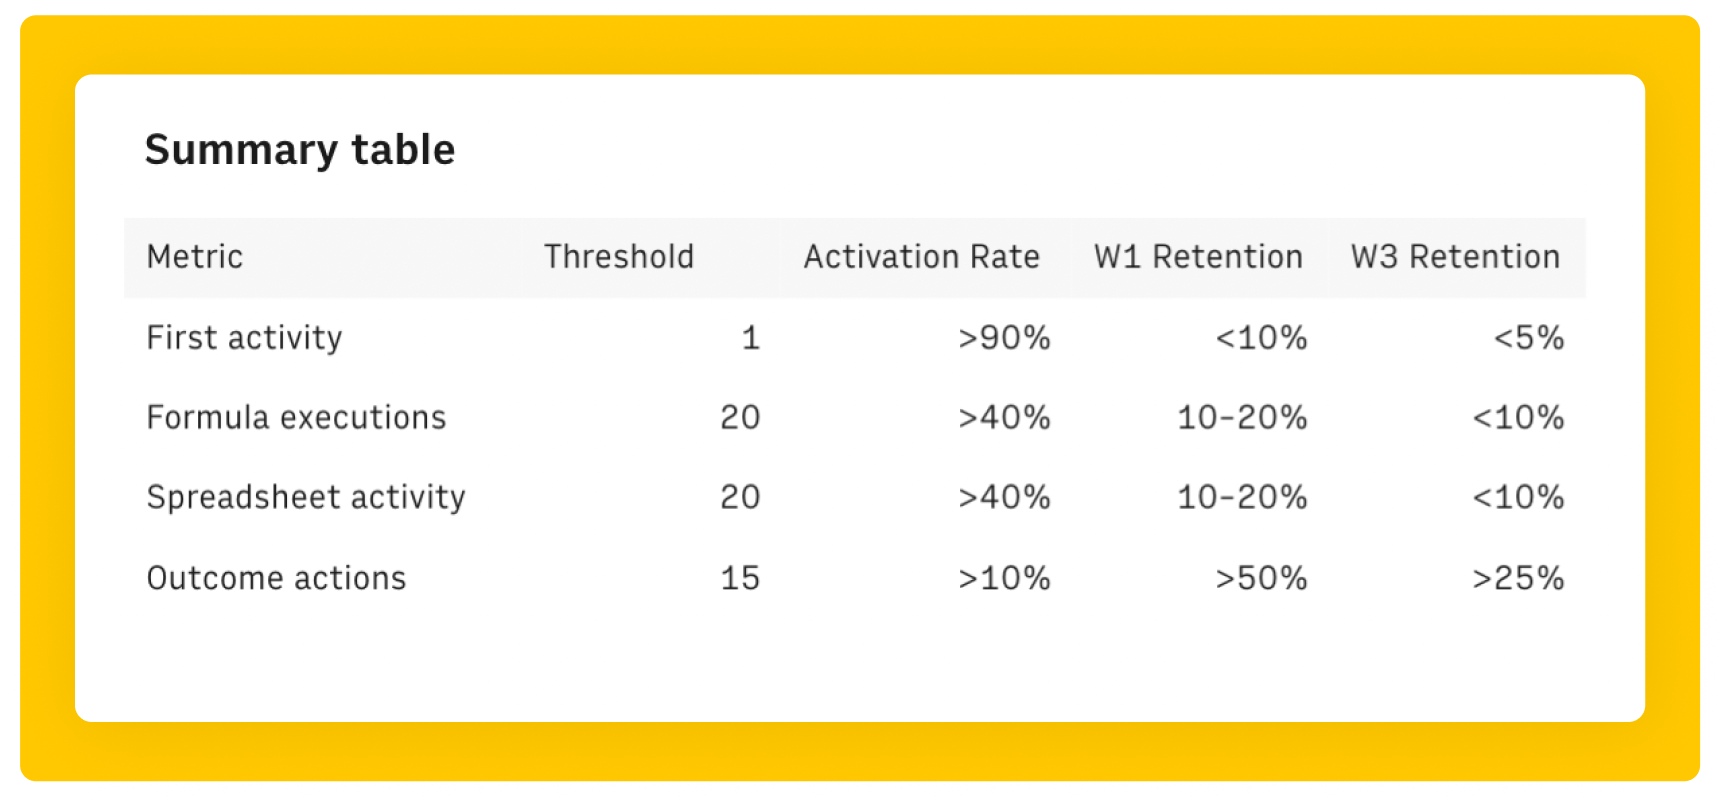
Phase I: First activity
Our first activation milestone was simply the first activity someone did in the product. This meant the first time the person landed on the rows dashboard, or landed on a spreadsheet for the first time.
While this was very easy to measure and understand, it was a poor proxy for value and not correlated with user retention.
Correlation to week 1 user retention: < 10%
Phase II: Formula executions
The second metric we picked was more sophisticated. At the time (2020), the #1 driver of value to our users was importing data from integrations. We used that insight to assume that value = use of formulas, and picked as activation the moment when a user crossed a threshold of using 10 formulas across their spreadsheets.
This ended up not good enough because: a) it excluded people - 5-10% of our user base- who were using Rows for “simple” spreadsheets without formulas b) the activation milestone was too easy to reach. About ~50% of people start their experience with Rows using a template where one can easily execute tens of formulas just by trying it out.
Correlation to week 1 user retention: 10-20%
Phase III: Spreadsheet activity
We then broadened the activity beyond formulas, and considered every execution inside a spreadsheet: adding formulas manually, doing copy-pastes of data into cells or inserting numbers and text into cells.
After a few weeks we saw that this had the same downsides as Phase II: adding a lot of things to a spreadsheet does not mean you got value from it. Using a template that outputs a large table, or importing a large csv file to Rows almost guaranteed that a user crossed the activation threshold, even if they never got real, sustained value from the product.
Correlation to week 1 user retention: 10-20%
Phase IV: Product actions
Finally, we took a step back and asked: if someone gets value from the product, what actions will they take outside the spreadsheet that are true to every user type? We landed on these:
Creating a spreadsheet: creating more spreadsheets is a good proxy for value. If you create more spreadsheets, we can safely assume that you're getting more use from the product.
Viewing a spreadsheet: similar to creating, if you have multiple view sessions on spreadsheets one can infer that you’re getting value from it.
Inviting people to a spreadsheet/workspace: Inviting someone means that you got enough value from the spreadsheet that you deem it worth sharing.
Sharing a spreadsheet: Same logic. This includes sharing privately via the link, publishing to the community, or clicking the url/code to embed it.
To pick the threshold, we took different cut-off values for the aggregate number of these actions (5,10,15,20), analyzed the past user’s activity and calculated their hypothetical activation, week 1 and week 3 retention from the different cut-offs.
Now for the artsy bit, we picked the threshold that had the right balance between the activation rate and week 1 retention. The goal was to avoid these 2 common mistakes:
Picking a metric too hard to reach: If it’s too narrow, your retention will be high but the activation will be so low that you won’t know where to start to optimizing it. You’ll basically overfit the cohorts to your power users.
Picking a metric that is too easy to reach: Conversely, if you make the activation threshold too low, you’ll find that the retention will be a fraction of the activation rate, which means it won’t be a good proxy for long-term retention. This conflates both variables and makes it extremely difficult to know which one you should focus on.
We settled on 15 actions. It has a high enough activation rate (>10%) to be meaningful, it was a good predictor of retention, and at around 15 actions there was a clear inflection point in user retention. Now the job is to obsess over it, and improve the product experience to get more people over the line.
Correlation to week 1 user retention: >50%
Final notes
In the end, picking your activation metric is a great exercise on how well you know your product, who it is for, and what makes people come back. If you’re like us, the activation metric will become one of the most important KPIs for your Growth, Marketing and Product teams.
And if you’re not, well, I hope you take away a few of the lessons that took us 4 years to learn.
If you have feedback, questions about the topic or want to continue the conversation, reach out.