2022 W45 - Making the most of WebSummit.


Rows is now "Building in Public". Every week I'll post about one thing that happened!
The previous post was on The Dip. Our metrics had gone down, and we dived into them. Also: the metrics picked up again!
---
Most of my week was spent at the WebSummit in Lisbon. It's one of the largest startup events in the world with ~70.000 people attending.
With those many people, there's plenty to do at the WebSummit. But it's important to be focused, as these events consume days at a time, plus travel. Just as our team is focusing on our most critical challenges, like Virality, Data Tables or the Grid, so should we focus when attending big Events.
There's usually 3 approaches to events:
Explore the main space, hitting on booths and making new friends where possible. This the worst strategy in my opinion. You do meet great people, maybe even score a user or two, but it's not efficient; the internet is a much better way to find and meet strangers with like-minded setups, and is there 24-7. Twitter and Linkedin are the ultimate town-halls for business people.
Score a speaking opportunity, ideally in a key stage. We've had our share, for example in Slush. Stage presentations result in lots of visits, even signups, but in our experience the effects wane fast; and you can get media attention cheaper and faster on your pajamas..
Go big on side events, and create your own. In my opinion this is the most predictable way to succeed when going to events. Side events organizers always appreciate interesting speakers, and you can even do your own. You will get a smaller audience, but a much more engaged one. You will gain power users.
This year we had no Stages so I skipped the WebSummit Arena altogether and went directly to side events. We didn't even buy WebSummit tickets, and still got a lot of value out of it.
In particular, I did a Workshop with users, spoke at a side-event (by McKinsey & Company), attended our Investors events (Accel, Lakestar, Shilling) and met other relevant people from the ecosystems, including users, entrepreneurs and investors.
The Workshop
The most valuable of all was the Workshop that Rows organized. I proposed to meet with an existing user, then I asked him for similar companies who had the same challenges, and then built the rest of the event around it.
The Workshop was ~1h15 and had 4 moments:
What is Rows.com? I guided people through the value proposition of Rows by sharing our webpage. We have done this with slides many times, but I felt it'd be cool to show our main "business card", the homepage. It creates familiarity AND is already built and fine-tuned. Of course, I didn't read the whole website, and instead did a voice-over using the visuals. This was ~5 minutes.
What can you do with Rows? (that actually adds value).
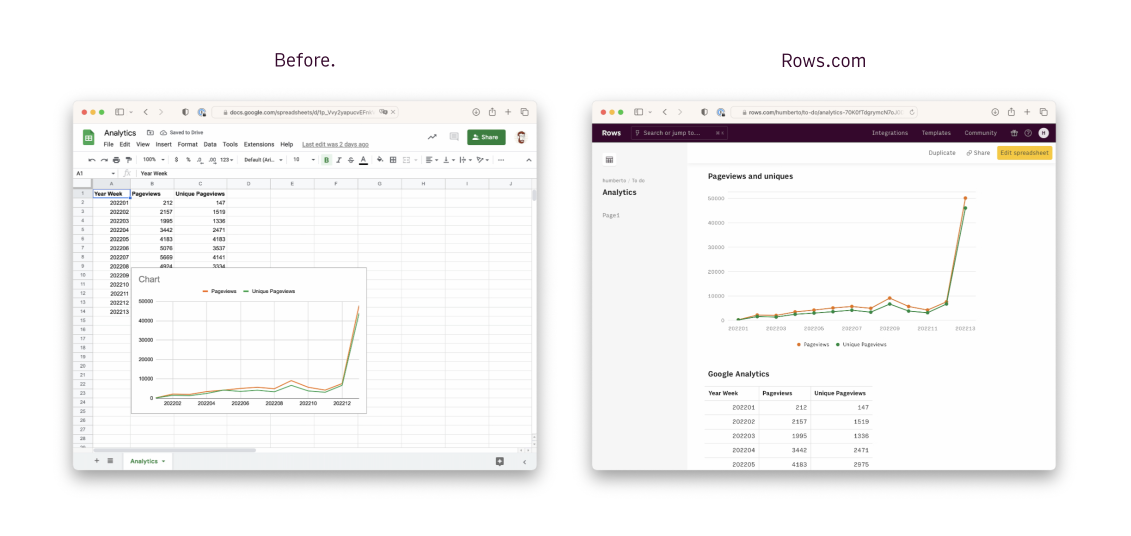
First I showed the audience what you get by using Rows when you create a Report in Rows instead of in one of the old spreadsheets. I did it by showing two similar spreadsheets side-by-side, one built in Rows and another in GSheets. (Image below).
Next was Reports, which are great for internal teams KPIs and investor dashboards. I demoed our Investor Dashboard, which is a community spreadsheet that mimics the actual doc we share with our board and team.
After that we dove into some Templates of Reports for Marketeers - Google Analytics, Twitter Tracking and Facebook Ads Campaigns.
Finally, I showed them how to build a Report for Sales teams by importing Salesforce data. I did this Live.
Easy Rows tricks you can't do elsewhere.
Charts Embedding! It's simple and powerful to display a Chart that is always updated on another tool like Notion. Learn all about Embeds here.
Exporting Charts. Users love Charts, and there's few things better than copy-pasting them or exporting them with custom elements (like your company logo) automatically.
Embedded Calculators. Just as with Charts, you can also add an embed of a regular table, and it not only updates in real time but also you can even play with the inputs!
Q&A and Feedback.
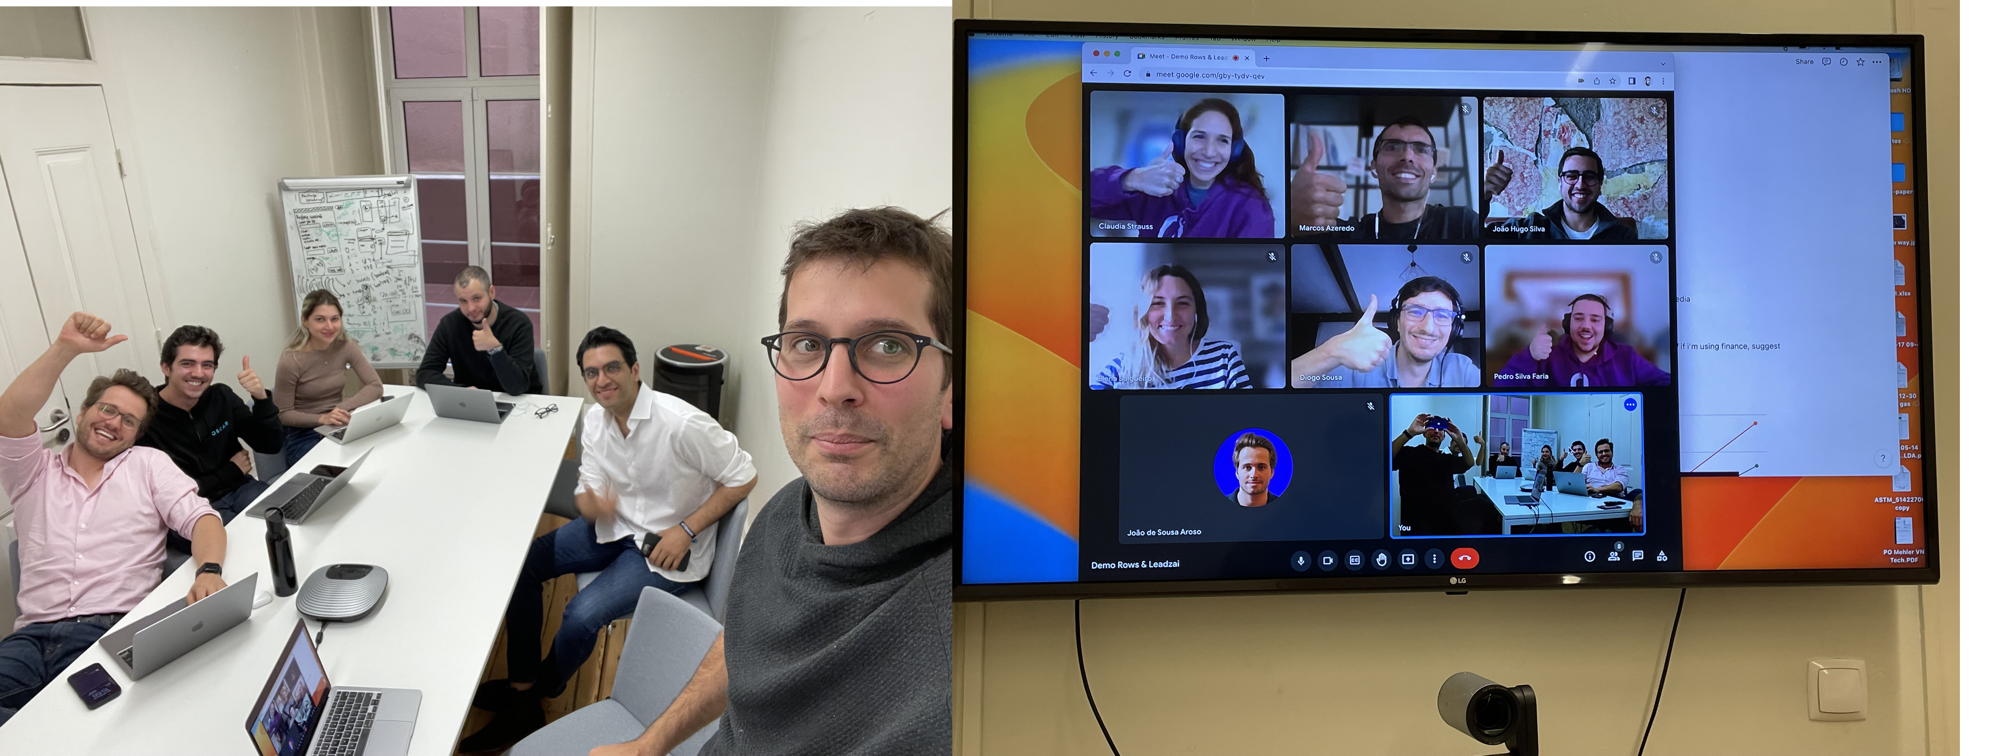
We had a nice productive feedback session. Some people joined remotely too, which increased the types of things asked!
Question: "what are the outputs into other services like?" Well, many services are input only, that is you can only fetch data, like our Google Analytics Integrations. But others you can write to, like our Salesforce Integration. You can also use our generic API connector functions GET() and POST() to talk with any API, read or write.
Question: "Do people need Rows accounts to use shared docs?" Good question, but No! You can share any spreadsheet with a private link. Open the "Share" panel and active "Share privately with a link". That link lets anyone consume the spreadsheet. If you add interactive components like Input Fields or Date Ranges, they'll be able to play with them too.
Question: "What is Rows's role in making spreadsheets less likely to errors?" I we deeply believe in spreadsheets, so we want them to be agile and flexible as they've been. But we also think there's space to guide users, and that's our Wizard for Functions and Data sets up the functionality for you. We also built Live Sharing so that you can share your spreadsheets with users who are more interested in seeing your reports and analysis and not so much in seeing formulas; The separation between an Editor and a spreadsheet viewer are very important.
Question: "Is this a replacement for BI tools?" No. There's significant an overlap between Spreadsheets (getting more powerful) and BI (getting easier). Fundamentally, though, spreadsheets are a software which teams use to think and model everyday, much more flexible and BI are tools to formalize data processes.
Suggestion: "You should invest in functions that fill out data (predictively) and that outputs smart insights". 100%. Being able to generate insights from data is the future!
Suggestion: "You should recommend spreadsheets from the Community and Templates as users navigate other spreadsheets." Again, a good idea.
Ask: "We have no idea what our BI looks like, we have a lot of DataStudio things spread out, we can't find docs, we don’t know who they are shared with… this can help." There's a term in larger companies called "shadow IT" which applies here. Shadow IT is the state of disorganization that happens when companies adopt software tools faster than they can have governance in place, generating a blind spot, apps that admins don't know about and, ultimately, wasted time and less security. While Rows doesn't have an enterprise solution for monitoring, we are indeed anti-shadow IT. The fact that data input happens through connections means that we know who accesses it; exposing this information to Workspace owners and Admins is certainly in our future.
Ask: "Can you build a Postgres and BigQuery integrations?" We can. They're not our priorities this quarter, we will see if they become the roadmap for the next quarter.
In the end, several people were convinced that Rows is a tool for them. It was pretty fun too, with a good convo sprinkled with spreadsheet jokes. Great crowd!
Many thanks to Leadzai.com, Puter.com, Oscar-app.com and everyone who helped make this workshop happen.
--
See you next week!