Best 15 Free Google Sheets Dashboard Templates [2026, Dec updated]

Do you need to create a data dashboard but need help figuring out where to start? Do you want a way to visualize your data more efficiently and gain more precise insights? Are you interested in using Google Sheets dashboard templates that could significantly reduce your setup time?
Yes, right? If so, we've done the hard work for you. For a steal, here are 15 Google Sheets dashboard templates to help you track key performance indicators, visualize trends, monitor sales, analyze marketing metrics, and more!
In case you missed it: learn how to create a Google Sheets dashboard.

Your new AI Data Analyst
Extract from PDFs, import your business data, and analyze it using plain language.
Try Rows (no signup)What are the best 15 Google Sheets dashboard templates?
The dashboard templates below cover the following categories: project management, analytics reporting, marketing, sales, finance, and e-commerce.
Note💡: All the links to view these templates are in “view only mode,” so you need to make a copy of each template you want to use. After doing that, it automatically becomes your document, and you can do anything you want with it—which means you can customize it and create your dashboard.
Gantt Chart
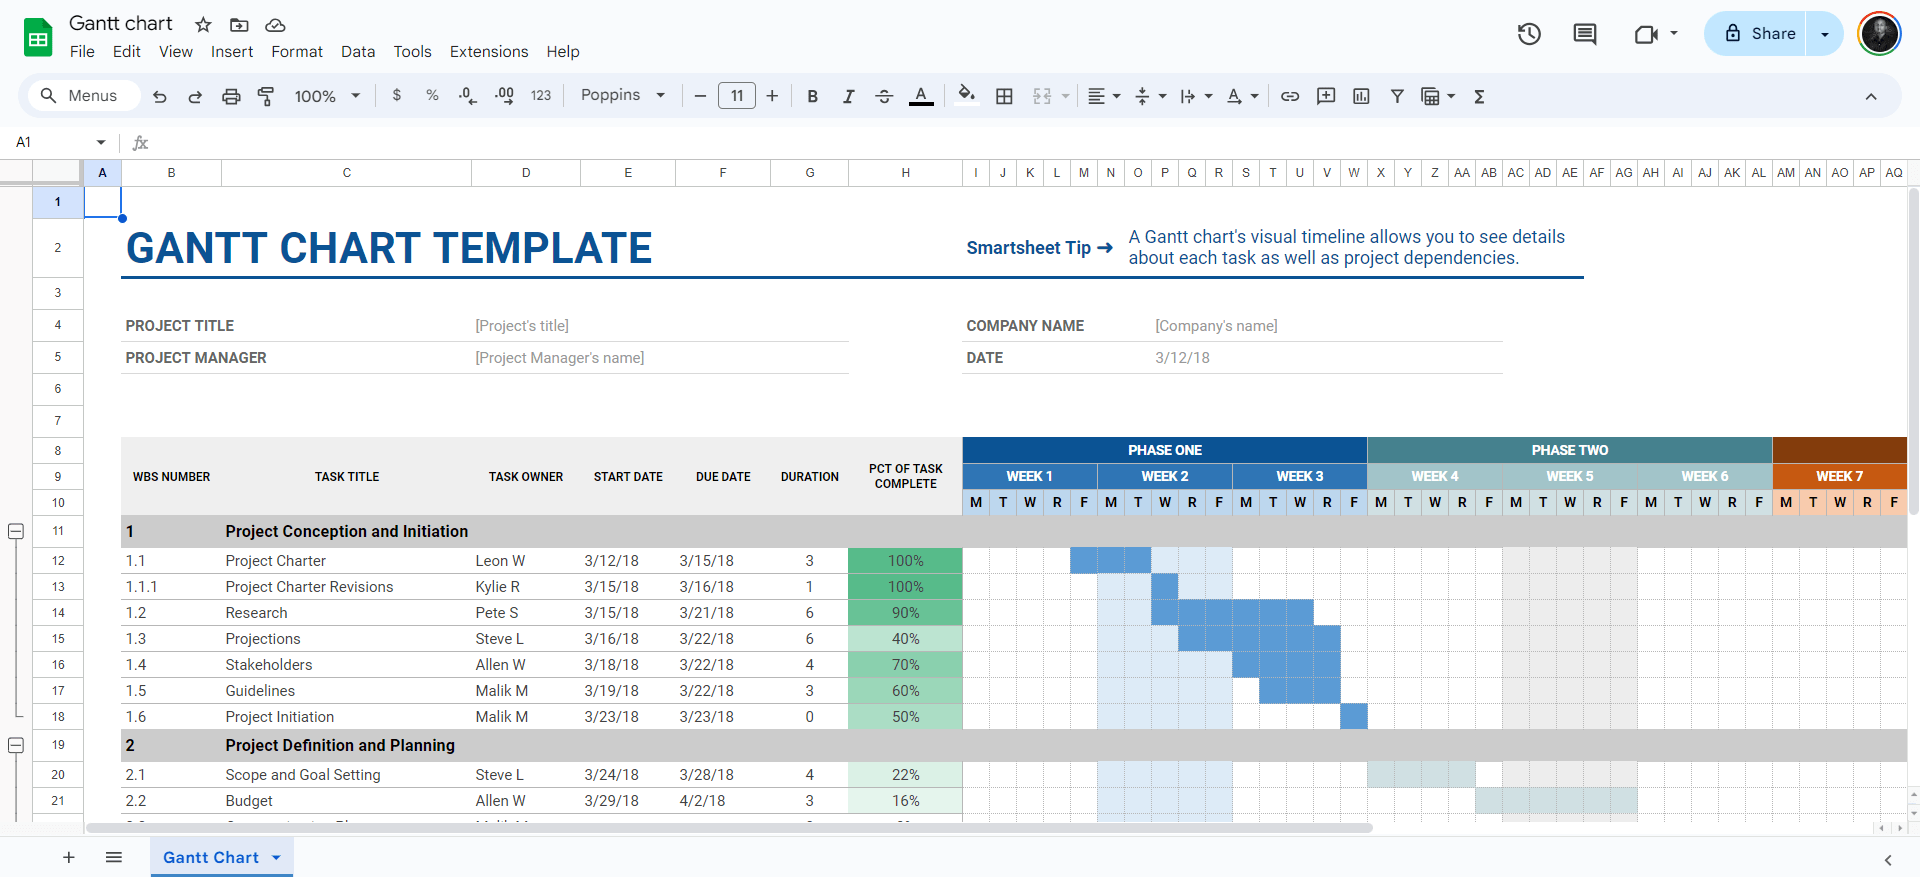
This template shows details about each task and project dependencies. It documents tasks, deadlines, dependencies, and progress in a horizontal bar chart. The Gantt Chart Dashboard allows project managers to easily track project milestones, allocate resources, identify potential bottlenecks, and communicate timelines to stakeholders.
➡️ Download the template here.
Project Tracking
This dashboard allows you to easily track projects in your organization. It provides an overview of deadlines, team performance, and project progress.
➡️ Download the template here.
Project Timeline
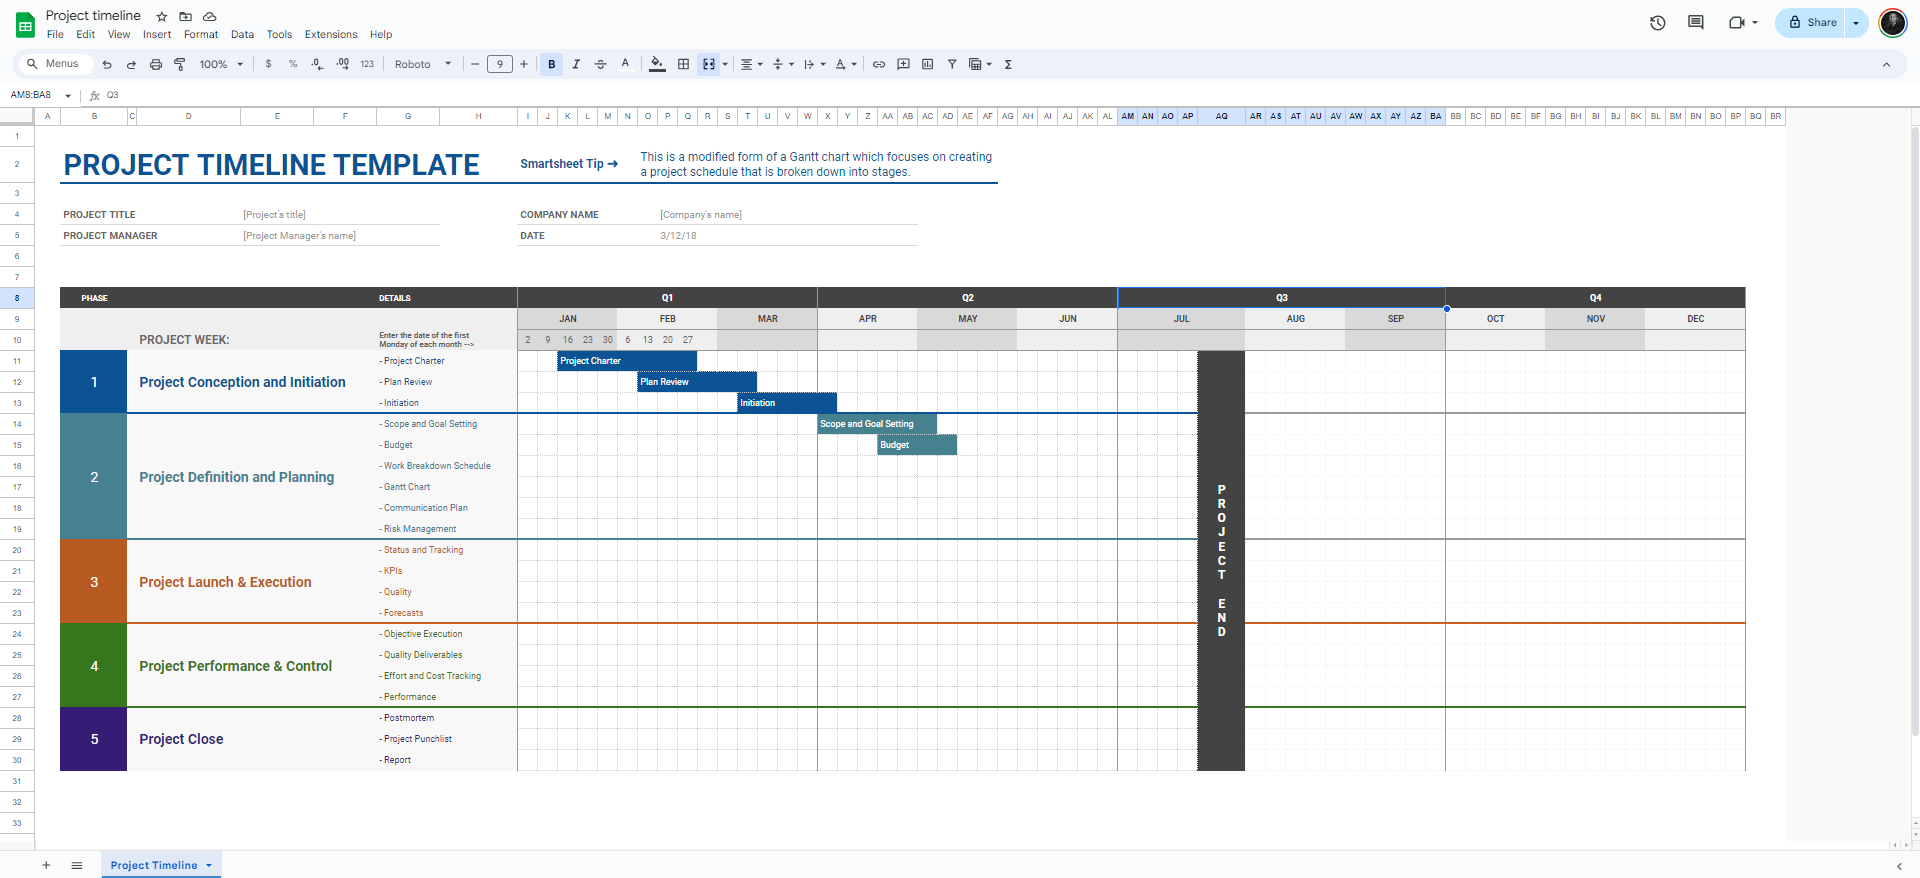
The project timeline dashboard template visualizes project schedules and milestones. Project managers and team members can quickly derive insights on deadlines, project disconnects, project expectations, and resources from the dashboard.
➡️ Download this template here.
RunningAnalytics dashboard
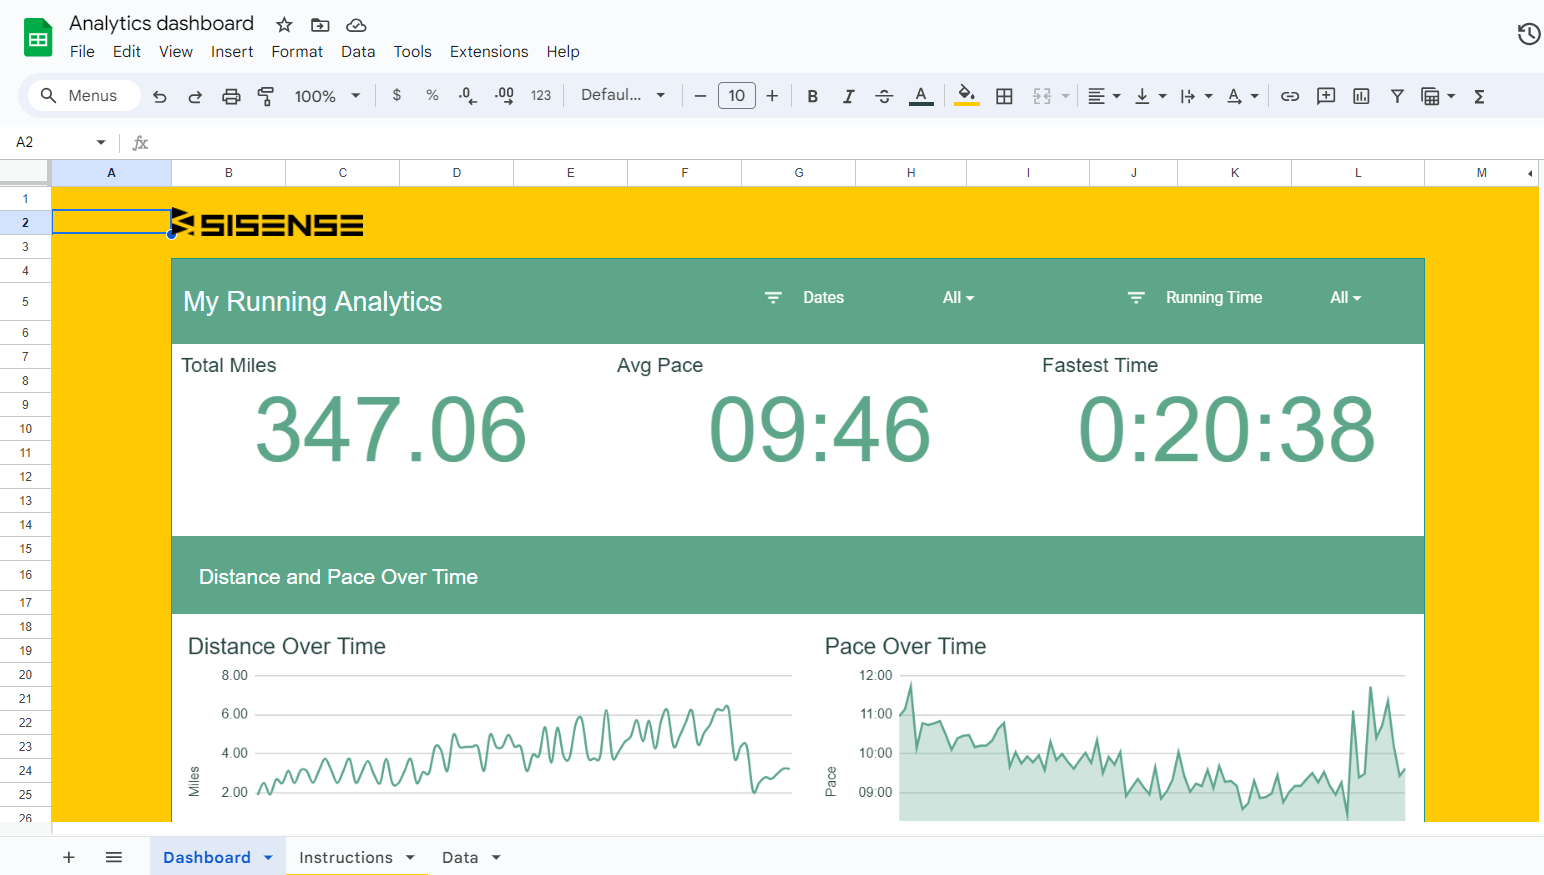
The running analytics dashboard monitors improvements, identifies improvement areas, and aggregates data from multiple inputs, runs, or insertions.
It provides a data-driven approach to tracking running metrics such as distance covered, pace, heart rate, elevation gain, and personal records.
➡️ Download this dashboard template here
Web traffic dashboard
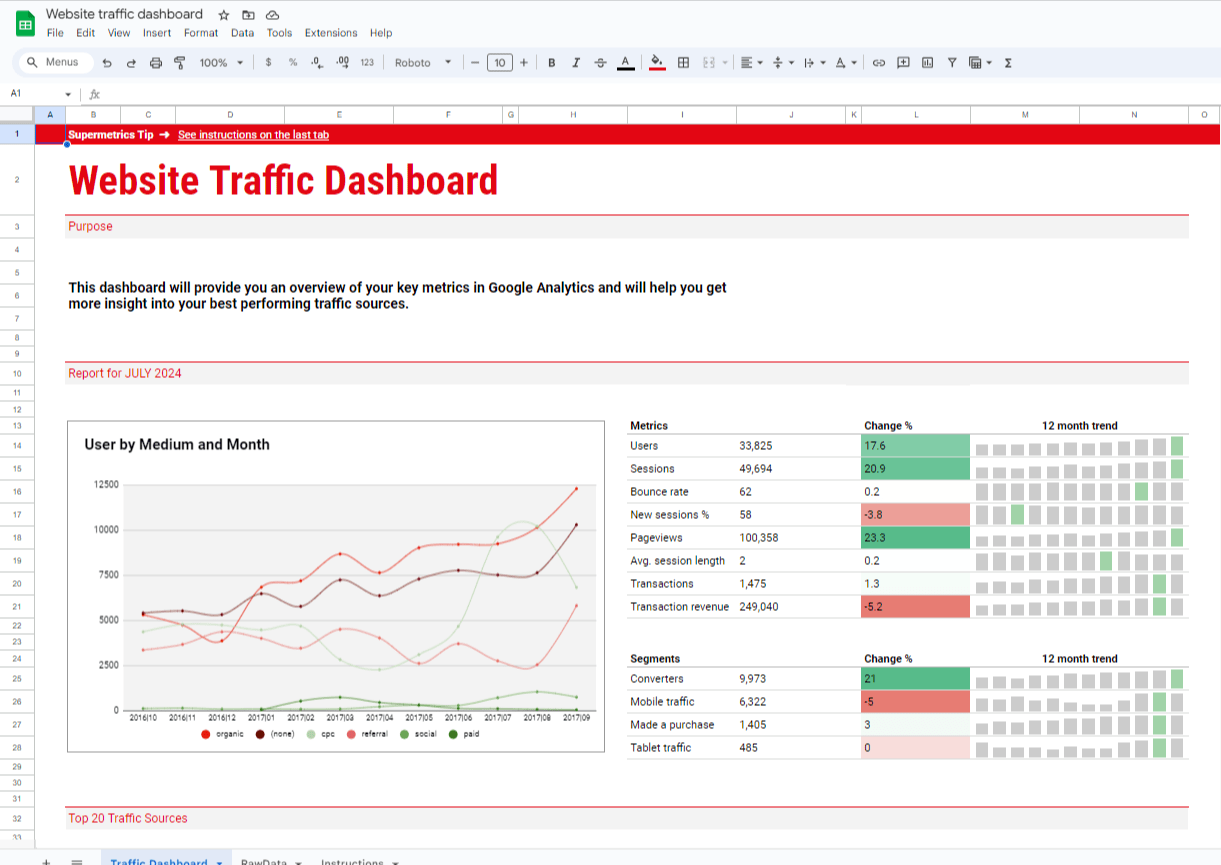
This dashboard template will provide a dynamic overview of key metrics in GA4 and help you gain more insights about your web traffic sources. The Web Traffic Dashboard enables marketers, webmasters, and business owners to gain quick insights into their site's performance, identify trends, and make data-driven decisions.
➡️ Download this dashboard template here.
Web paid traffic report
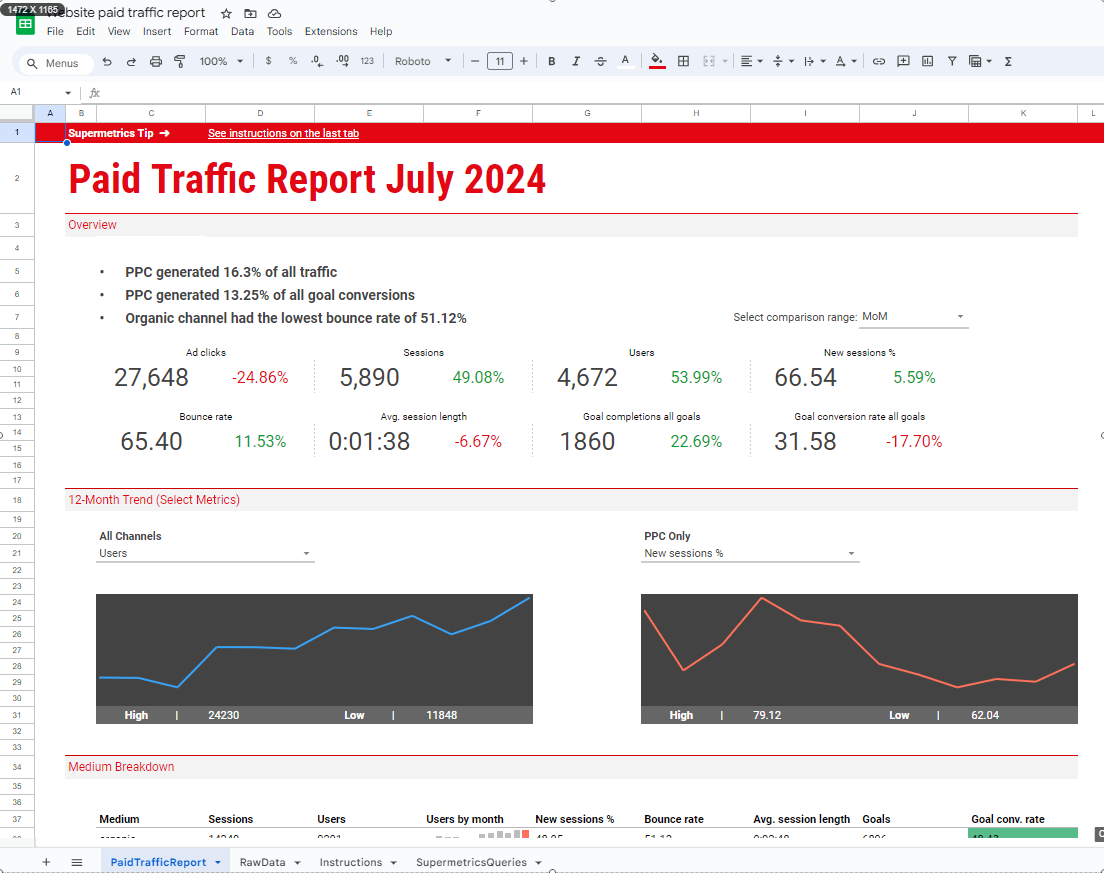
Want to know the amount of traffic your PPC campaigns are generating? This dashboard template gives you an overview of the traffic score, conversions, ad clicks, sessions, and many other key performance indicators necessary for a successful ad campaign.
➡️ Download this template here.
CRM report dashboard
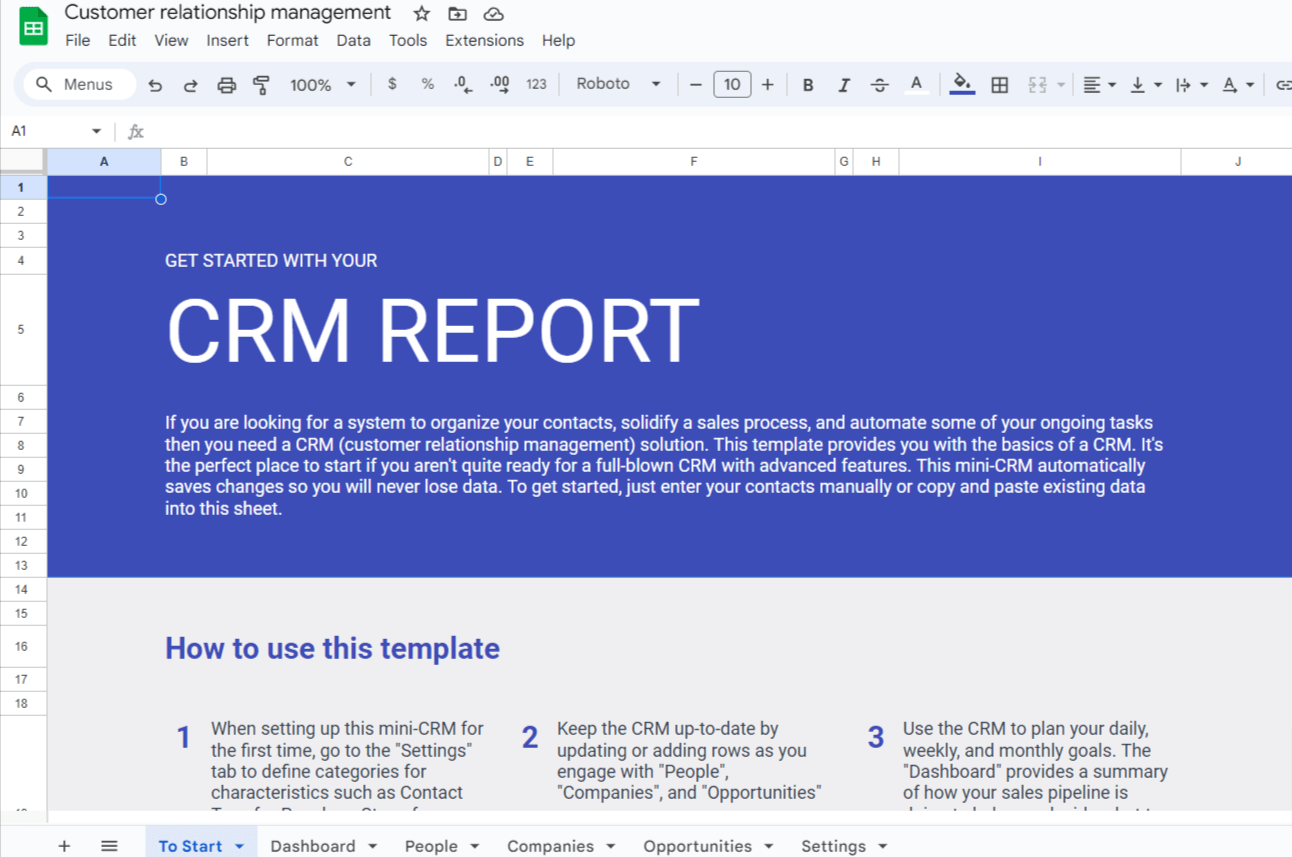
This template can comprehensively overview customer relationship management metrics and sales performance data. Using this template, you can optimize your sales strategies, improve customer engagement, and make data-driven decisions to boost revenue growth.
➡️ Download this template here.
Marketing dashboard template by HubSpot
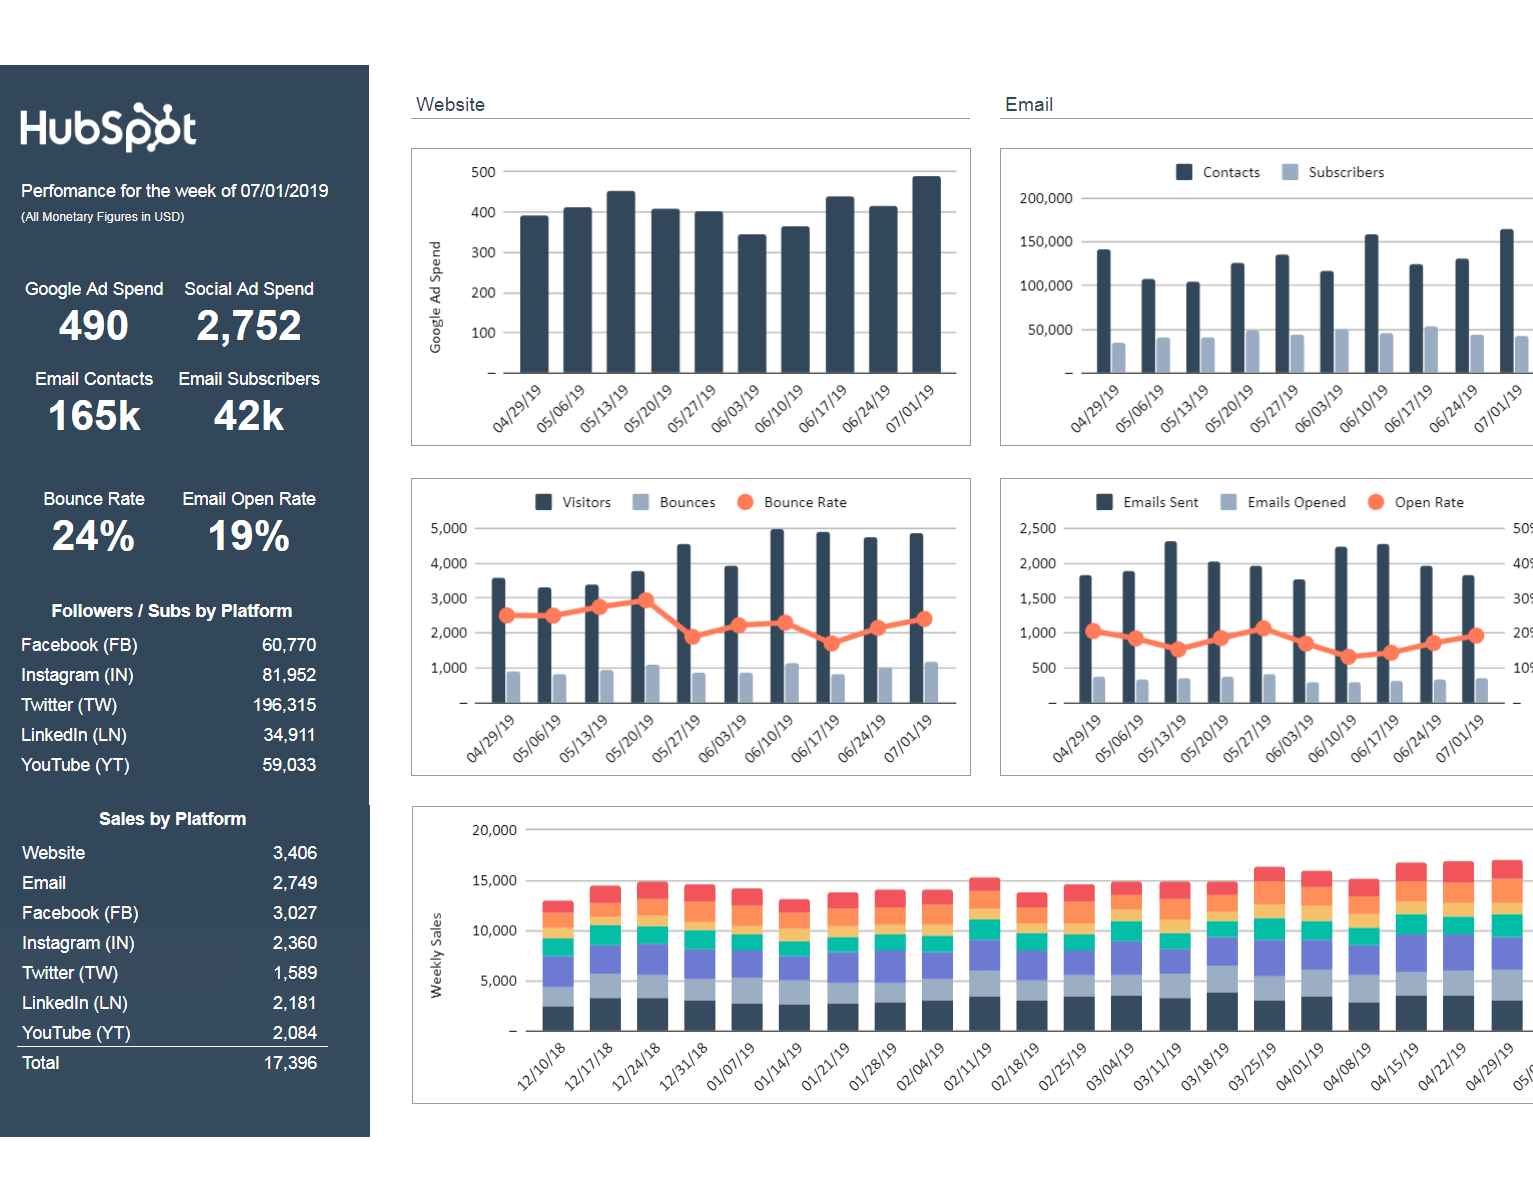
If you want to track the success of your latest marketing campaign, then this HubSpot marketing dashboard template is for you. It includes data on your marketing calendar, including your activities and spending on the website, email, and social media marketing. It also tracks your sales.
➡️ Download this template here.
Monthly Sales Dashboard
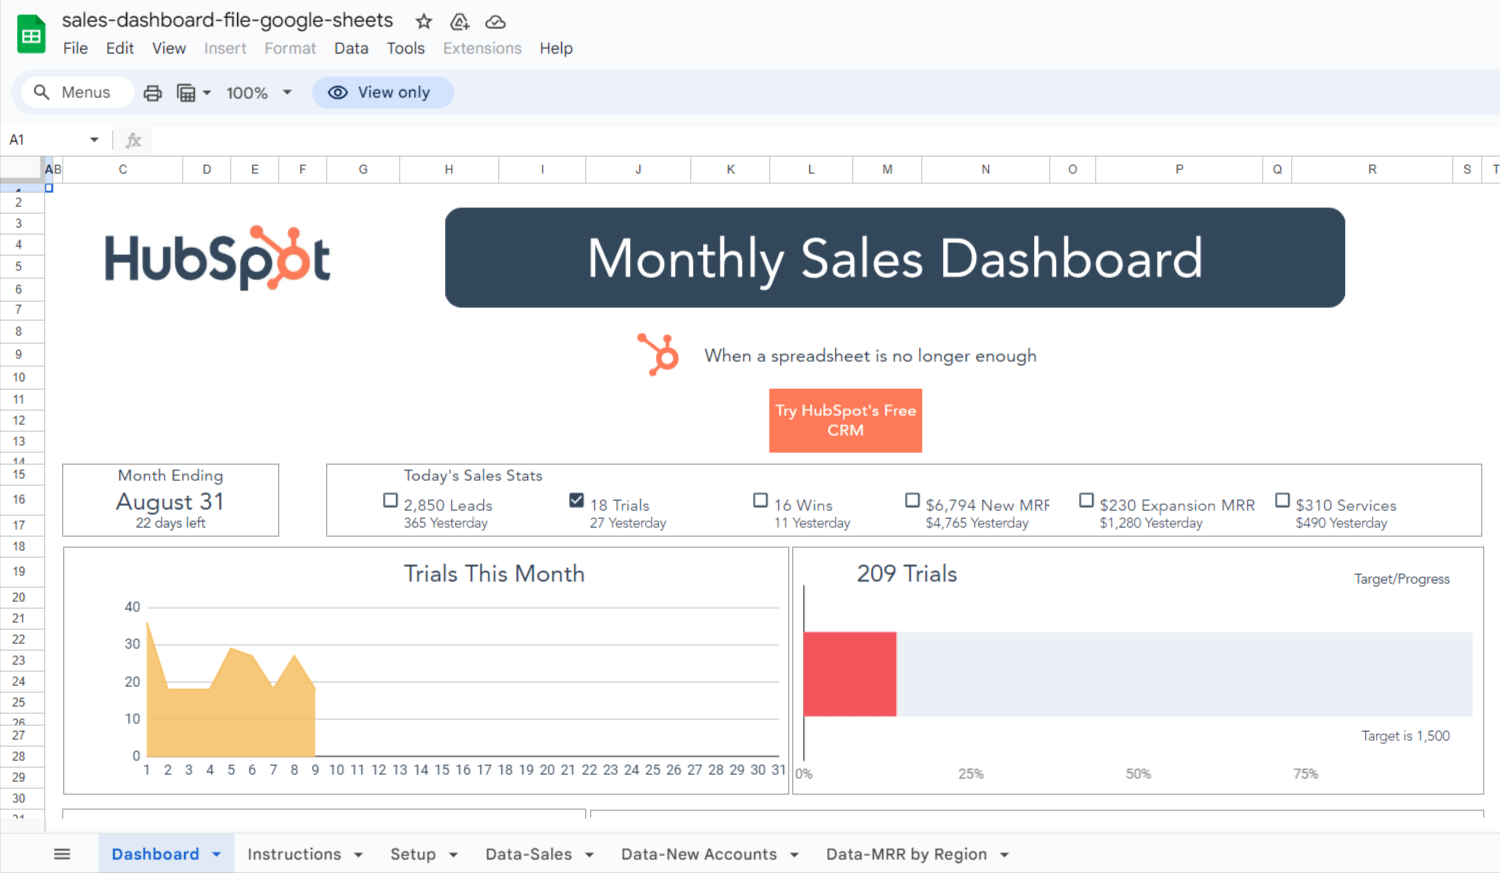
This template covers crucial aspects of sales management, including target account insights, high-level sales performance views, task tracking, account-based marketing strategies, and sales opportunity forecasting.
➡️ Download this template here.
Annual business budget
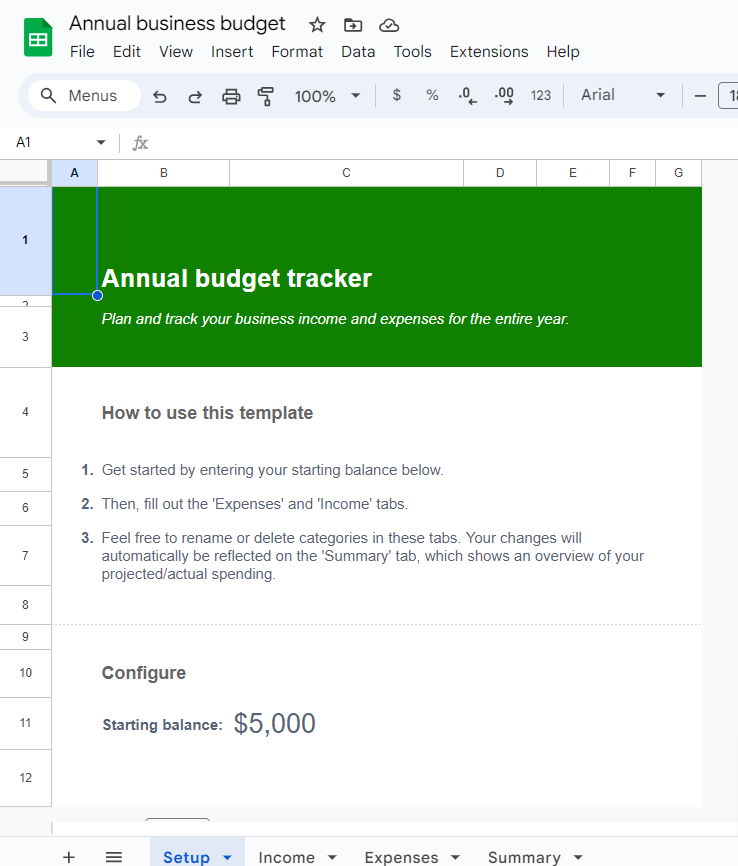
The annual business budget dashboard is handy for business account managers who want to make better-informed decisions about expenditures and income.
➡️ Download this template here.
E-commerce dashboard
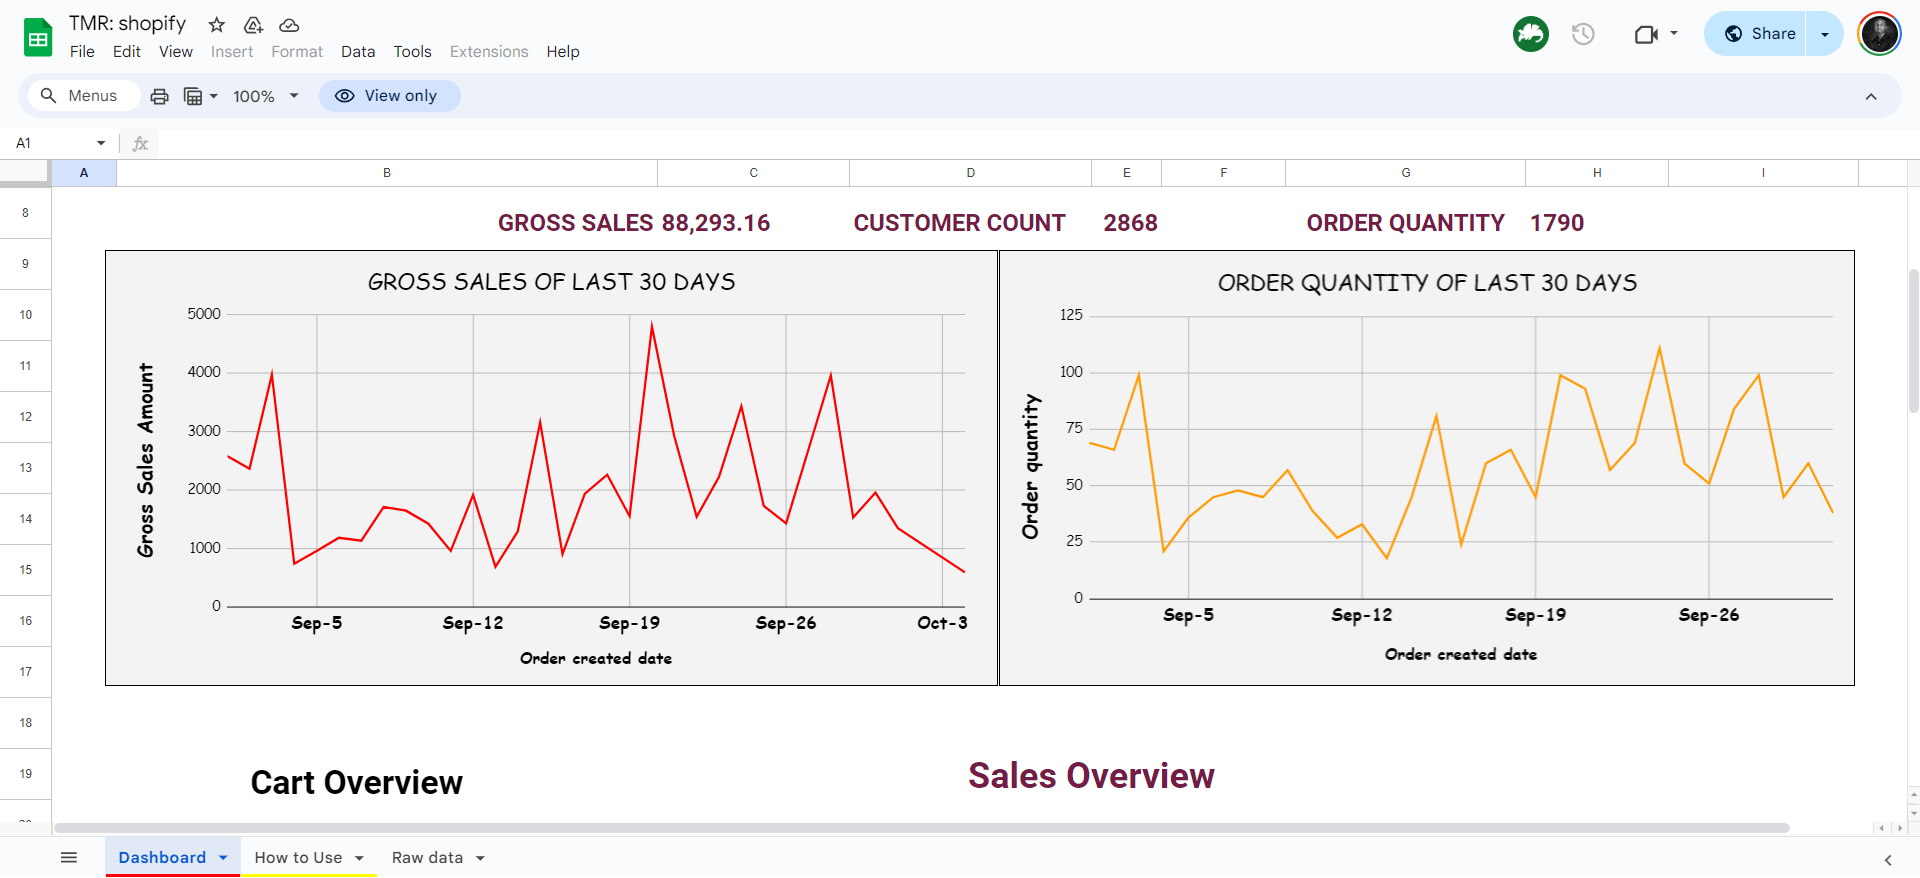
From cart reviews to checkouts and orders delivered — this template is essential for e-commerce and sales managers working for e-commerce brands. It overviews gross sales, customer count, and order quantity.
➡️ Download this template here.
Email marketing report dashboard
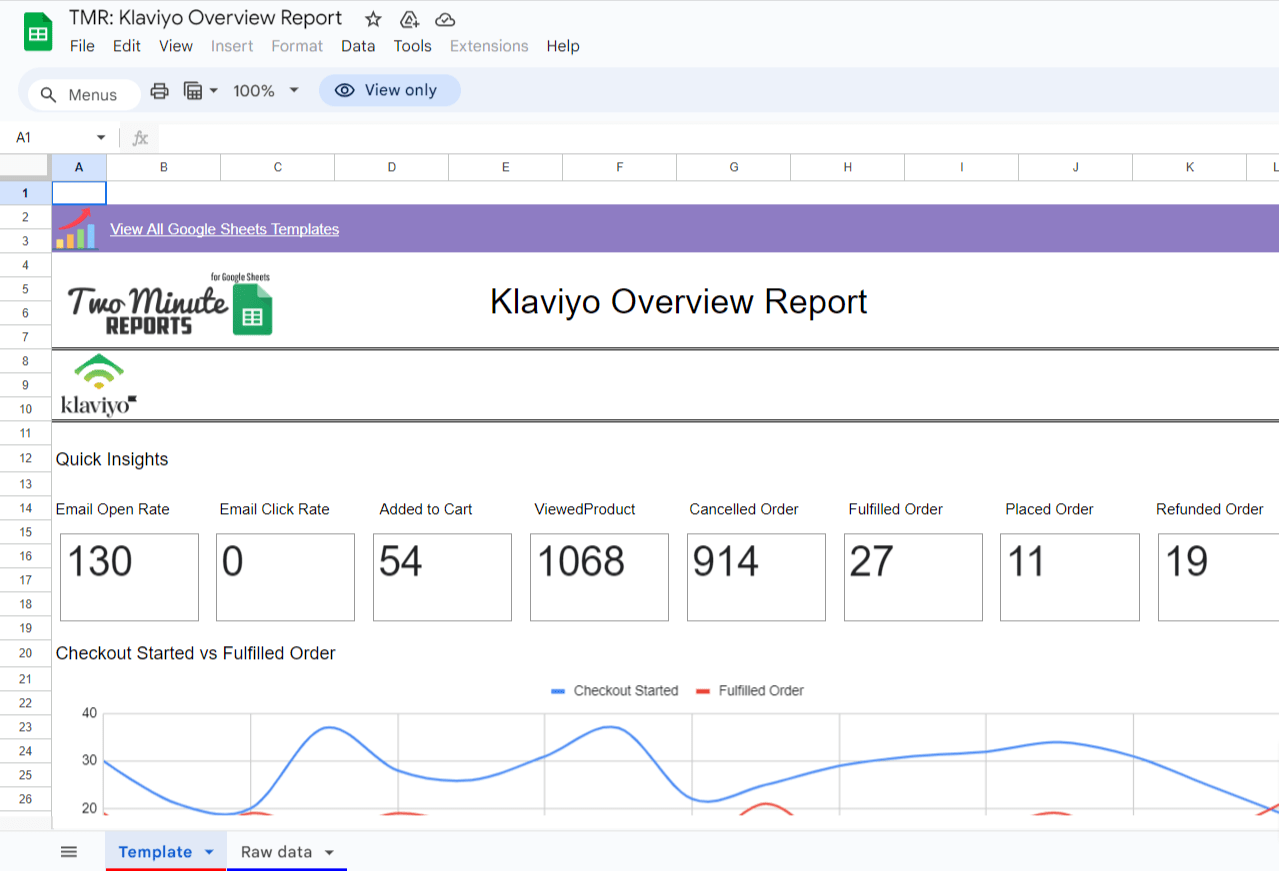
If you want to have a visualized representation of analytics of your email marketing list, then this template is fundamental. It shows your email open rate, email click rate, canceled order, etc.
➡️ Download this template here.
ABM dashboard template
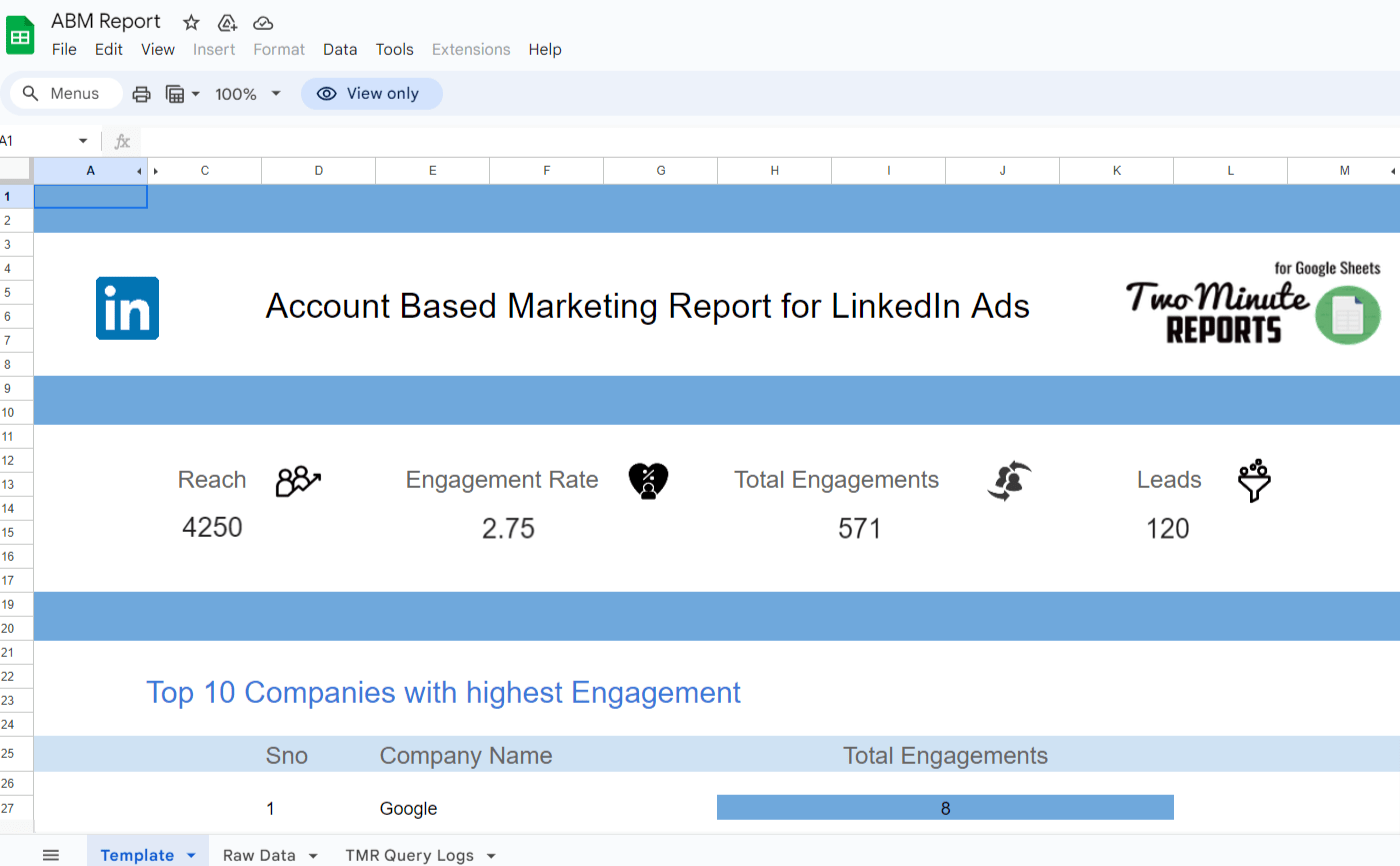
This Account-Based Marketing (ABM) Report Dashboard template for LinkedIn Ads offers a focused view of your targeted advertising efforts on the LinkedIn platform. Here's what such a template typically provides
➡️ Download this template here.
Weekly timesheet dashboard
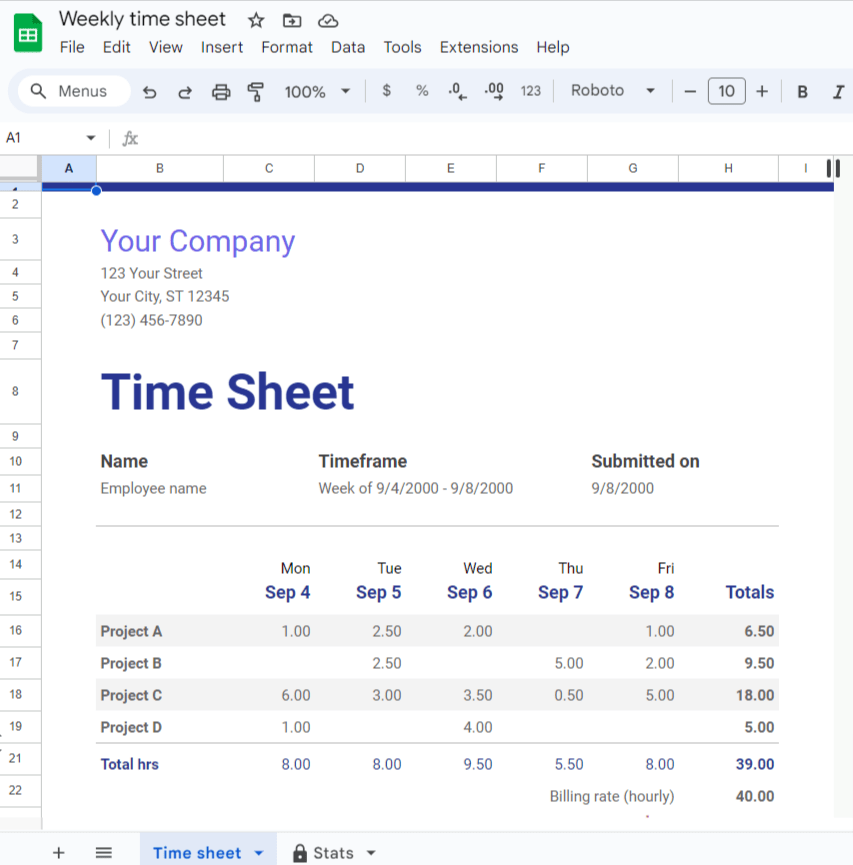
This template can create a comprehensive system for weekly tracking and analyzing work hours, project allocation, and weekly productivity. It provides an intuitive interface for employees to log their time across various tasks and projects while giving managers a clear overview of team productivity and resource allocation.
➡️ Download this template here.
Facebook ads dashboard template
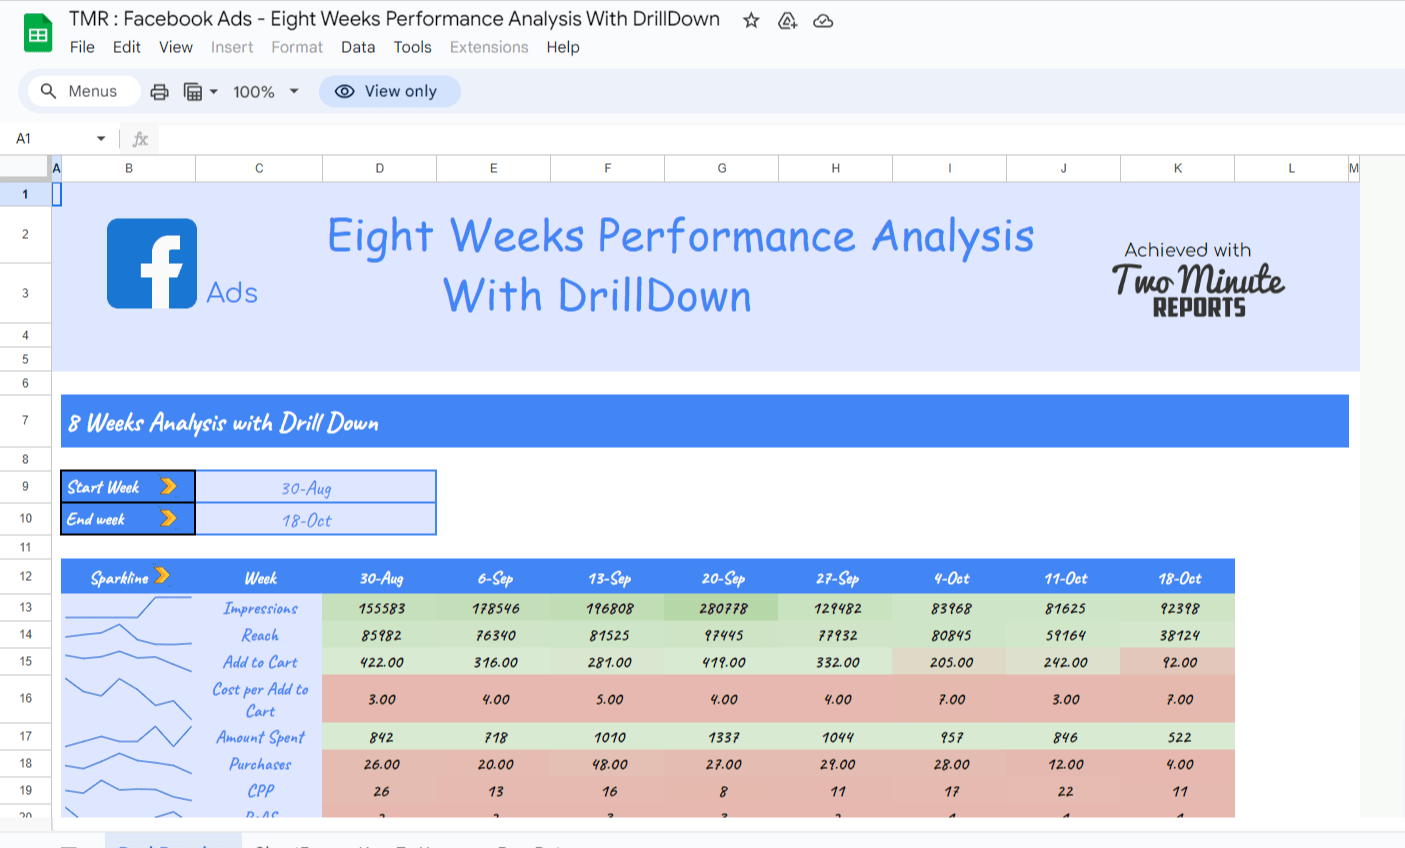
This Facebook ads dashboard template lets you derive insights about your ads' performance. It gives you a drill-down of the performance analysis depending on the start and end dates.
➡️ Download this template here.
How do you access Gsheets templates?
There are two basic methods of accessing Google Sheets templates.
Method 1: How to access Google Sheets using the template gallery
Step 1. Open your web browser and go to Google Sheets (sheets.google.com).
Step 2. Sign in to your Google account if you still need to do so.
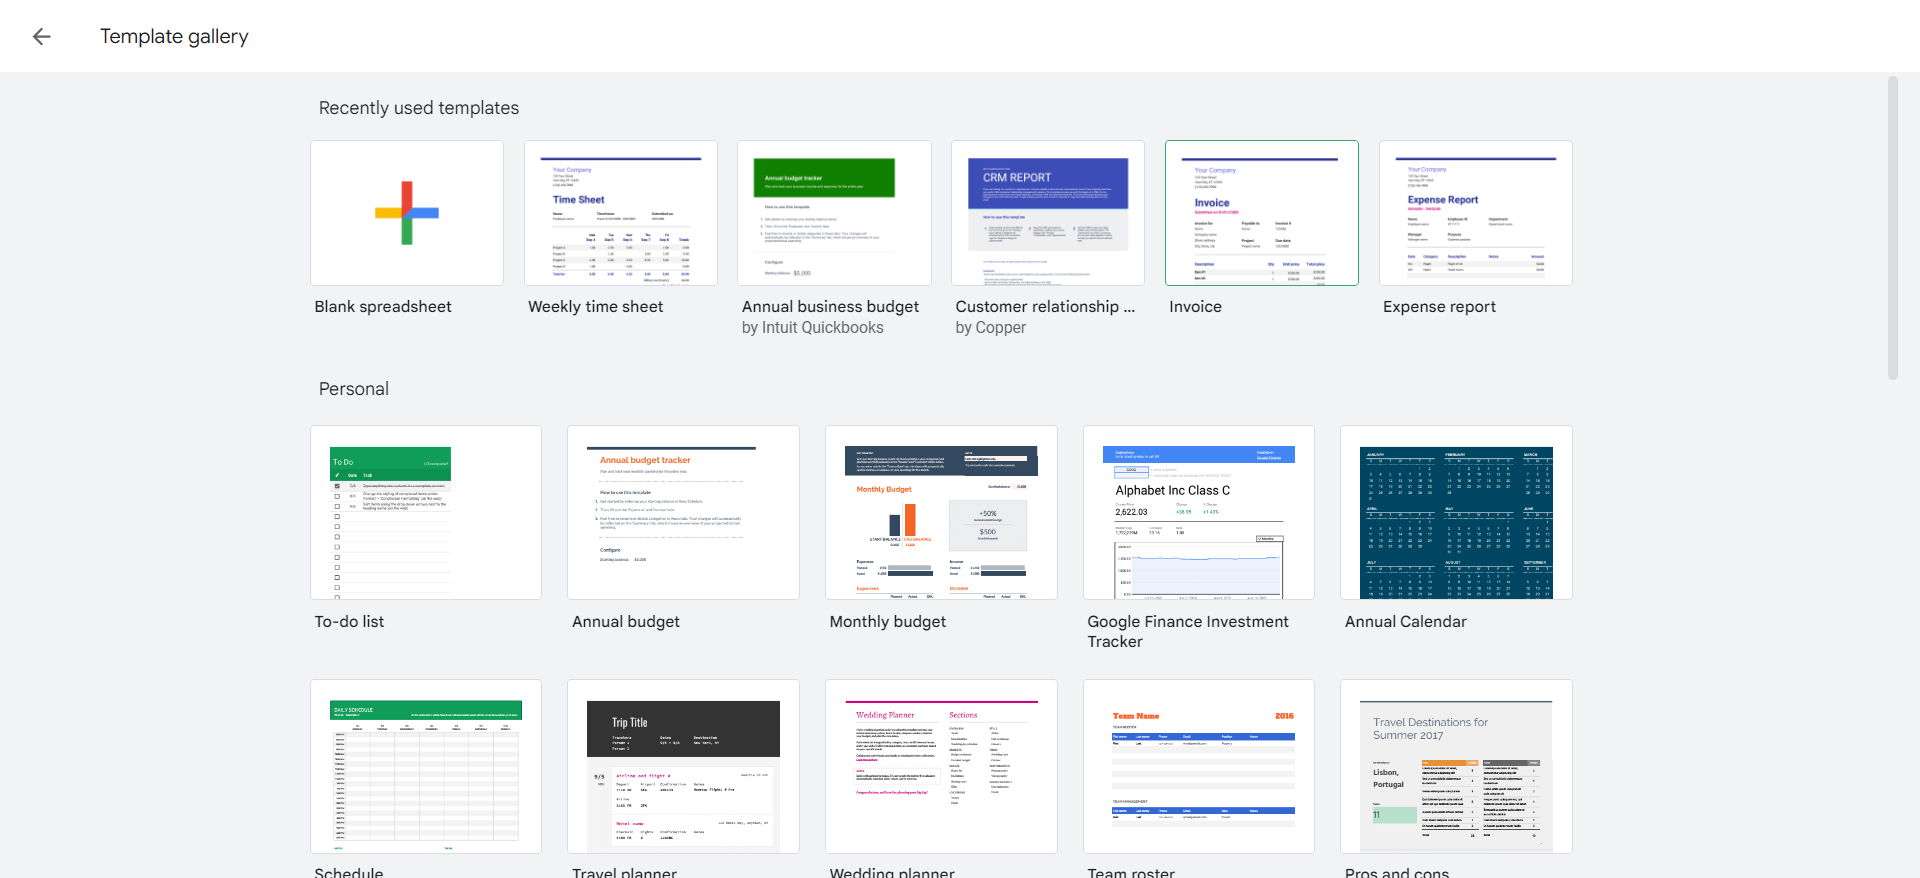
Step 3. Once you're on the Google Sheets homepage, look for the template gallery:
- If creating a new sheet, click on the "Template Gallery" option at the top of the page.
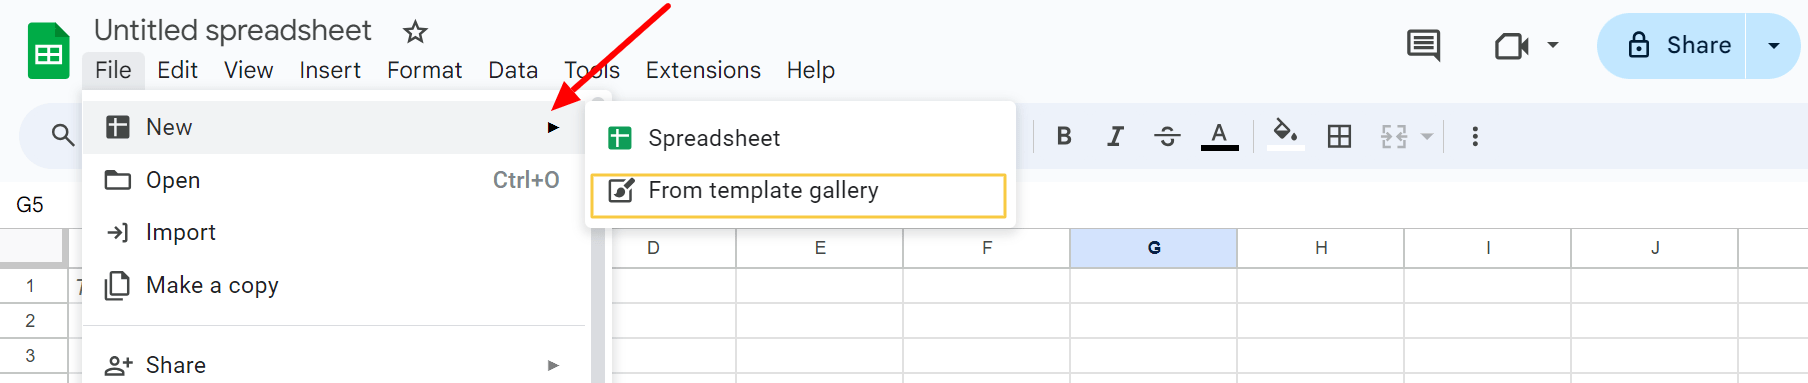
- If you're already in a sheet, click "File" > "New" > "From template
Method 2: Querying third party template
You can get access to Google Sheets dashboard templates via third-party sites like twominutesreport.com, template.net, or Good Docs website.
What are the drawbacks of using Google Sheets templates?
While Google Sheets dashboard templates are good, there are downsides to using it:
Poor UI
Unlike other dashboarding software, elements on Google Sheets often overlap and take time to build a tidy layout.
Missing Automation
Google Sheets falls short when automating data ingestion and aggregation from multiple sources. Plus, in the AI era, It fails to automate an otherwise manual job. It lacks AI-powered features that help you extract insights from your data. The only native integrations on Google Sheets are with BigQuery and Looker.
Lack of advanced visualization features
While Google Sheets offers good charting capabilities, it must improve when creating tidy, interactive and error-proof visualizations. Often charts and tables overlap, creating untidy visualization. Plus, there is no handy way to share a fully working dashboard without exposing its complete logic.
So, moving to a tool like Looker becomes a mandatory choice to get robust features for creating compelling visualizations.
Your new AI Data Analyst
Extract from PDFs, import your business data, and analyze it using plain language.
Try Rows (no signup)
Supercharge your sheets with Rows — top dashboard templates
Rows is your new AI Data Analyst. It combines the backbone of a spreadsheet with the power of ChatGPT to to give business people full autonomy over their data. Just ask in plain language and Rows will handle the rest, whether that's spreadsheet operations, data import or transformations, or running Python code to do code-level analyses.
It’s the new way teams at HP, AWS or Taxfix aggregate, make sense of it and speed up decision processes.
Compared to Google Sheets:
Rows has a tidier layout, whereby charts, tables and text boxes are modular components that can be rearranged in a tidy manner, just using drag and drop.
Rows comes with an AI Copilot that is trained over its spreadsheet backbone to build reports and dashboards and analyze data. With just plain language you can:
Pull data from your favorite tools:
Execute spreadsheets operations, such as VLOOKUPs, build charts or pivot tables
Run code-level analyses without writing a single line of code. See it in action against Google Sheets:
Rows comes with more than 50 native data integrations, that are easy to set up and maintain - either via configuration menus or via AI.
What Rows building a client-ready report in less than 5 minutes, using only plain language:
Discover more here: How to Build a Dashboard on Rows.
After learning how to build a dashboard, here's the juicy part of our templates —
Our tool comes with over 50+ integrations to make it easier for you to create reports in seconds. These integrations also include 100+ dashboard templates for your business reports.
So, how does it work? To show you that, we'll walk you through a few dashboard templates:
1. Website Analytics Dashboard
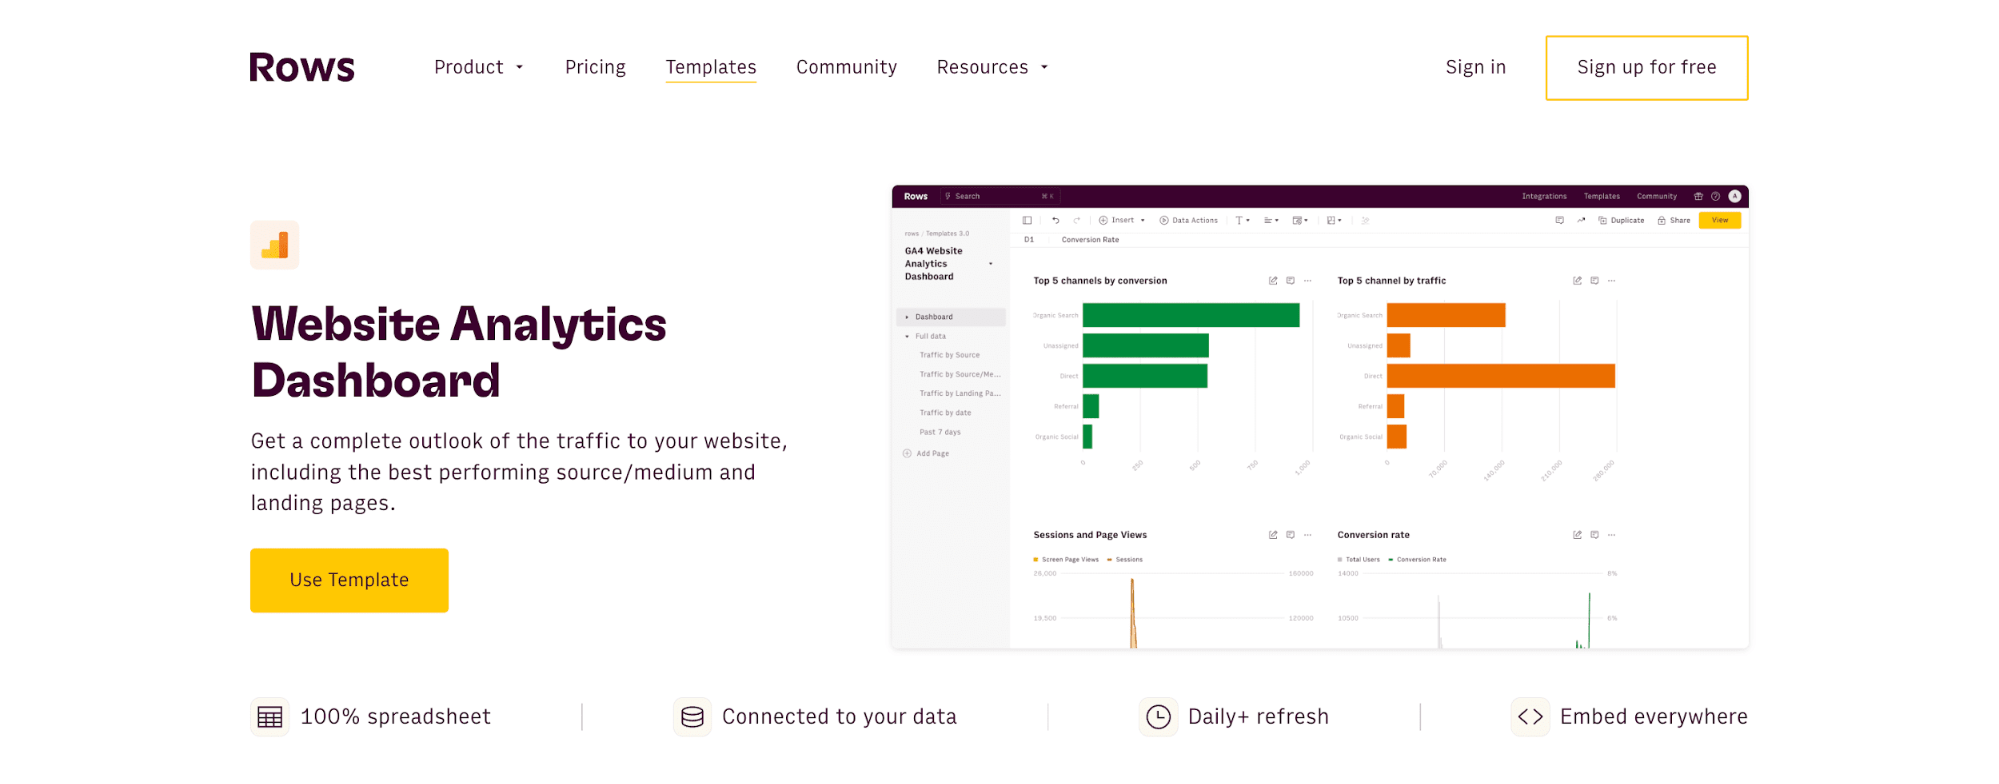
Whether you are curious about your best-performing landing pages, your site's bounce rate, or other SEO details, the Rows dashboard template makes it easy to access them.
Interested in marketing analytics? Discover our additional dashboards:
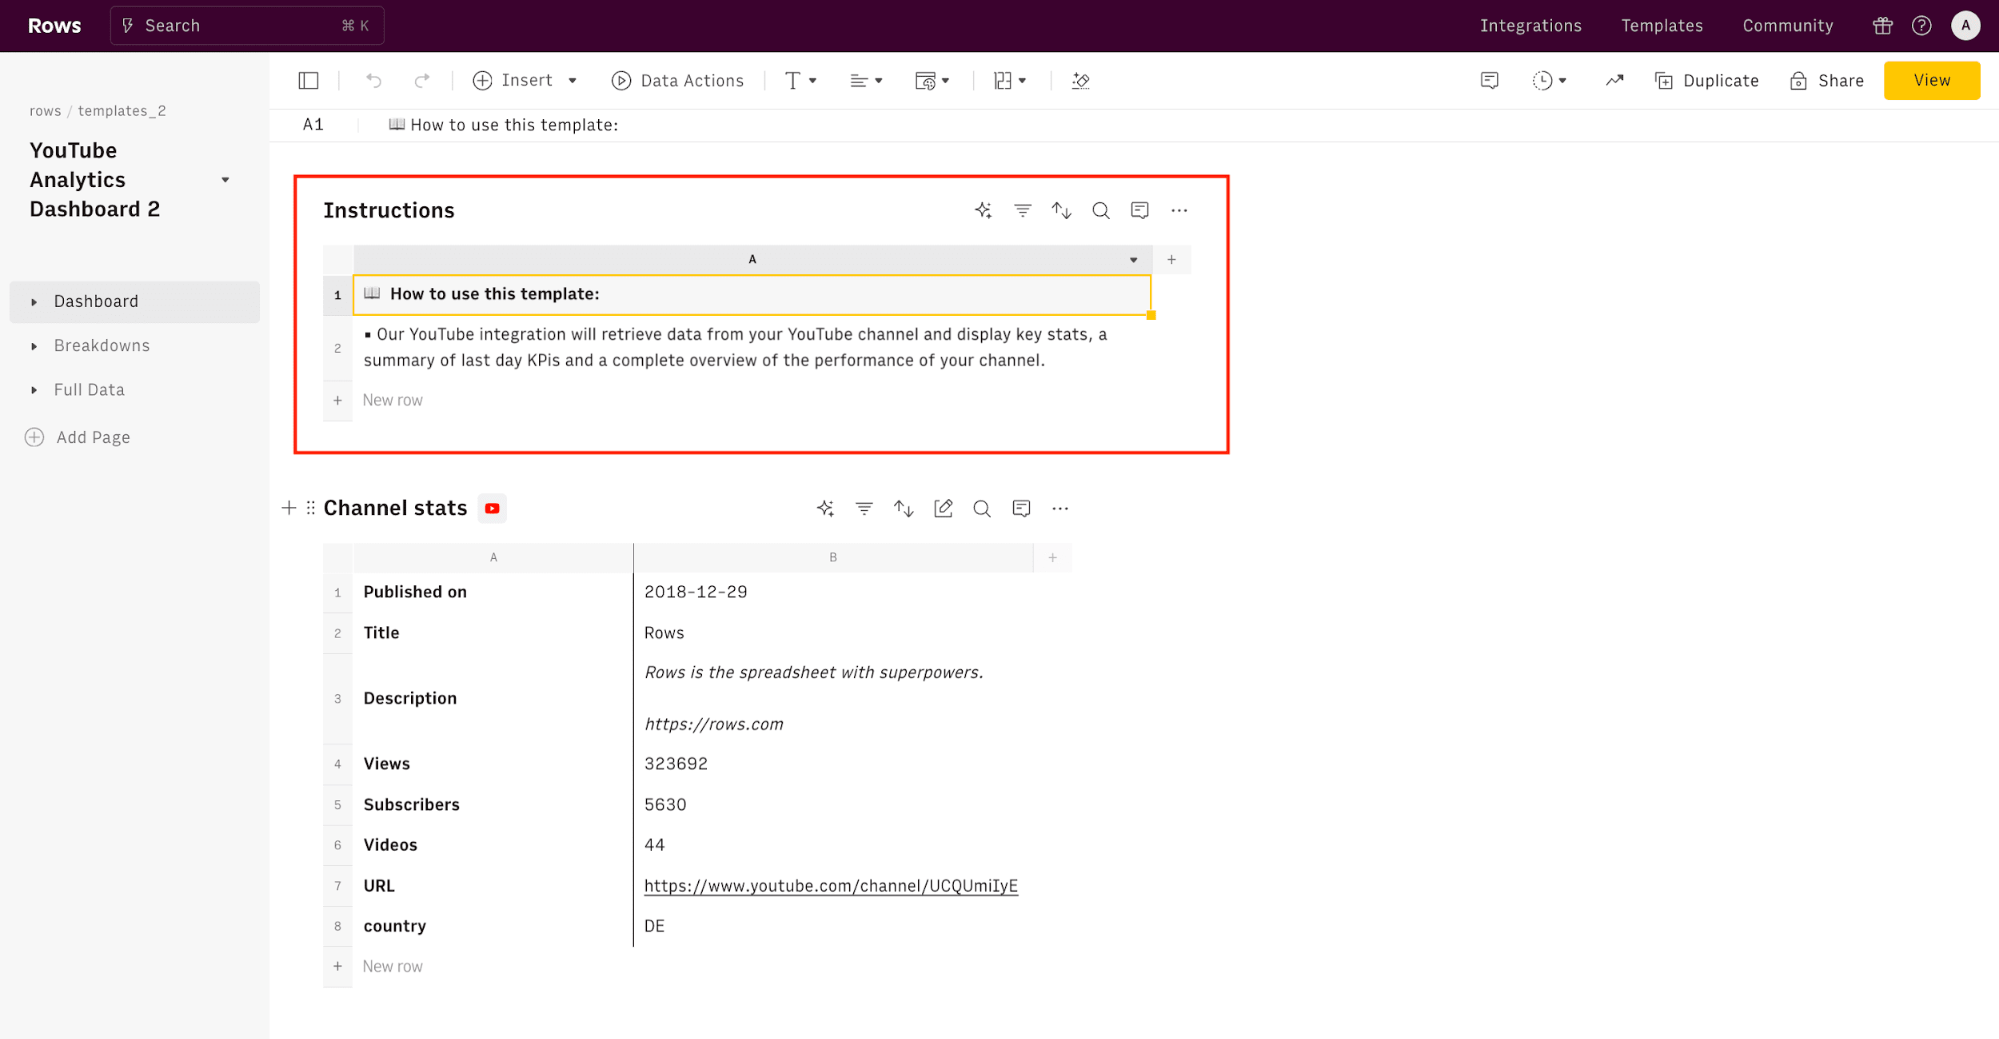
2. YouTube Analytics Dashboard
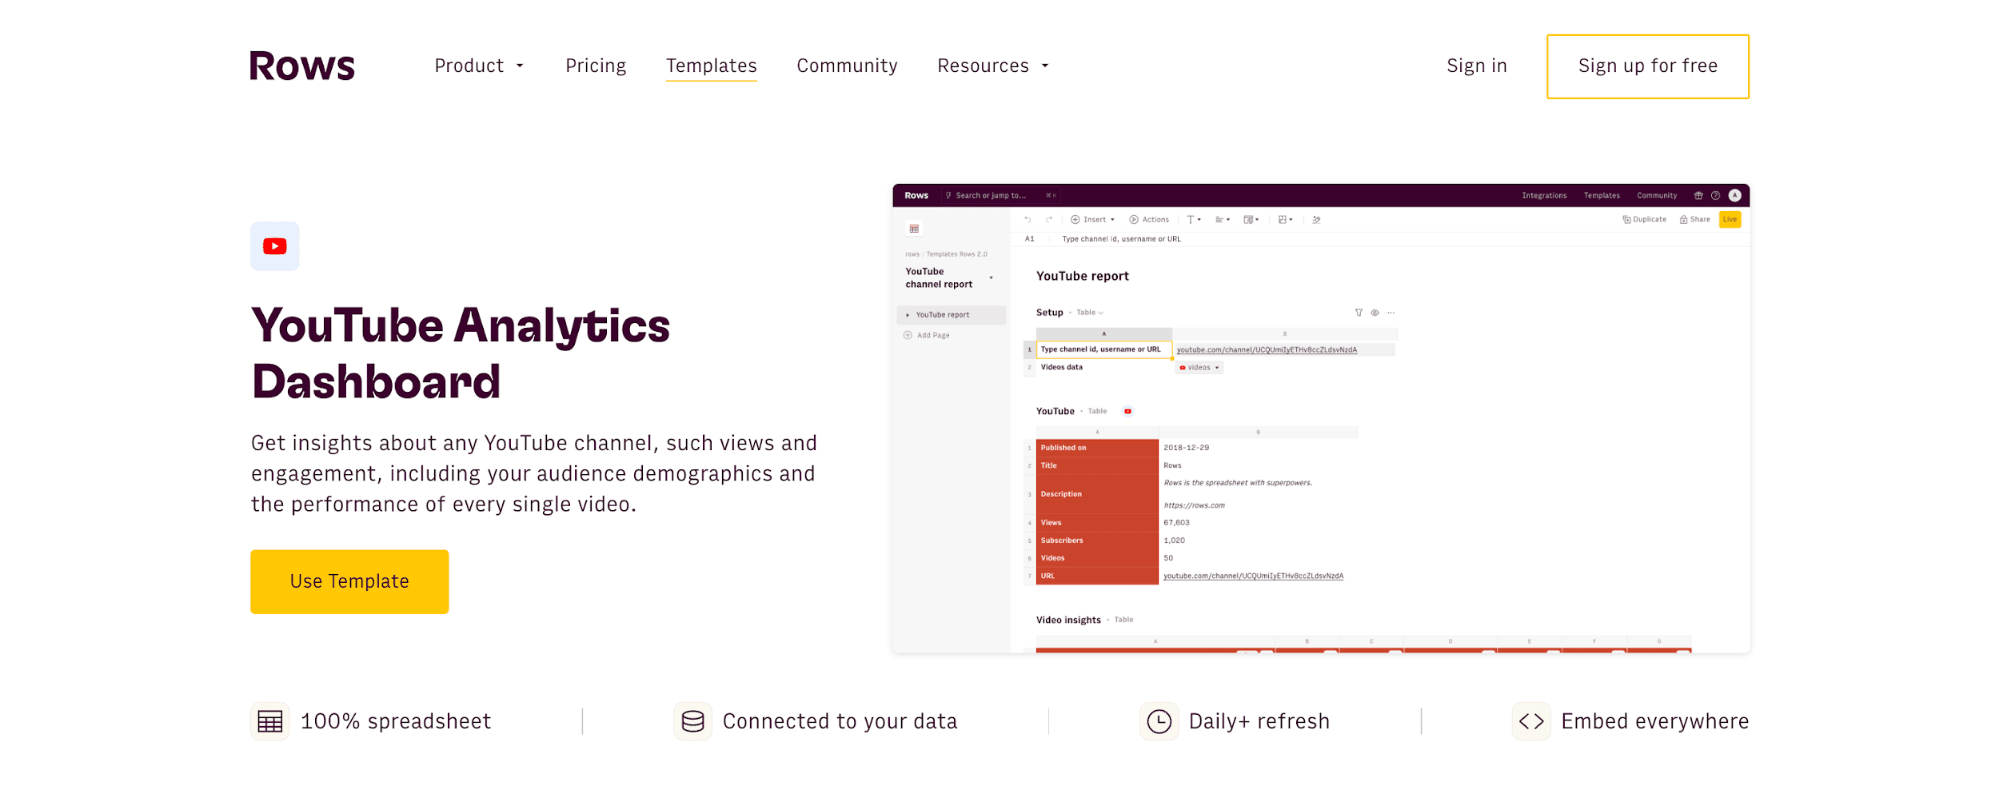
This dashboard visualizes insights about your YouTube channels, from views, engagement, and audience demographics to other key performance indicators.
All you have to do is click “Use Template.” Once you've done this, you'll see a tidy dashboard overview with an already prepared dashboard showing your channel stats. However, you must integrate your YouTube channel with Rows to use this template. Worry not; it's safe, as we have data regulations.
Try also our YouTube Subscriber Tracker
3. LinkedIn page analytics dashboard
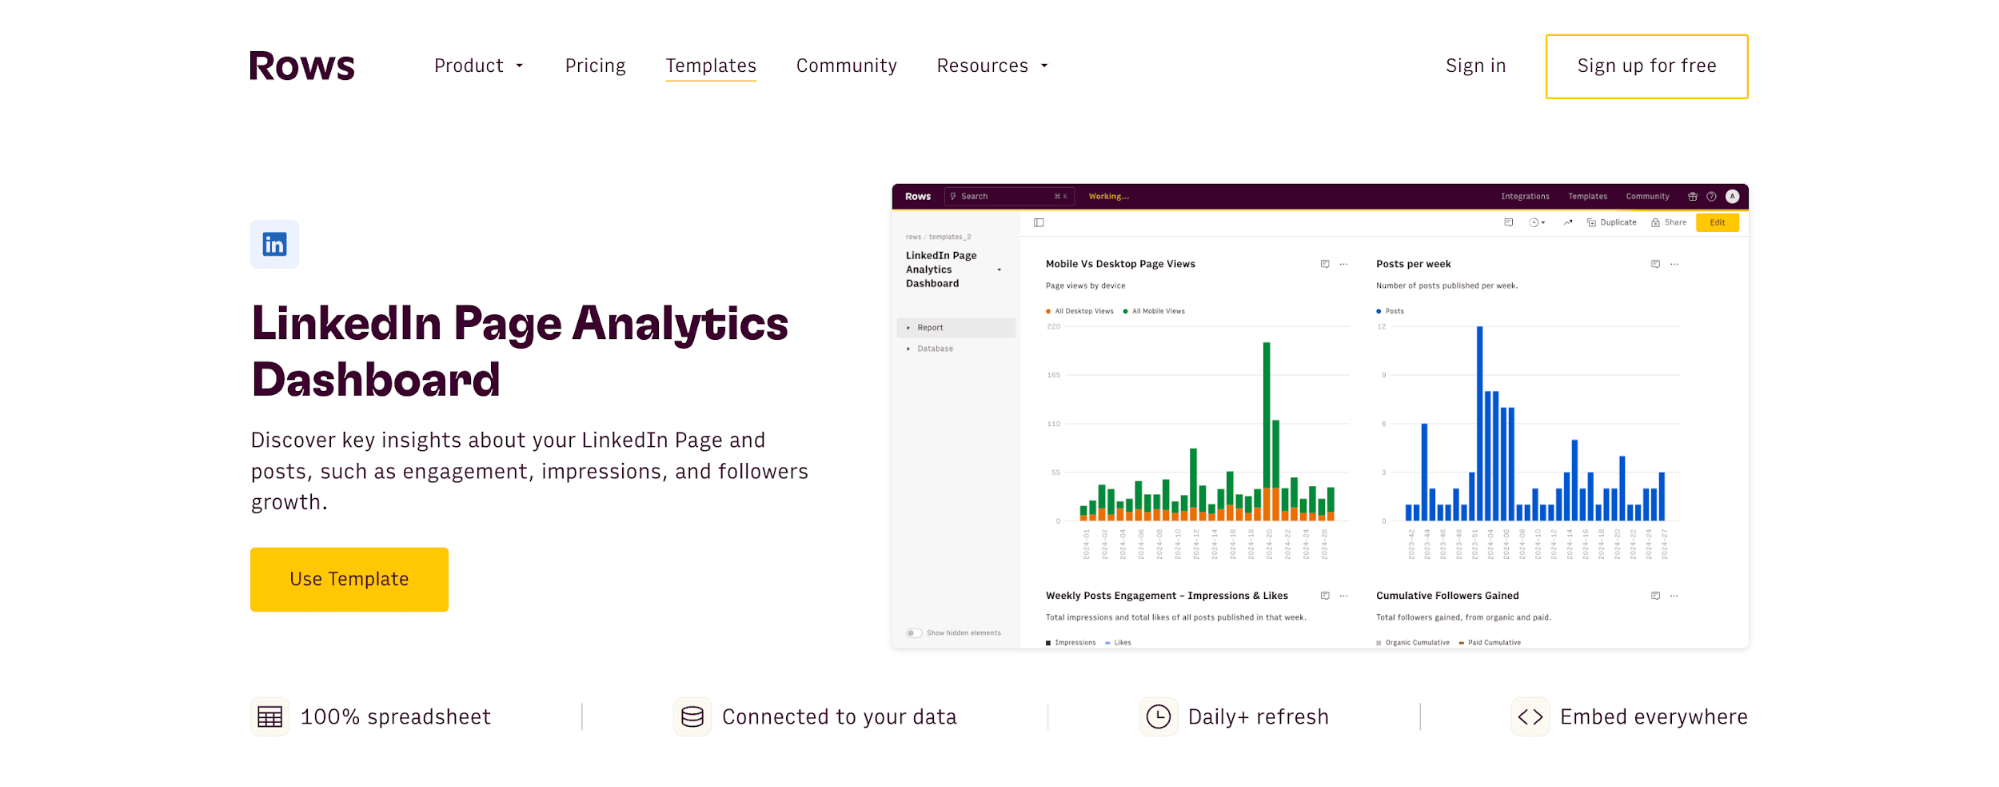
With the LinkedIn page analytics dashboard, you can get a bird's-eye view of your company's LinkedIn page's performance.
Are you active on other social media? Discover other social media dashboards:
You may also be interested in:
50 Free Marketing Templates You Can Use in 2026
20 Free Spreadsheet Templates for Google Sheets, Excel, and Rows in 2026
15 Best SEO Dashboard Templates in 2026
Your new AI Data Analyst
Extract from PDFs, import your business data, and analyze it using plain language.
Try Rows (no signup)Get Started with Rows
Creating multiple dashboards gets easier with Rows. With Rows.com, you can easily manipulate your data using our built-in AI analyst. And, of course, we offer you a variety of dashboard templates to meet your everyday business tasks.
Ready to get started with Rows.com? Start using the product right away for free.
FAQs about Google Sheets dashboard templates
Why should you use a Google Sheets dashboard template?
A well-crafted dashboard gives you a glimpse into the future of your business, research work, or personal work. What it does is simple — It spots trends before they become apparent and highlights issues before they blow up in your face.
What should be in a Google Sheets dashboard template?
A Google Sheets dashboard template must have visually appealing elements like charts, bars, graphs, or tables. It should also provide a range of key performance indicators, key data points, and other metrics specific to the template tile.
How do I create a Google Sheets dashboard?
The first step to creating a dashboard on Google Sheets is to prepare your data. After that, highlight your data and click “Insert”. Afterwards, look for “Chart” and click it. And Viola, you are good to go.
Want to learn the compressive step-by-step guide on creating a Google Sheets dashboard? Read this!