Google Analytics 4 Mobile vs Desktop Report
Find out how much of your site’s traffic comes from iPhones and Android devices versus from desktops and laptop computers—along with which web browser your audience uses and their screen size in a Google Analytics tech report.
 100% spreadsheet
 Connected to your data
 Daily+ refresh
 Embed everywhere
About Google Analytics 4 Mobile vs Desktop Report
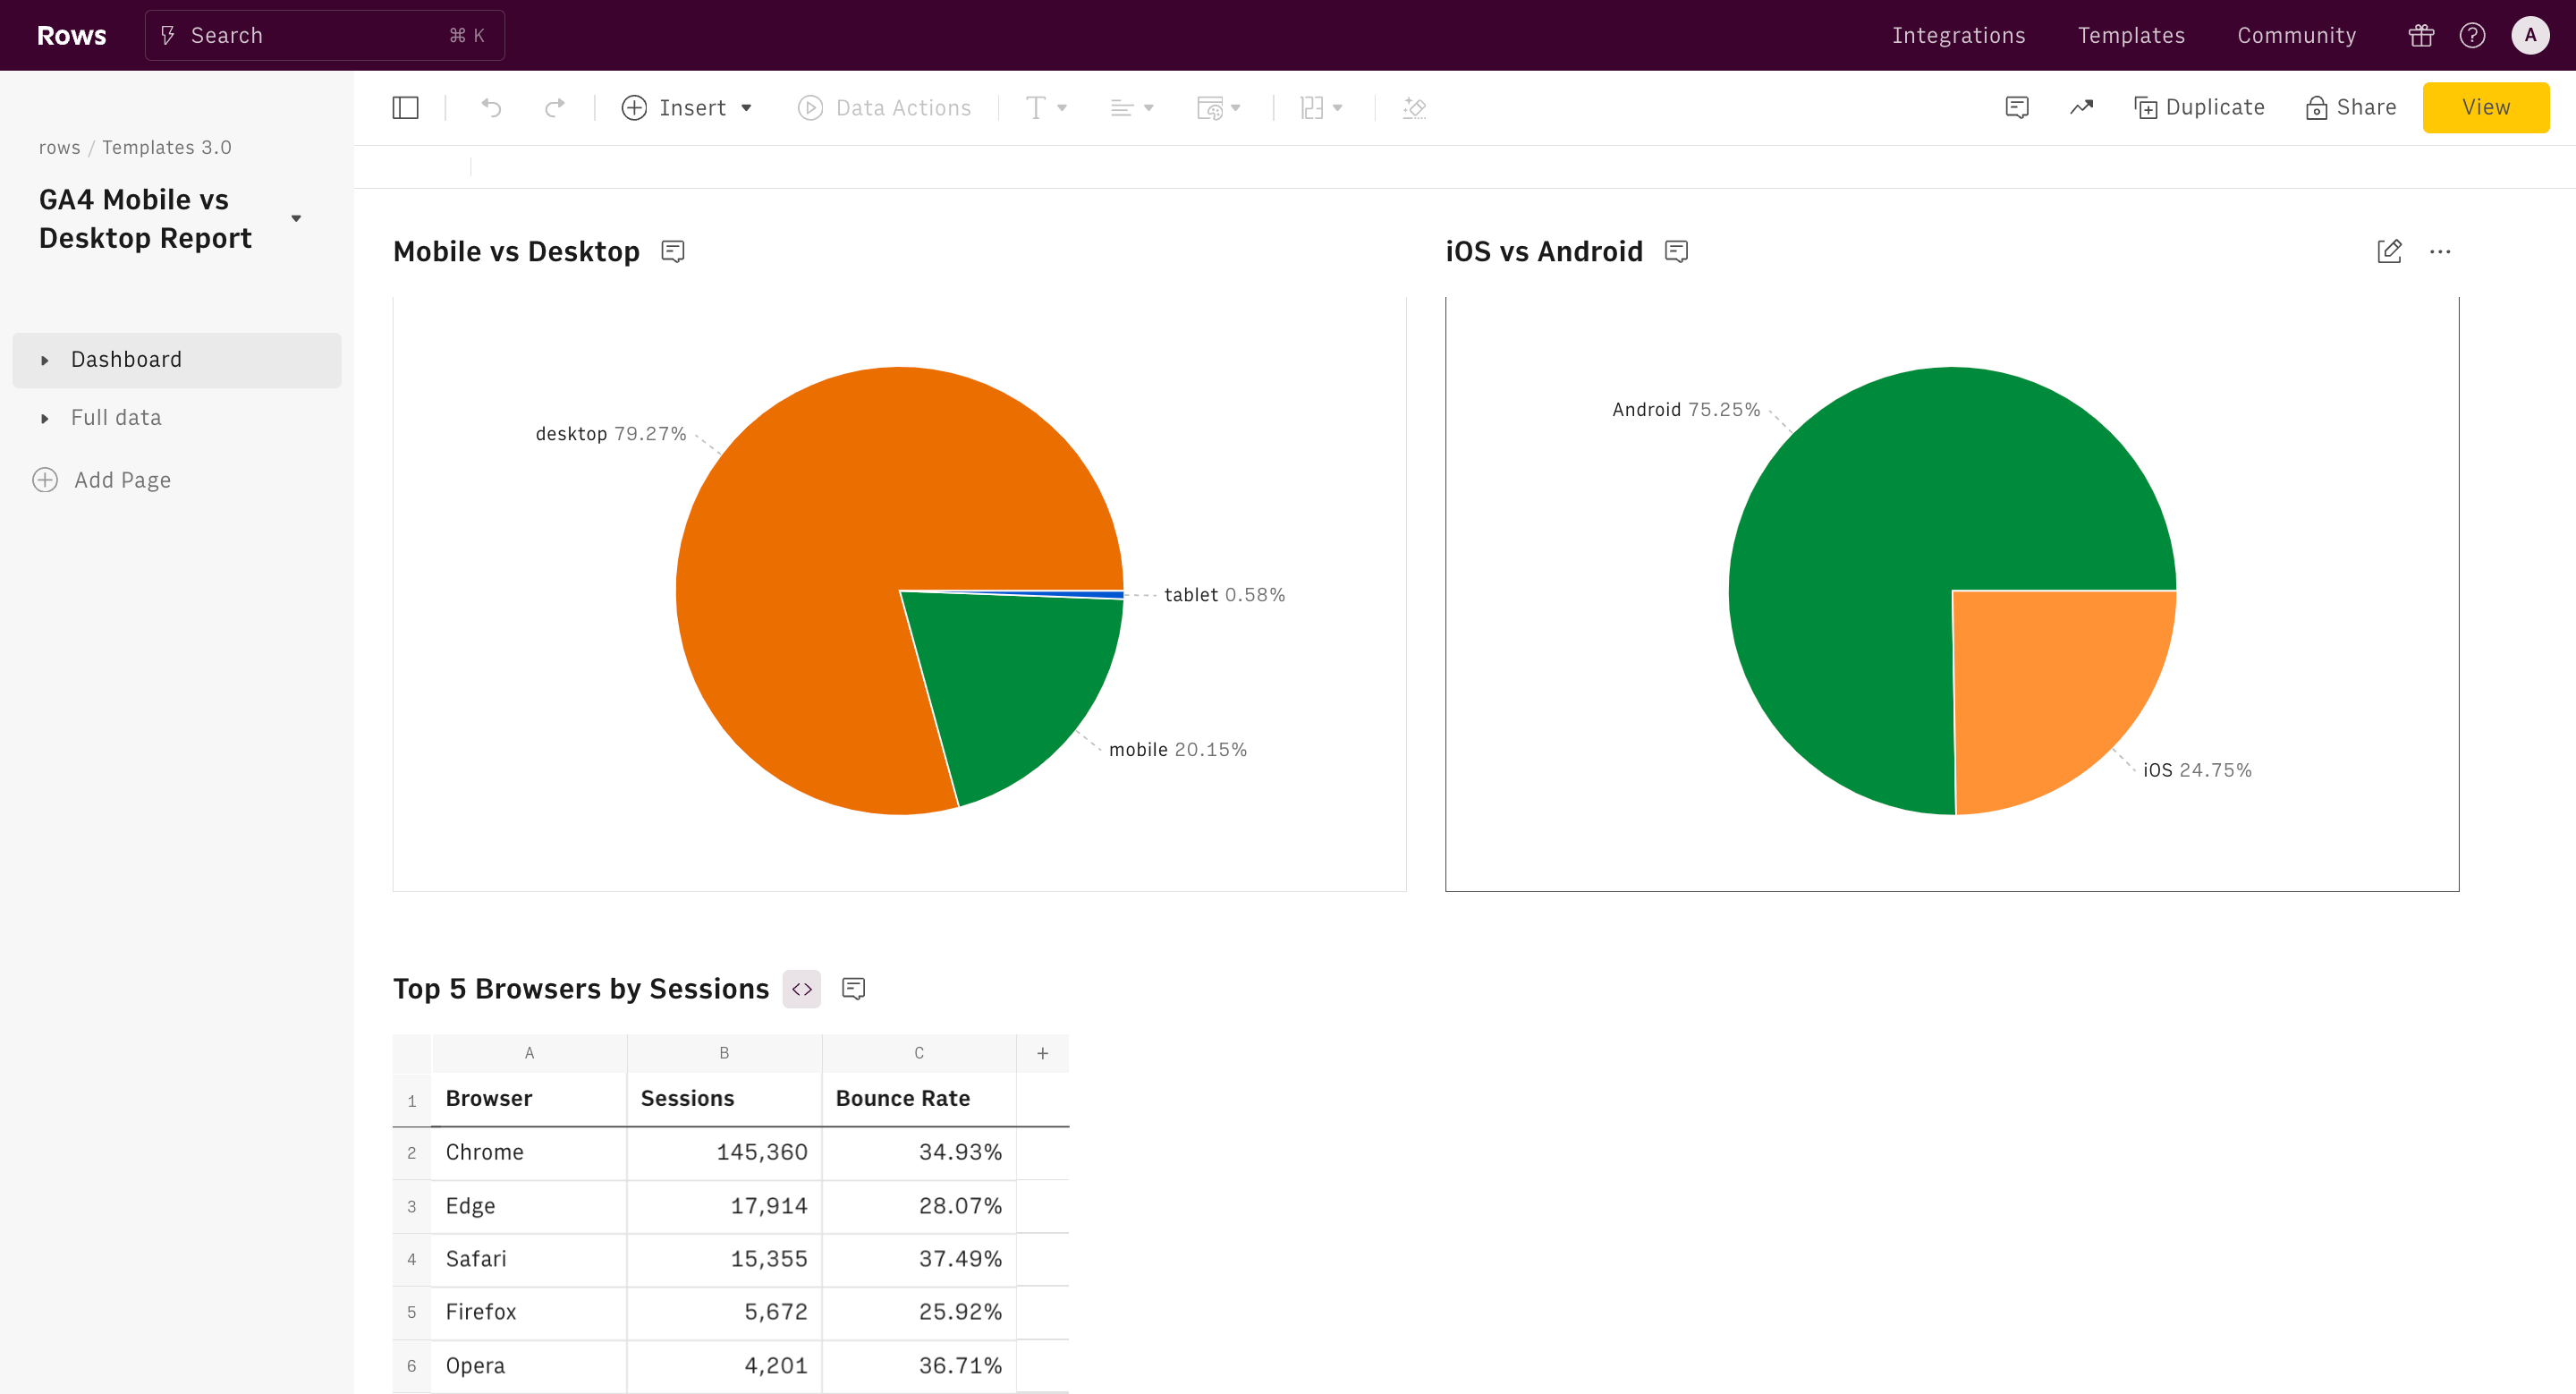
Do people browse your website, buy items from your eCommerce store, or read your blog posts on the go, or in the office? Google Analytics doesn’t tell you exactly where people view your site, but it does tell you which device they used to access it. That data tells you how to test your website—and helps you estimate how much time the average viewer will have to read your content.
Google Analytics 4 includes a default Tech overview report with details about which browser, OS, and device category was most used to view your site. To dig in, and see perhaps which phone browser most people use, or if more of your users browse from a large or smaller phone, you can either build a custom report with Google Analytics Explore tools or use this template to see more details about your site’s mobile versus desktop traffic.
With the data in hand, you can use the tech details to infer more about your site visitors. A larger percentage of mobile versus desktop users means people tend to view your site on the go. A higher Firefox or Linux user base might indicate a more tech savvy audience, while a higher percentage of users on the latest iPhone and Android devices could point to an early adopter crowd. Combine that with details about your site’s social traffic, referrers, and more to understand as much as possible about your audience.
How it works


How it works
Get started
Click on 'Use template' and start using it right away. No forms, no signup. Your data first.
Connect your Google Analytics 4 account
Once landed on the spreadsheet, follow the instructions to connect the required integration and pick your account.
Customize the template and schedule refresh
Once the integration has been connected, all tables will update automatically with your own data. Click on 'Edit Source' to change the retrieved data and automate the data refresh. You can then insert a chart or a pivot table, add a column or personalize formats, using all the regular functions and shortcuts that make spreadsheets great.
Embed tables and charts
Click on the option menu to embed tables and chart on your Notion, Confluence or any other iframe-ready documents.


Questions and answers
Can I use Rows for free?
More than a Google Analytics 4 Mobile vs Desktop Report
Rows is your new AI Data Analyst. It lets you extract from PDFs, import your business data, and analyze it using plain language.
Signup for free

Import your business data
Extract from PDFs and images, import from files, marketing tools, databases, APIs, and other 3rd-party connectors.
Know moreAnalyze it with AI
Ask AI✨ any question about your dataset - from VLOOKUPs to forecasting models - and surface key insights, trends, and patterns.
Know moreCollaborate and Share
Seamlessly collaborate and share stunning reports with dynamic charts, embed options, and easy export features.
Know more