20 Free Spreadsheet Templates for Google Sheets, Excel, and Rows in 2026 (Jan update)

Spreadsheet templates transform how you handle data in your company, help you save time, increase productivity, and organize key projects — All these to save your business from missing out on deadlines, revenue decline, and poor reporting.
If you’re reading this, you’re probably a project manager, business executive, or team lead who is hurrying to put together different data sources and gather informed insights.
Whether you use Google Sheets, Excel, or Rows, the right spreadsheet template can make all the difference.
In this guide, we’ve curated 20 free spreadsheets templates — categorized by Rows templates, Google Sheets templates, and free Excel templates — designed to meet various needs, from budgeting to project management templates. And guess what? We aren't leaving you in the dark — you'll get access to each template's direct download links and props.
Top 10 Free Spreadsheet Templates for Rows
Rows is your new AI Data Analyst. It combines the backbone of a spreadsheet with the power of ChatGPT to to give business people full autonomy over their data. Just ask in plain language and Rows will handle the rest, whether that's spreadsheet operations, data import or transformations, or running Python code to do code-level analyses.
It’s the new way teams at HP, AWS or Taxfix aggregate data, make sense of it and speed up decision processes.
At Rows, we don't just create mere spreadsheet templates. We create customizable spreadsheet templates powered to give results based on stand-out features in the modern-day context.
Apart from the obvious features like availability of functions and formulas, good charts, and format compatibility — there are three other distinguishing features to consider when choosing spreadsheets in today’s context — and you can find these distinguishing features in Rows templates:
Feature 1. AI copilot
Rows AI Analyst turns your spreadsheet into something closer to a data science environment. You describe what you want in plain language, and it handles the execution, whether that's spreadsheet operations, data transformations, or running Python code to do the heavy lifting.
It works across four key capabilities:
Spreadsheet-native operations
Standard spreadsheet tasks—pivots, conditional formatting, new columns, charts—happen through conversation instead of clicking through menus or writing formulas.
Example prompts:
→ "Build a pie chart showing share of profit by product"
→ "Add conditional formatting rule to column D: red if <100, yellow if <150 and green if >150"
Data Ingestion
Pull data directly from PDFs, images, or connected tools without manual copying and pasting.
Example prompts
→ "Import all transactions from my N26 account and classify them as: marketing, software, travel, other"
→ "Pull keyword data from the last 90 days from Google Search Console"
Multi-step plans
String together multiple dependent steps—build a dashboard, create a calculator from scratch, or execute a series of operations where each step builds on the last.
Example prompts:
→ "Add a column classifying keyword position into brackets: [1-3], [4-10], [10+], then create a pivot showing average CTR by bracket"
→ "Build a simple dashboard showing the performance of sales people in the last quarter"
Code-level analysis
When you need statistical analysis, machine learning, or custom visualizations that go beyond standard charts, the AI Analyst can write and execute Python code to get there.
Example prompts:
→ "How does my revenue change if my margin increases by 5%?" (what-if analysis)
→ "How many orders do I need to hit $100k, $500k, and $1M in revenue?" (goal-seek)
→ "Calculate correlation between keyword position and clicks, then show statistical significance"
→ "Run a k-means clustering model to segment customers by purchase behavior and visualize the clusters"
→ "Create a Sankey diagram showing traffic flow from source → landing page → conversion"
Instead of switching between tools or learning specialized syntax, you describe the analysis you want and the AI Analyst figures out how to execute it: it scans your dataset, understands the key variables, and provides what you need.
To access AI in Rows you can either
click on the ✨ icon, at the bottom right corner of your viewport: this will open a chat UI panel that will work across your spreadsheet. You can ask questions in two modes, Build or Chat, based on whether you want to actually creating elements or just have in-line answers.
use the ✨ icon at the top right corner of each element: a contextual menu with a few shortcut will open right away allowing you to perform quick actions like summarizing the content or beautify a table
See a side-by-side comparison of a price sensitivity analysis in Rows vs. Google Sheets:
Feature 2. Data Integrations
Rows gives you 50+ data integrations that you can leverage to import and export live data seamlessly into/from the spreadsheet and set up automated data refresh.
Unlike Google Sheets, this requires no plugin; it’s a built-in native feature, and can be used also with plain language, as mentioned above.
Example of prompts:
SEO data: "
Pull page data from the last 30 days from Google Search Console, including only pages that contain /blog/"Finance data: "
Pull all transactions from my HSBC account and classify them into: software, marketing, travel expenses, revenue"Marketing data: "
Use GA4 data to rank the top sources of traffic from mobile in Brazil in the last 30 days"
Curious how Rows can do this? It handles JSONs in the grid and converts them into table format.
Here are a few examples of how to pull data from third party tools via AI in Rows:
And whenever the tool you want to retrieve data from is not in their catalog, Rows gets you covered. Thanks to the custom HTTP source, you can send GET, POST, PUT, and PATCH requests to any endpoint using basic or API token authentication methods.
You feel ready to try it yourself?
💡 Try to make a GET request yourself with our HTTP Request Tester: input the endpoint, the headers and params and visualize the content of the response in a cell.
Or watch the demo below:
Looking for an head start to test Rows integrations? Have a look to our gallery of templates, including our recent Google Analytics reports and OpenAI testers.
Feature 3. PDF/Image extraction
As mentioned above, Rows can ingest data directly from documents and images—not just as static imports, but as structured, editable tables.
It works with PDFs and multiple image formats (JPEG, PNG, HEIC...)
You can process batches at once rather than uploading files one by one.
All extracted data can get merged into a single table you can immediately work with, stay on separate tables or get appended to an existing one.
You can also add custom extraction instructions to pull exactly what you need. A very common use case is invoices management. By adding the prompt
"Extract date, vendor name, VAT amount, total amount, and description", Rowswill scan all documents and return a consolidated table with those specific fields—no manual data entry, no error, or formatting issues
Instructions can be enhanced automatically and saved for later. Watch the demo below:
Feature 4. A delightful layout
Rows layout lets you build elegant dashboards that are great to share. See an example of our investor dashboard (numbers are dummy).
Plus, you can embed tables and charts on a website, wiki, or other internal tools with ease.
It’s a simple 4 step process:
Choose Embed in the settings menu located in the right-hand corner of the element you want to embed.
Click the Share Privately toggle.
Click <> Copy code. You can use the Copy link to paste directly into tools that automatically embed via the link - e.g., Notion.
Paste the embed code on your website, wiki, or destination tool.
Learn how to use Embed in all the most recent documentation tools, like Notion, Confluence, and Slite.
Fan of Notion? Discover other embed use cases: how to create a chart in Notion and how to import a spreadsheet in Notion.

100+ templates to level up your reporting game
Rows is connected to your business data, powered by AI and delightful to share.
Explore TemplatesHaving known about these key features, let's dive straight into the best 10 Rows templates — ranging:
1. Facebook followers growth tracking template
Do you know that your follower count on your Facebook dashboard is not all there is? Say you hit a 10k followers milestone in early January of this year — fast forward to this current month, and your follower count still reads 10k despite getting lots of followers.
Why is this so? Facebook rounds numbers for accounts with over 10,000 followers. So, how do you track the number of followers that have followed you to date?
Simple answer, Facebook follower growth template.
With this customizable template, you can access the record of the follower count of one or more Instagram accounts over a particular period.
To use this template, you have to configure your Facebook account to Rows integration and access all the valuable insights you need to know
Additionally, this tool can be leveraged to check Facebook followers of competitor pages, providing critical insights into their social media strategies and helping you stay competitive in your market niche.
➡️ Click to use this template now!
2. Instagram followers growth template
An Instagram follower tracker is a tool that automatically monitors and records the follower count of one or more Instagram accounts over a particular period. It is simply used to count your Instagram followers.
Additionally, this tracker lets you know if you are leading the pack or playing catch-up. With competitors' followers analysis, you can get an accurate picture of your niche playground — you get to know how your competitors are fairing with the Instagram algorithm
Note that the tracker doesn't help you create, schedule, or post Instagram content. It only helps you understand the impact of your posts and content strategy on follower growth. An Instagram follower tracker doesn't increase your followers — It merely monitors and reports on your follower count.
➡️ Click to use this template now!
3. TikTok follower counter template
TikTok Follower Counter is designed to provide daily updates on your follower count, helping you track your account's growth effortlessly and log your TikTok follower count history in a simple spreadsheet table.
With our TikTok follower counter template, you don't need to check your follower count daily manually. We do it for you. All we need to do is connect your TikTok account with just a few clicks.
At the heart of the social media space, TikTok is a top channel for viral content. On average, TikTok videos reach their viewership peak two weeks after being posted — So, If your video goes viral, our tracking template shows you how quickly your followers and hearts increase.
➡️ Click to use this template now!
4. YouTube Channel Subscriber tracking template
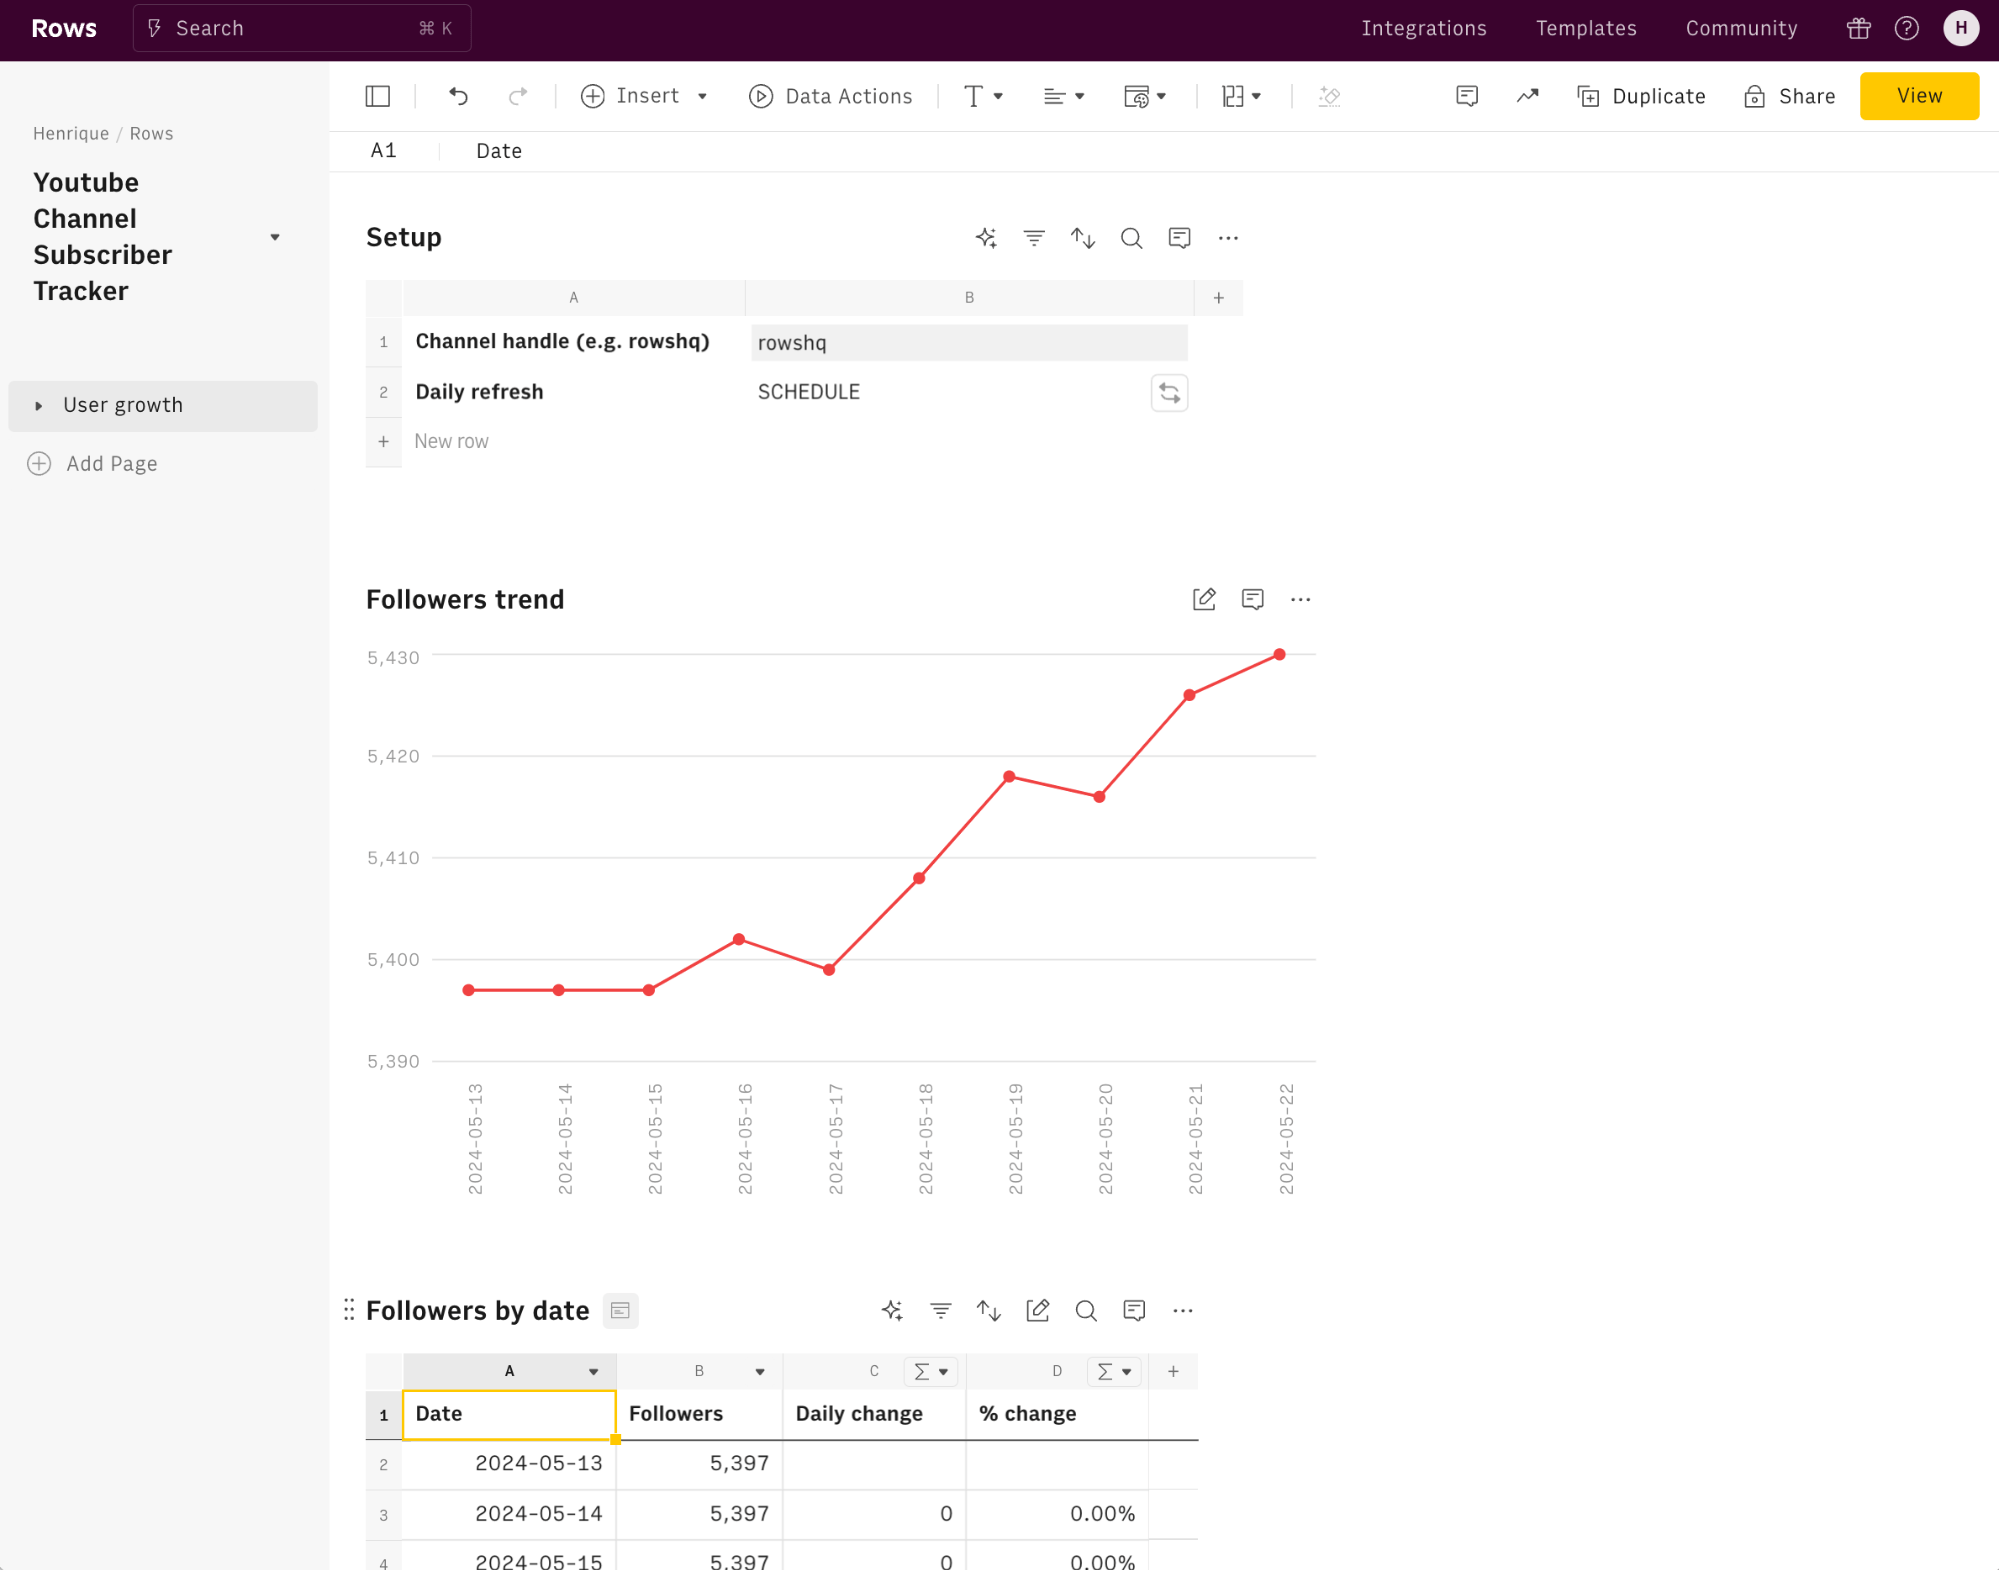
This spreadsheet template tracks your YouTube channel subscriber growth over time automatically.
On the YouTube platform, you can see the number of subscribers you have on your channel, but tracking its growth over time is not easy. This is why many people end up recording the number manually every day.
Additionally, tracking subscriber rates is important for monetization — As your subscriber base grows, you unlock various monetization features, such as joining the YouTube Partner Program, which requires a minimum of 1,000 subscribers and 4,000 watch hours over the past year. This program enables you to earn revenue through ads, channel memberships, and merchandise shelf integrations.
➡️ Click to use this template now!
5. Google Search Console Performance Report
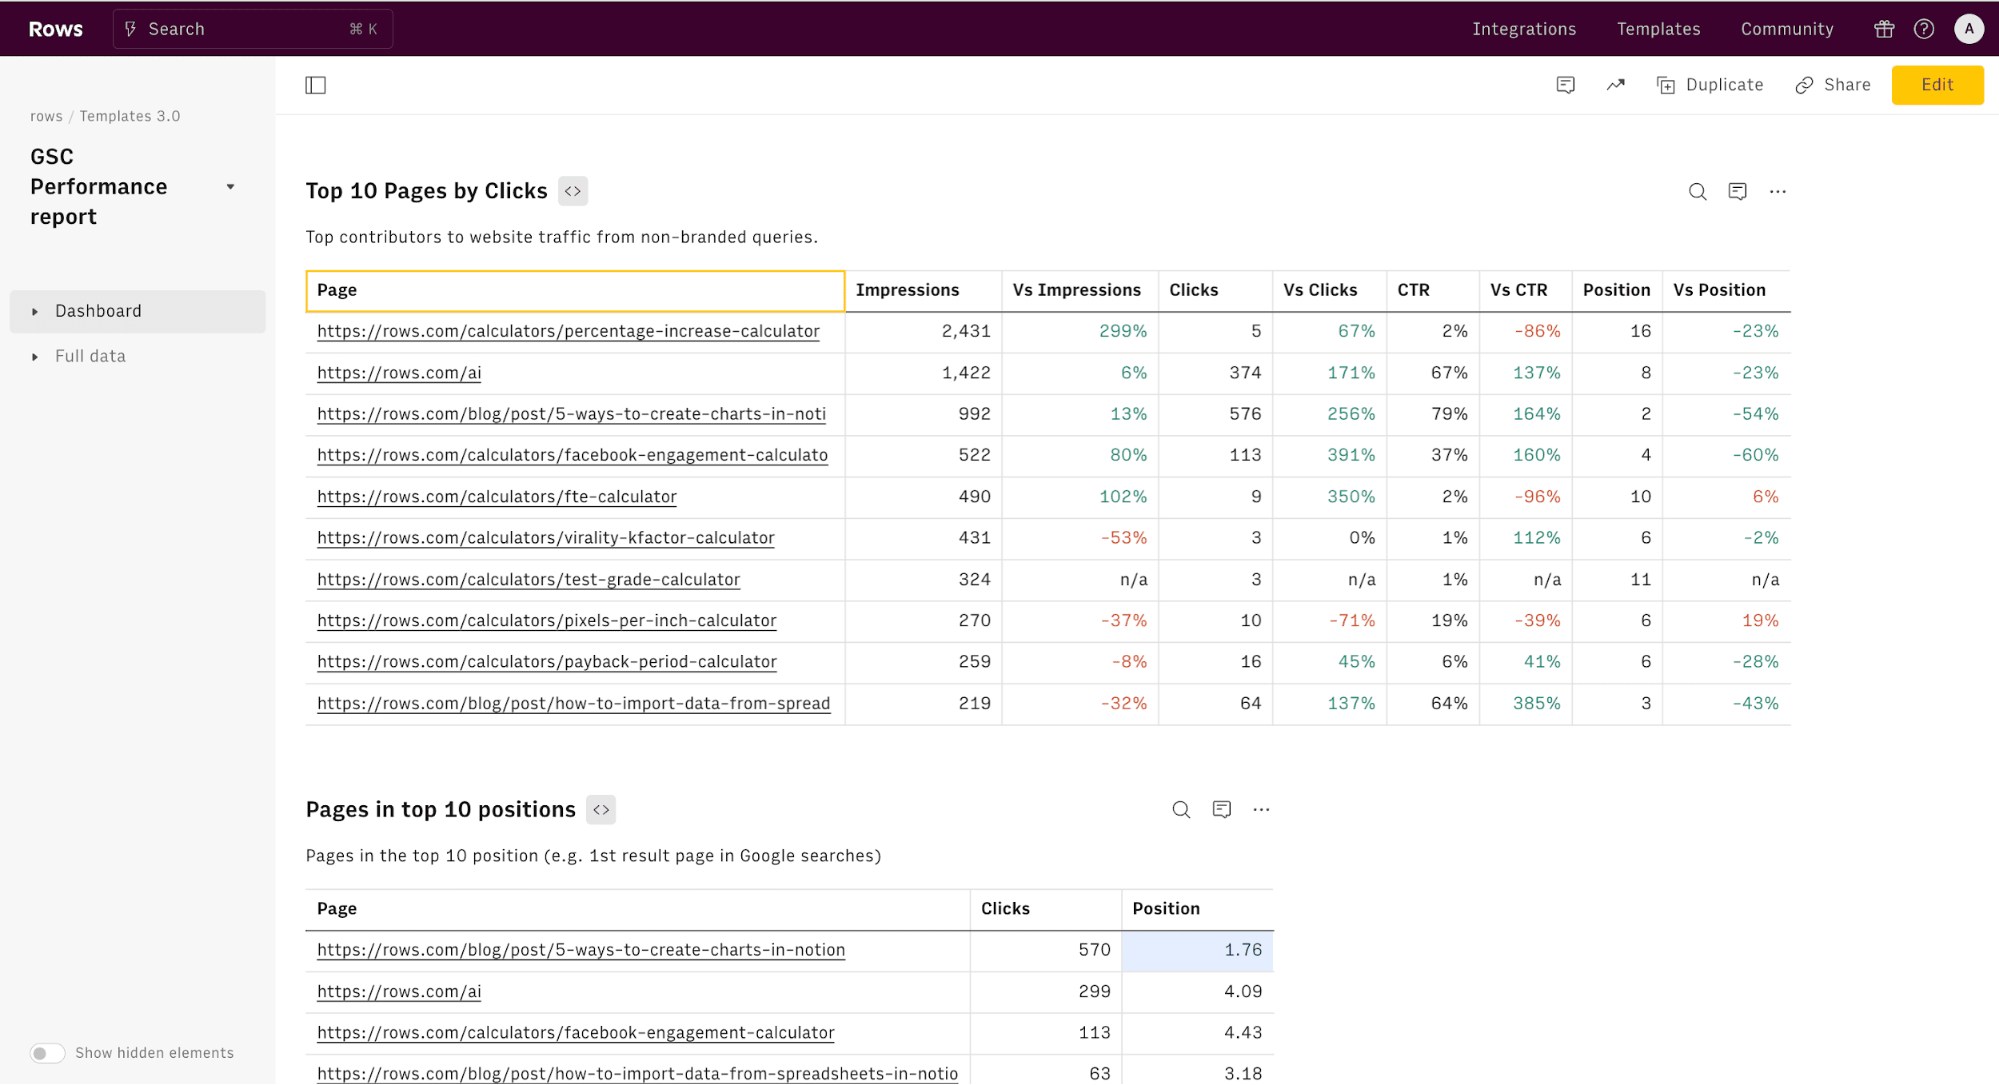
This template uses the Google Search Console (GSC) API to let you monitor the search performance of your website’s organic traffic and search ranking in the result pages of the world-leading search engine directly on a spreadsheet.
Without deep diving into your website's Google Search Console performance metrics, you'll be unable to find top-performing and least effective pages.
But with this template, you don't just find top-performing pages, you also find them based on average position over time, device, country, and search appearance breakdown of your search traffic
This spreadsheet template aims to help you gather actionable and valuable insights for your SEO strategy through data from GSC
➡️ Click to use this template now!
6. Google Search Console Keyword Cannibalization Checker
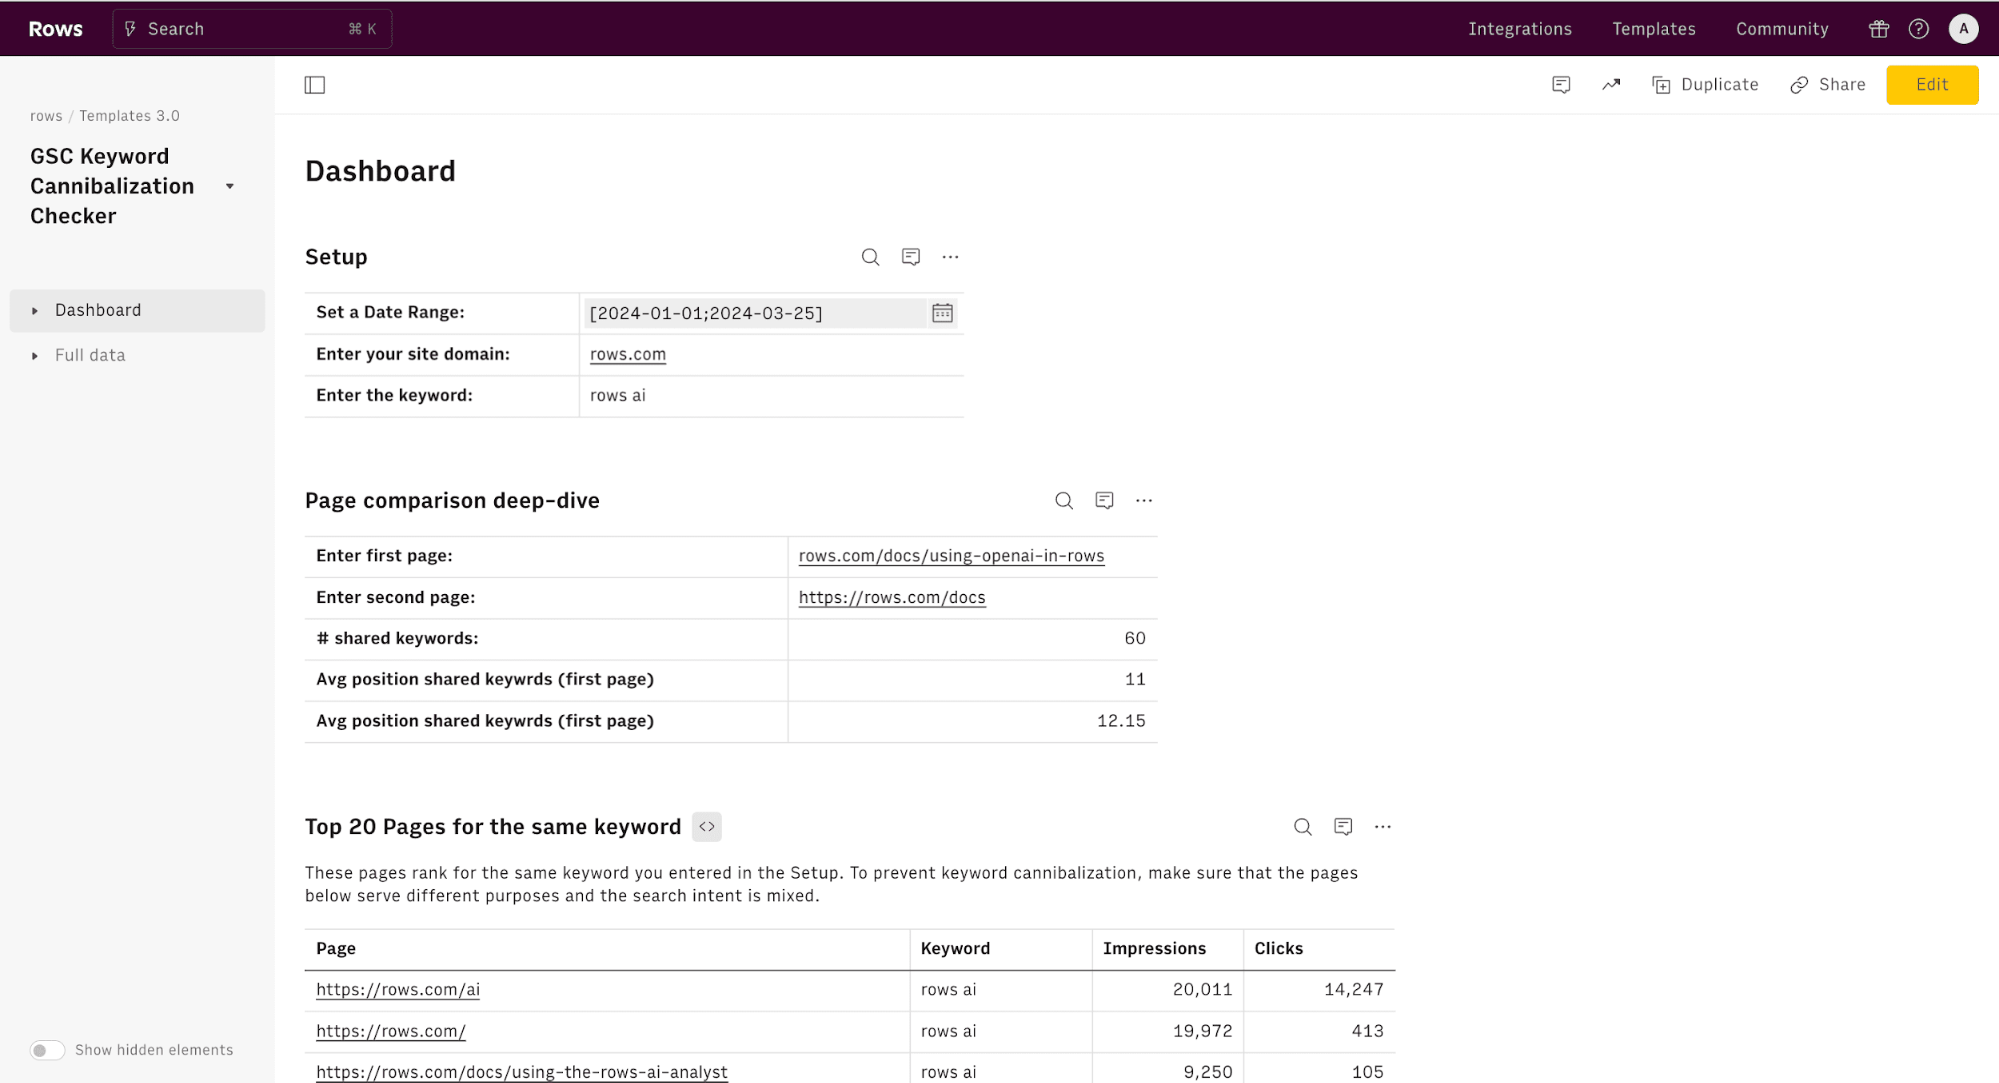
Keyword cannibalization occurs when different pages on a website compete for similar keywords in search engine rankings.
Keyword cannibalization can impact your organic traffic, affect user experience (UX) and conversion rates, confuse search engines
This means you must always check if your site suffers from keyword cannibalization issues, with pages that serve the same purposes and rank for identical target keyword(s) with the same search intent.
And that's what this Google Search Console Keyword Cannibalization Checker template does. It is a powerful tool that uses insights from the Google Search Console API to investigate instances of keyword cannibalization, spotting different pages competing for the same keywords.
All you need to do is input a keyword and see all the pages of your website that rank for that specific query. Going through the list allows you to spot relevant pages that may represent a conflict.
➡️ Click to use this template now!
7. Keyword ranking report template
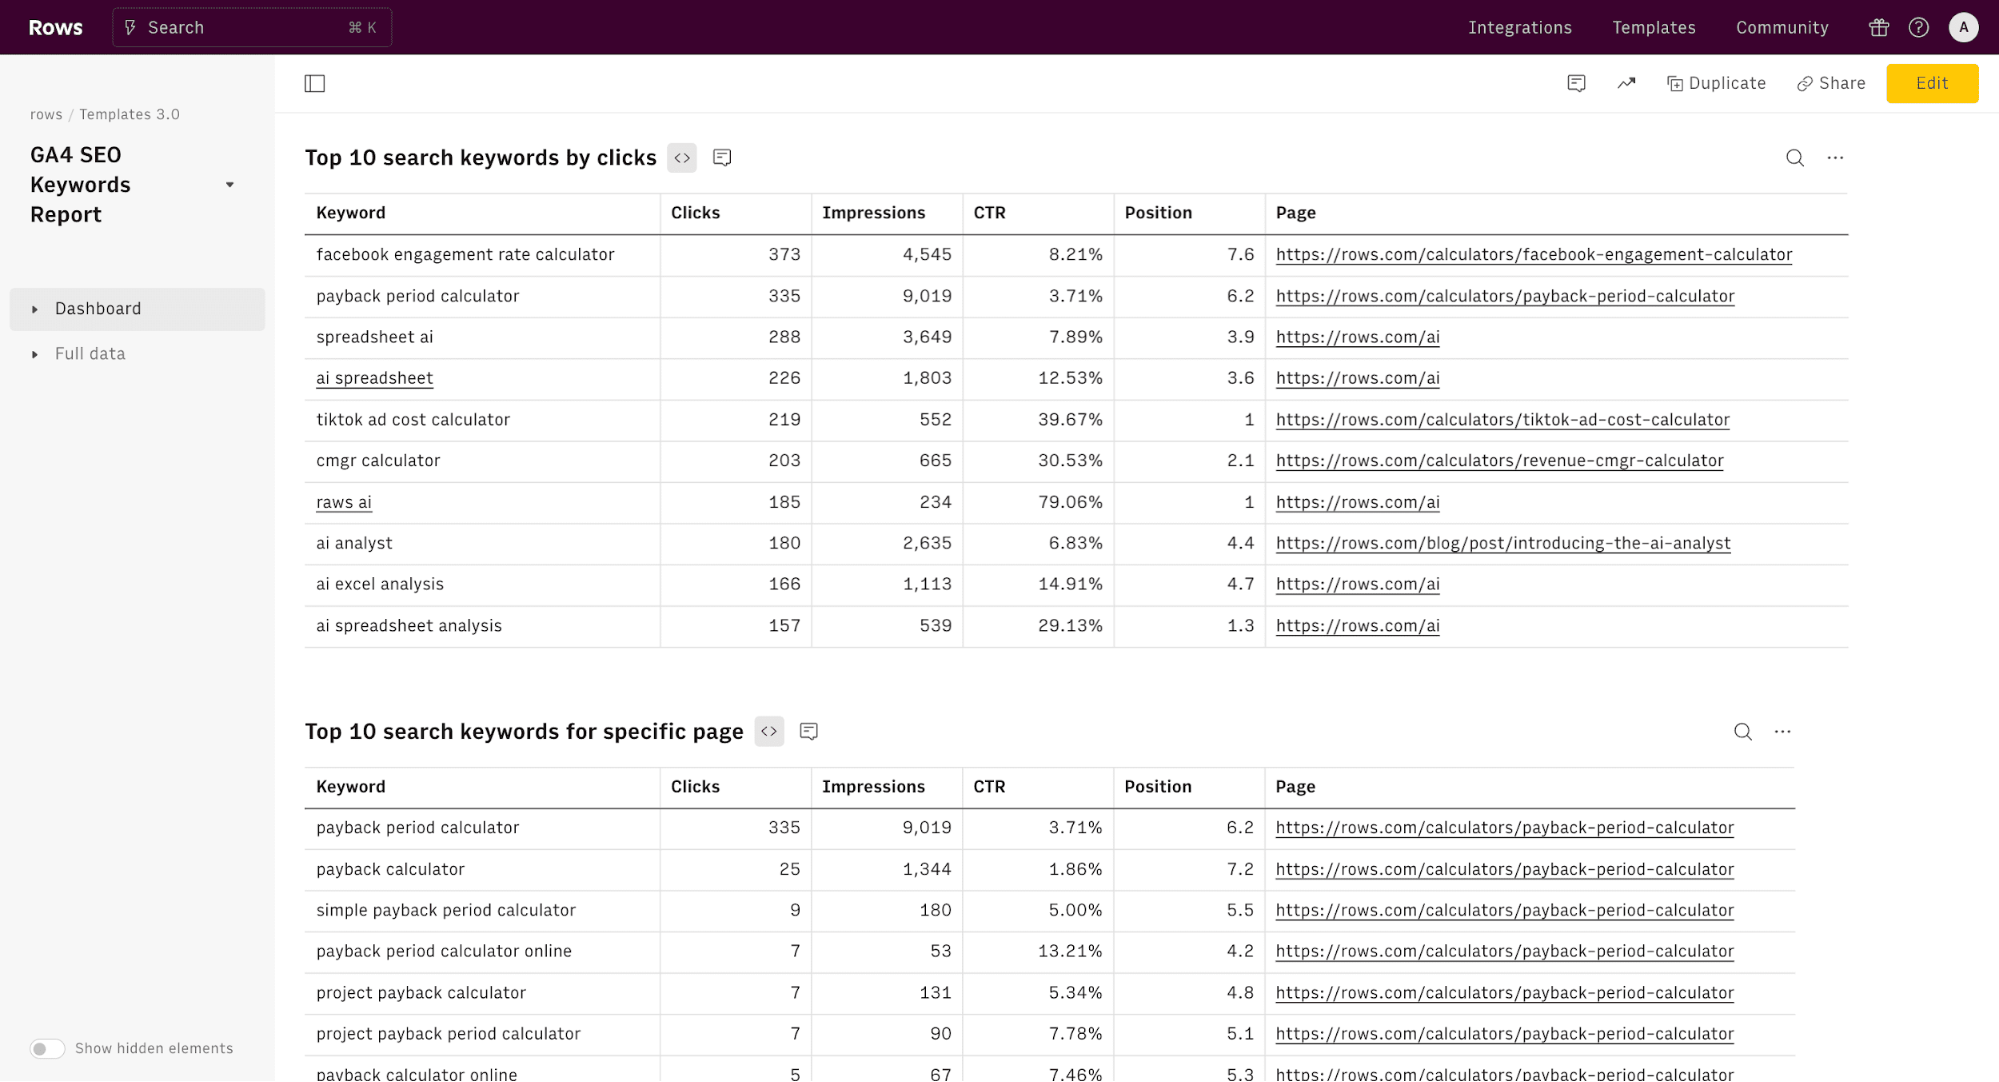
The GA4 SEO keywords report spreadsheet is used to find the highest-ranking keywords on your website.
This spreadsheet template makes use of live data from GSC and GA4 accounts. When you connect your accounts to Rows, this report template automatically drafts insights about your web pages from these live data sources.
This SEO keyword ranking report template lets you identify high-potential keywords on your current pages. This way, you can improve on-page SEO to boost rankings for valuable search terms.
Additionally, you can group keywords by user intent and topic to gain insights into different segments of your target audience, informing buyer persona development and content strategy.
What's more? You can analyze which keywords trigger specific SERP features (like featured snippets or People Also Ask boxes) to optimize your content for these high-visibility placements.
➡️ Click to use this template now!
8. Google Ads report
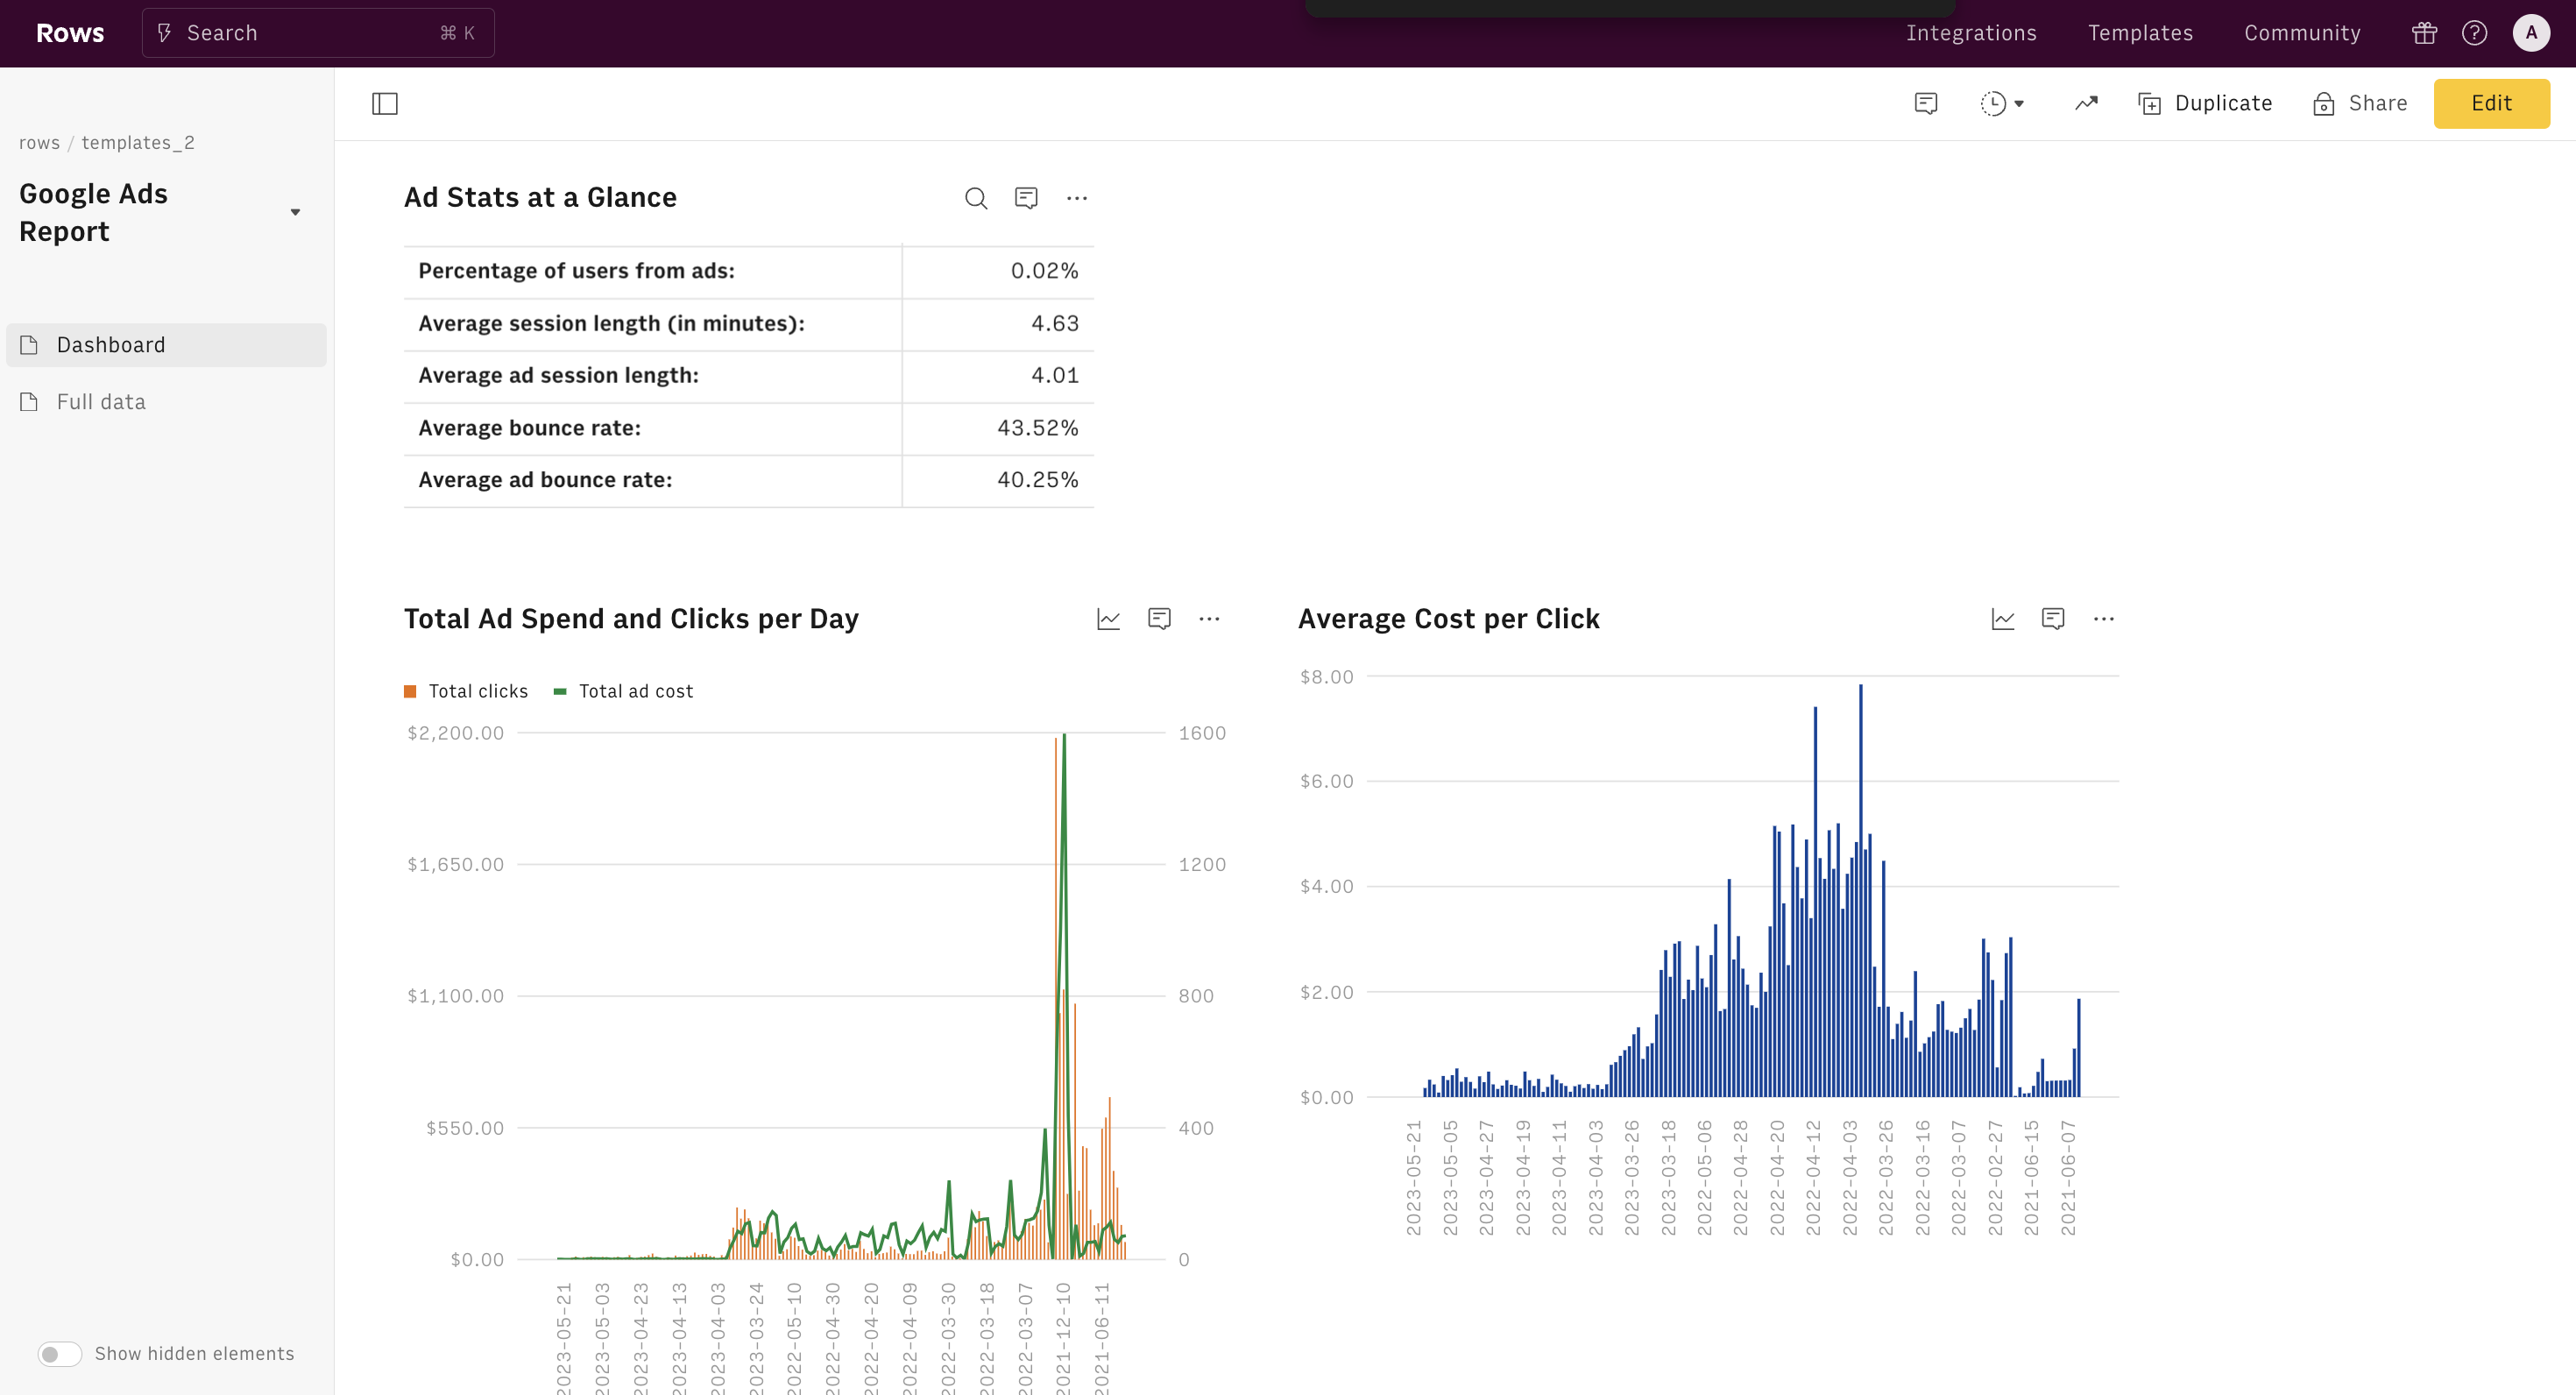
Spreadsheet reporting becomes essential when it's time to check the performance of your advertising campaigns. And that's where PPC reporting templates come in — With this Google Ads PPC template, you’ll get a detailed breakdown of; your paid Google Ads keywords, the search terms that led visitors to click on your ads, and your total ad spend and average cost per click over the most recent time period you want to check. It’s the quickest way to keep track of everything about your site’s paid search.
This spreadsheet report template takes the complexity of your campaign data and presents it in a digestible, easy-to-read format. No more jumping around Google Analytics 4 trying to piece the puzzle together. You get the critical metrics—clicks, cost-per-click, conversions—right before you. It’s like getting a summary of a long book, but without losing the story.
➡️ Click to use this template now!
9. Facebook ads campaign report
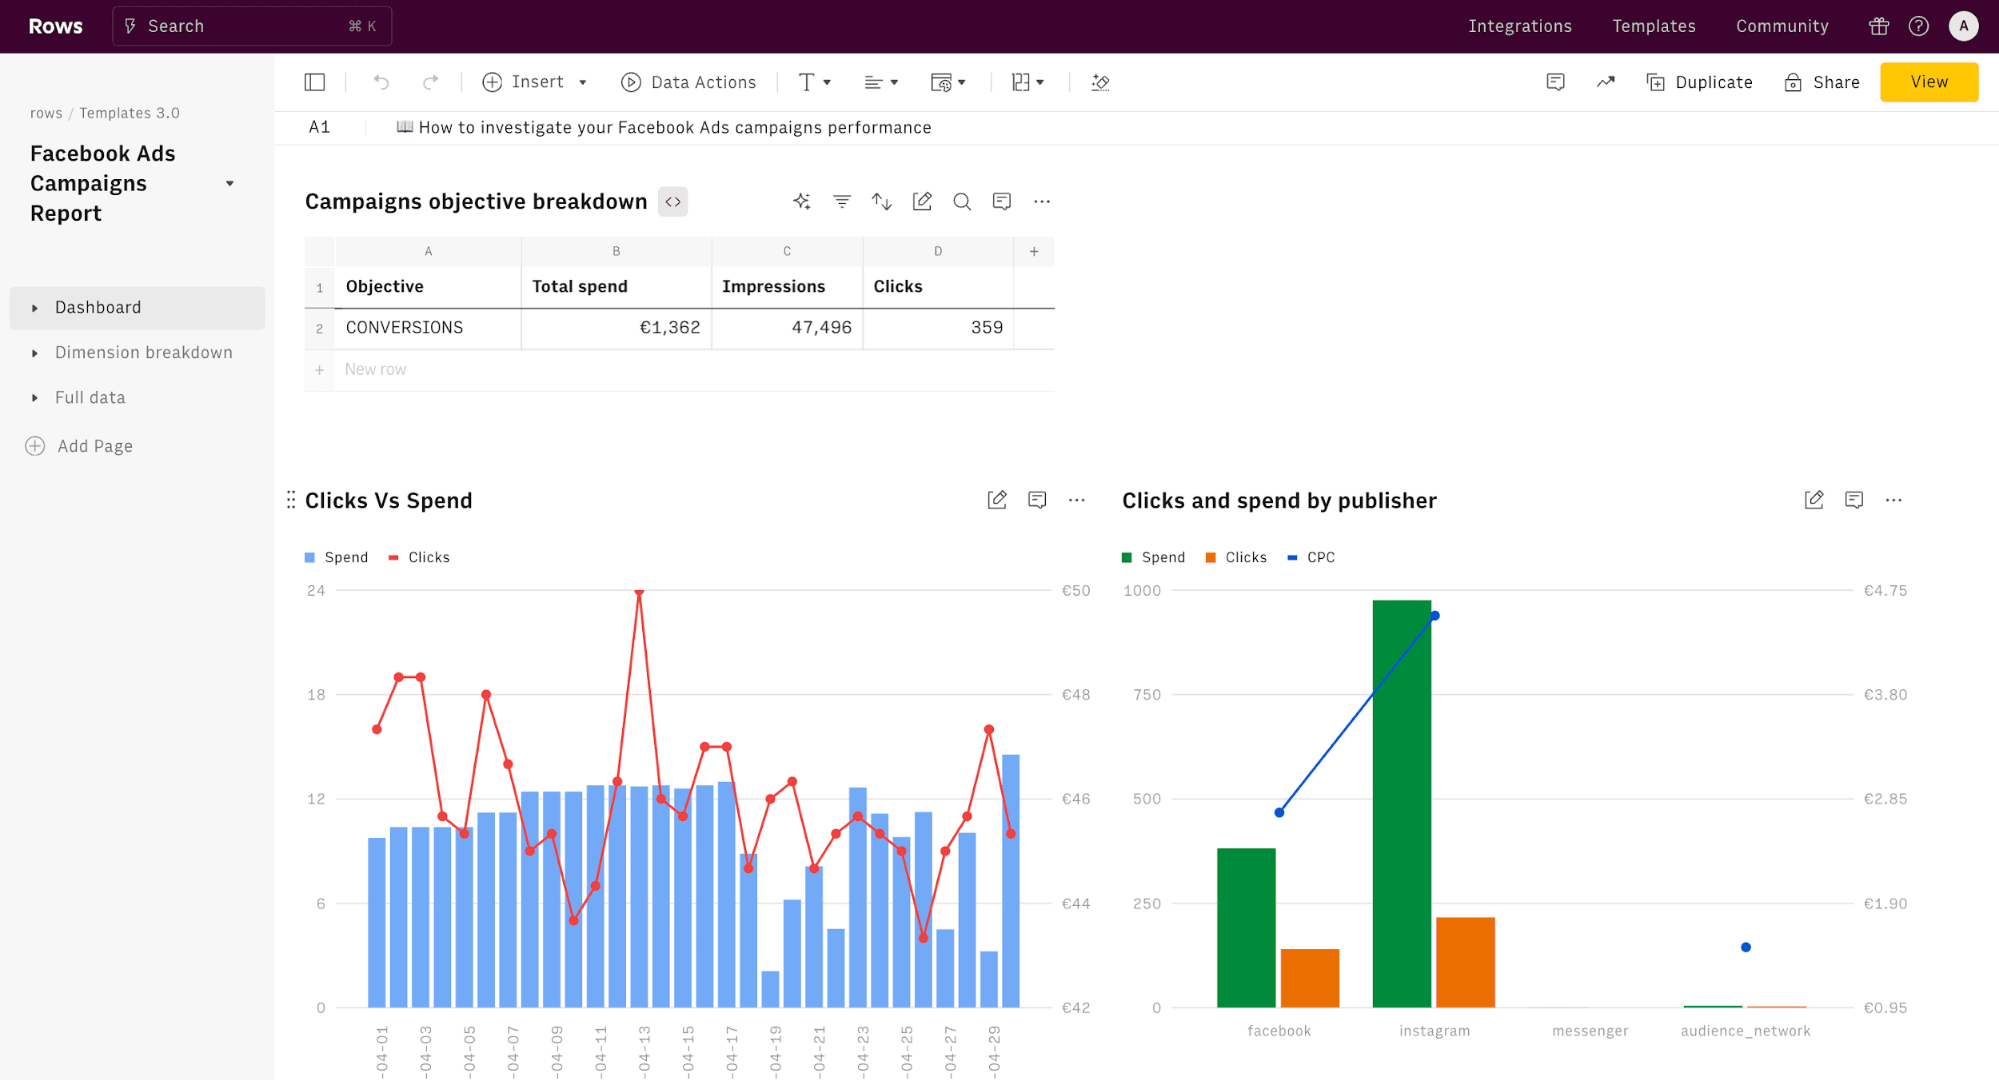
Billions of people use Meta apps to connect with friends and family. So, what better way to reach new customers than with ads on Facebook? Now, you've gone ahead and run multiple ads on Facebook. That's nice! But what do you make of the campaigns? What's the outcome of every penny spent on running these ads?
This Facebook ads campaign template reveals a comprehensive report of your Facebook Ads campaigns, with a focus on spending and objectives. And insights that can determine the ROI of your marketing investment.
➡️ Click to use this template now!
10. Investment portfolio tracking template
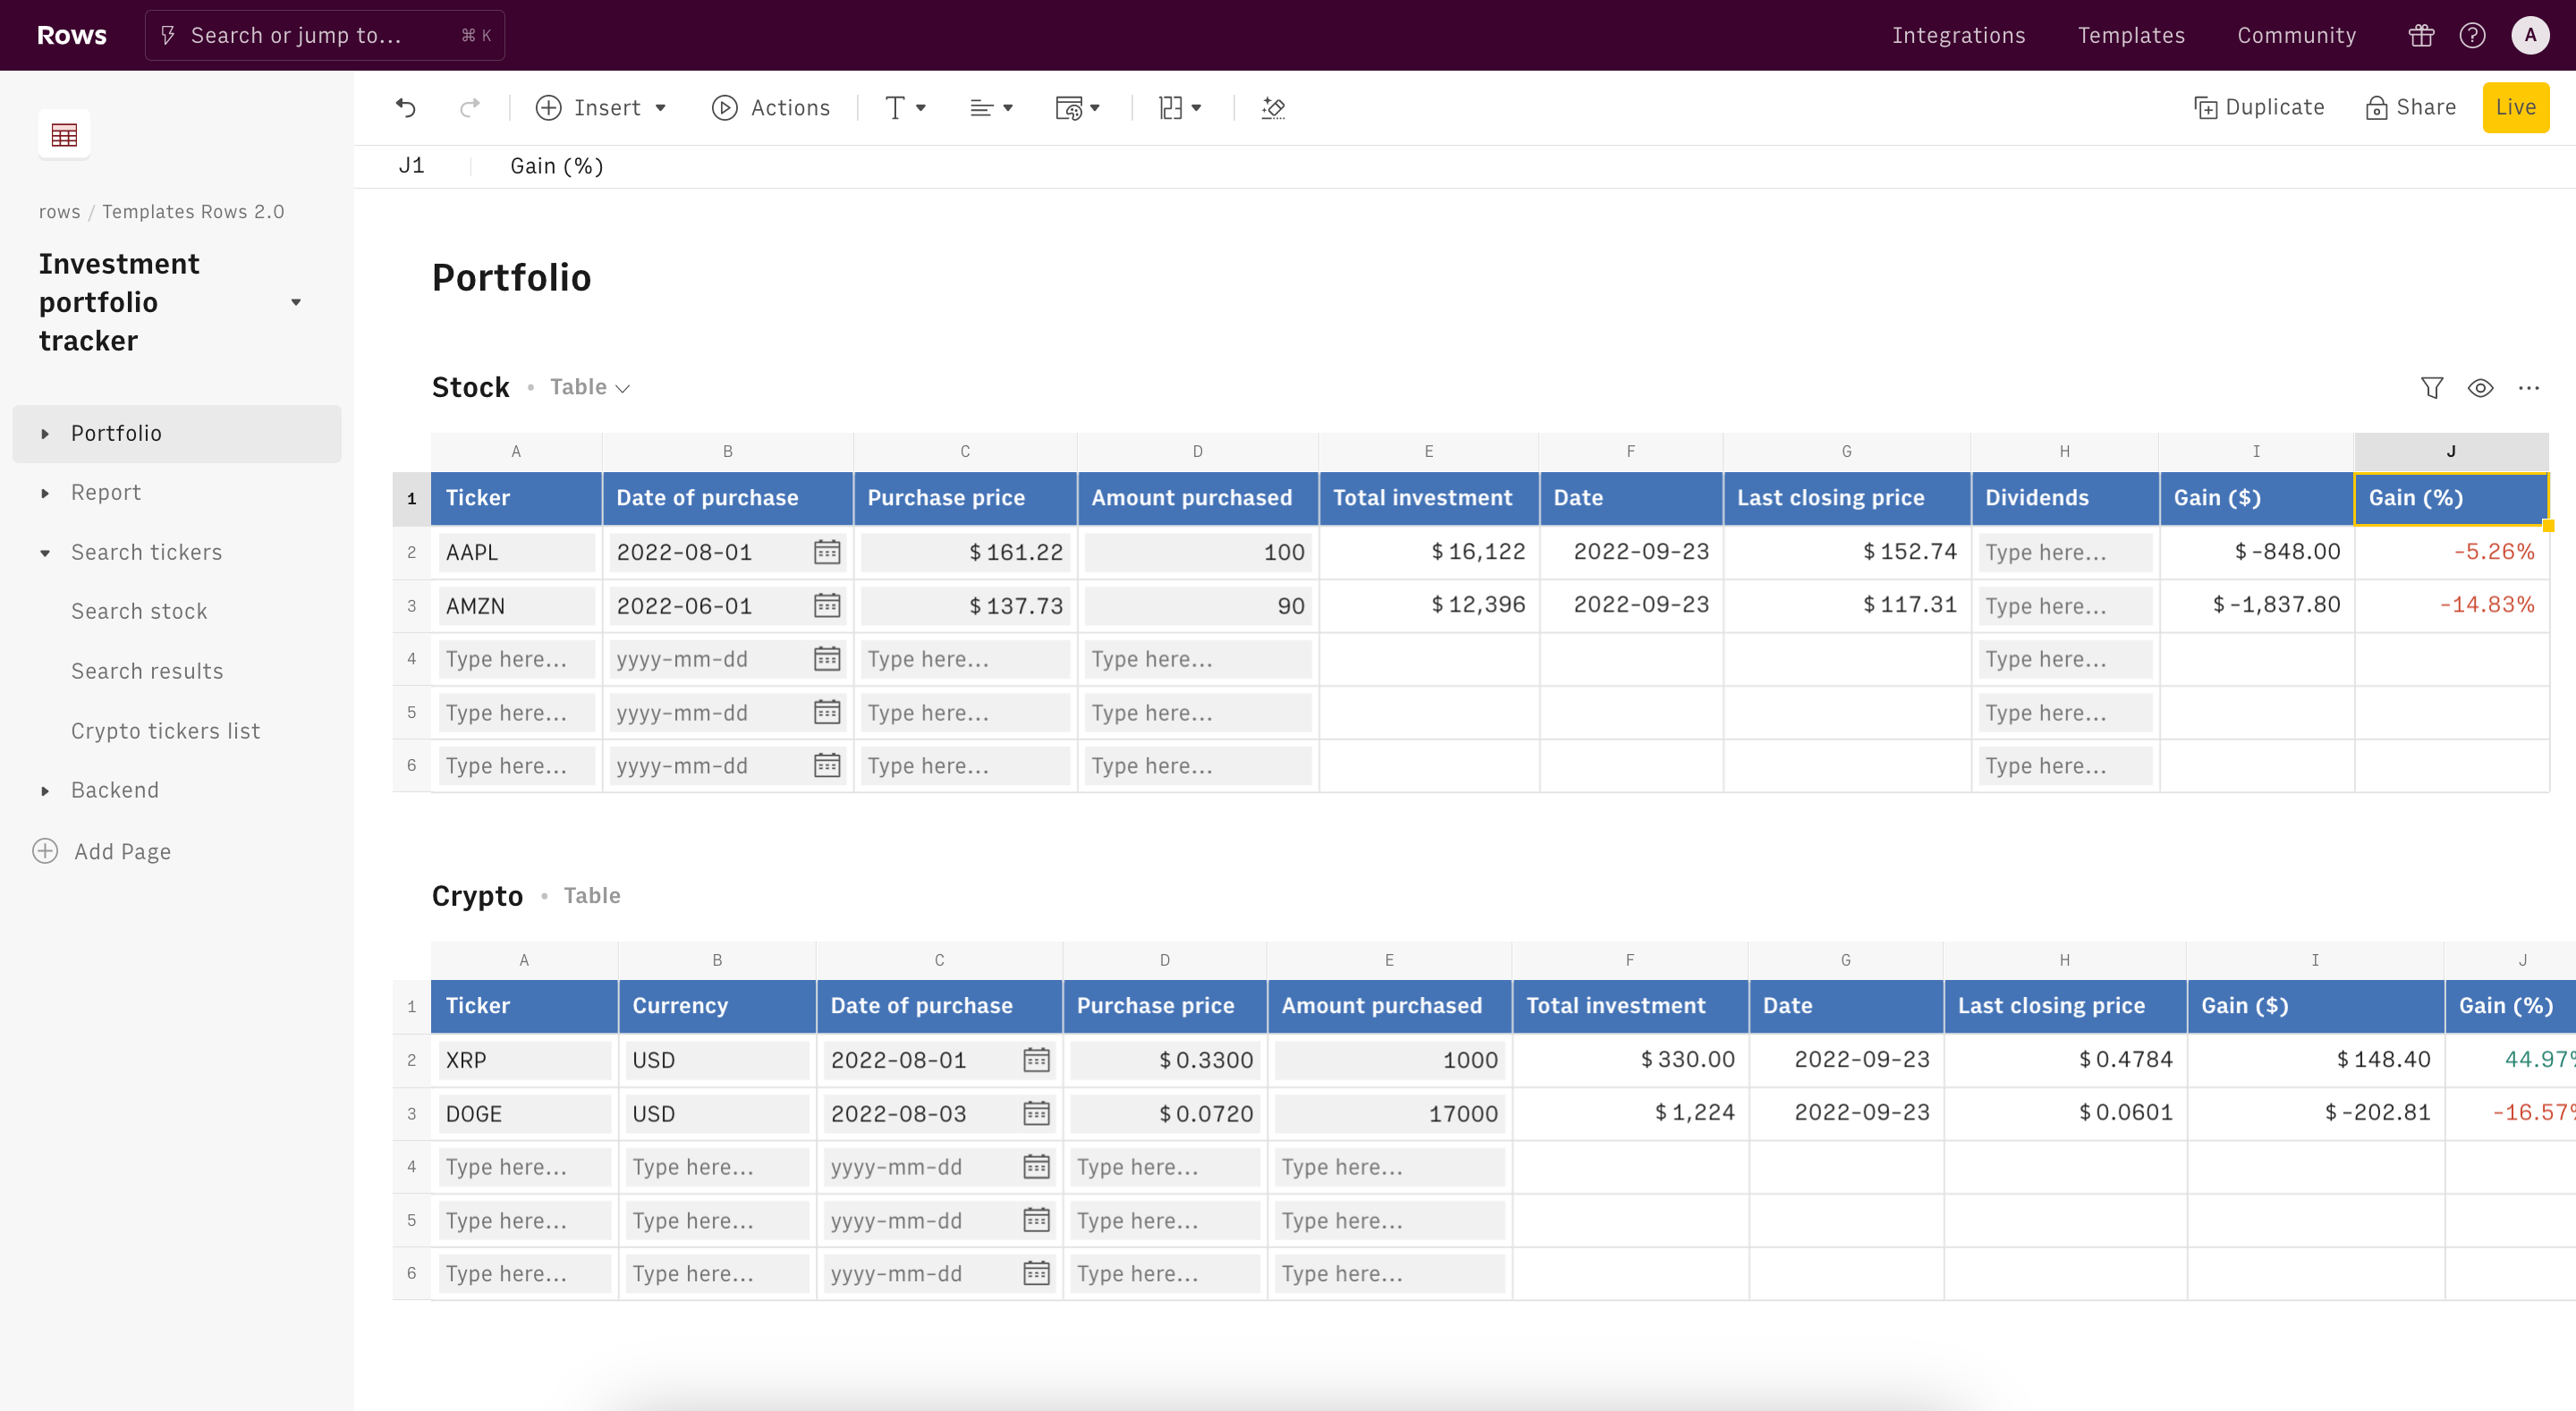
If you are looking for a way to automate the tracking of your personal investments or company investments, then this spreadsheet template will be very helpful. An investment portfolio tracking Spreadsheet is a financial tool designed to help investors monitor, analyze, and manage their various investments in one centralized location. Here's a concise definition
No more manual data ingestion on your spreadsheet; with this template, you get automated updates and insightful analytics.
➡️ Click to use this template now!
Read more: 10 Best Spreadsheet Software to Try in 2025.
100+ templates to level up your reporting game
Rows is connected to your business data, powered by AI and delightful to share.
Explore Templates
Top 5 Free Spreadsheet Templates for Google Sheets
Google Sheets offers a range of free spreadsheet templates that can help you streamline various tasks. Whether you're tracking your monthly budget, managing a project, or organizing a marketing campaign, these templates are easy to use and fully customizable.
11. Cash flow Google Sheets template
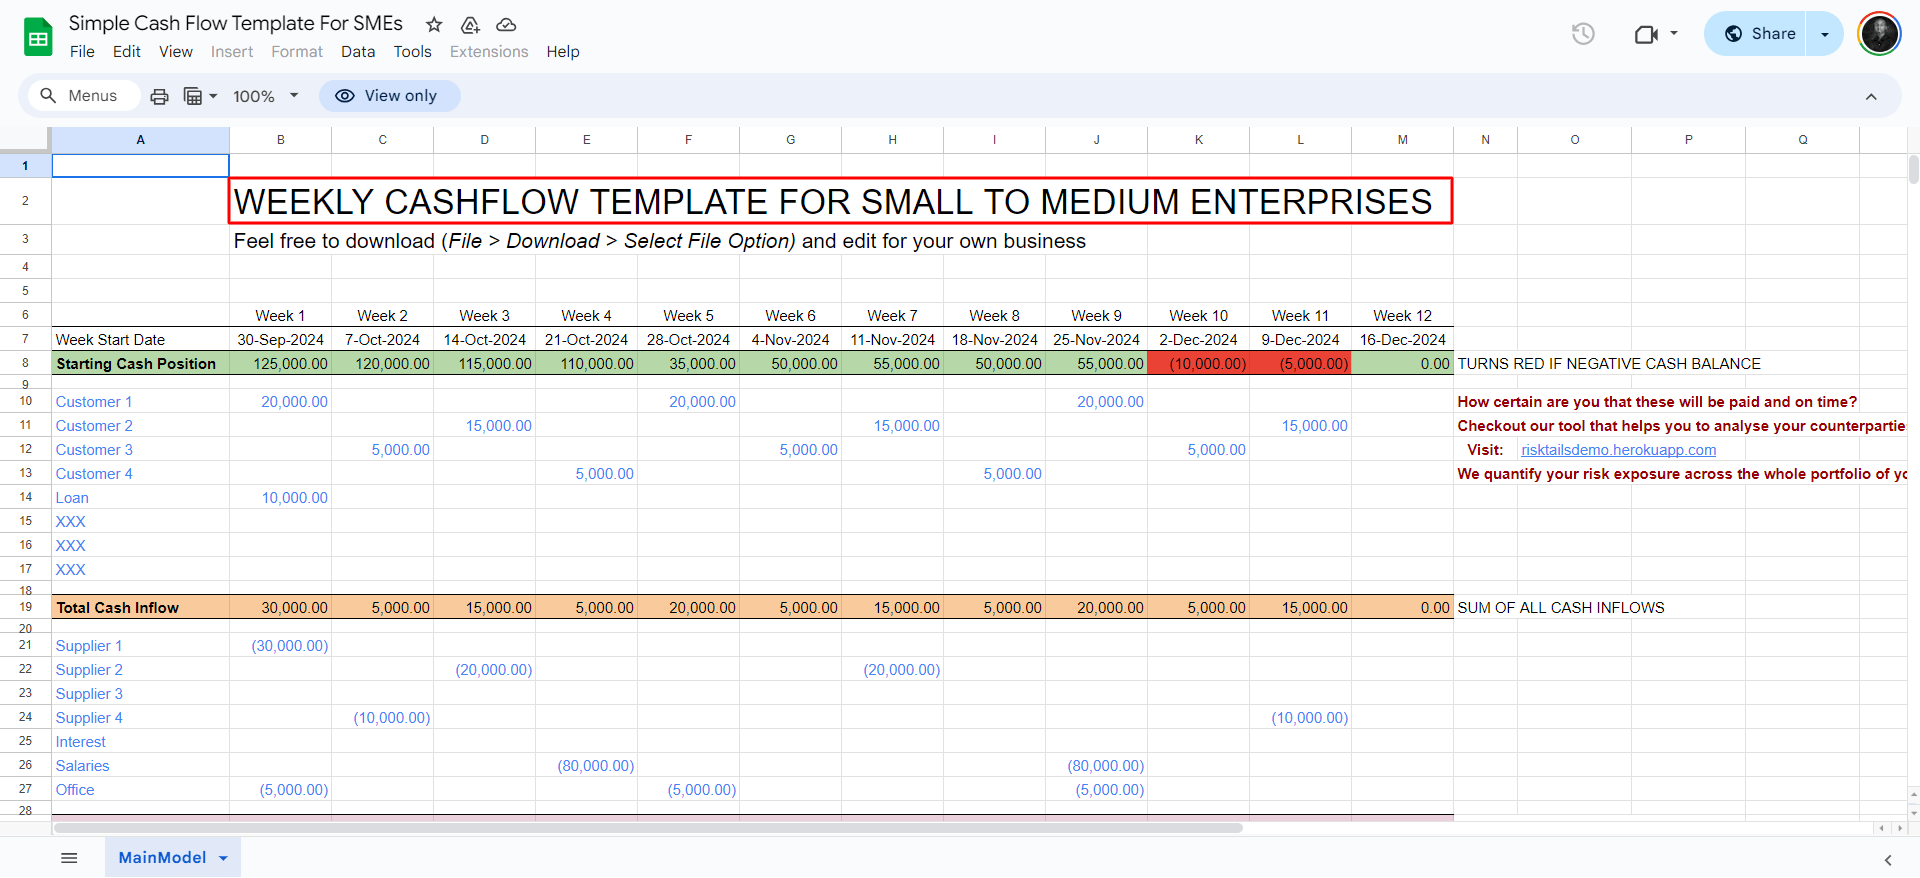
Want to be kept abreast with updates about your income and expenses about your business? Then this spreadsheet template on Sheets is for you. With this spreadsheet template, you can track your cash flow, spot spikes, and lows, and identify voids in your income generation.
➡️ Download this template here!
12. Project Tracking template
This dashboard allows you to track projects in your organization easily. It provides an overview of deadlines, team performance, and project progress. Using this template, you can plan and stay organized by assigning end dates or due dates to projects.
➡️ Download the template here.
13. CRM Report Sheets Template
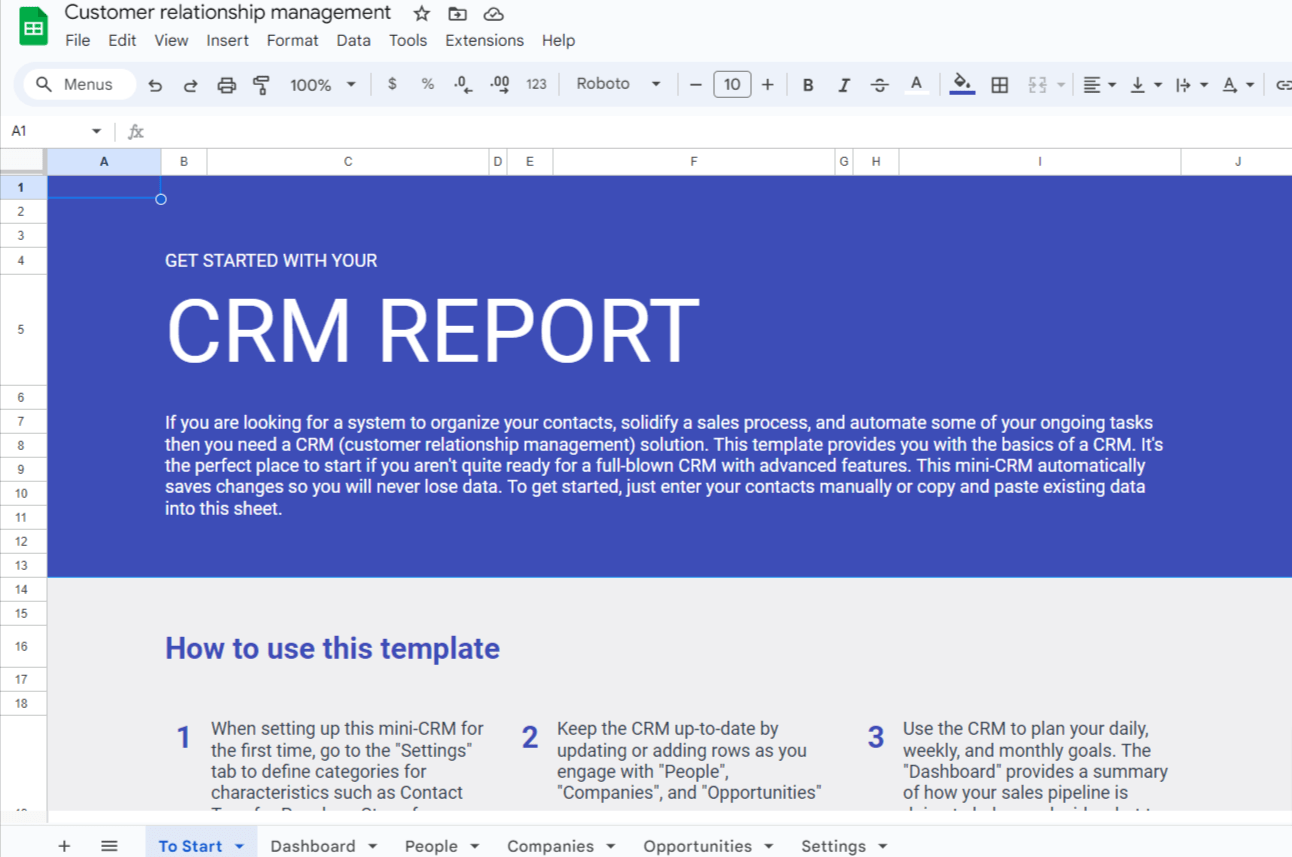
This template can comprehensively overview customer relationship management metrics and sales performance data. Using this template, you can optimize your sales strategies, improve customer engagement, and make data-driven decisions to boost revenue growth.
➡️ Download this template here.
14. E-commerce dashboard template
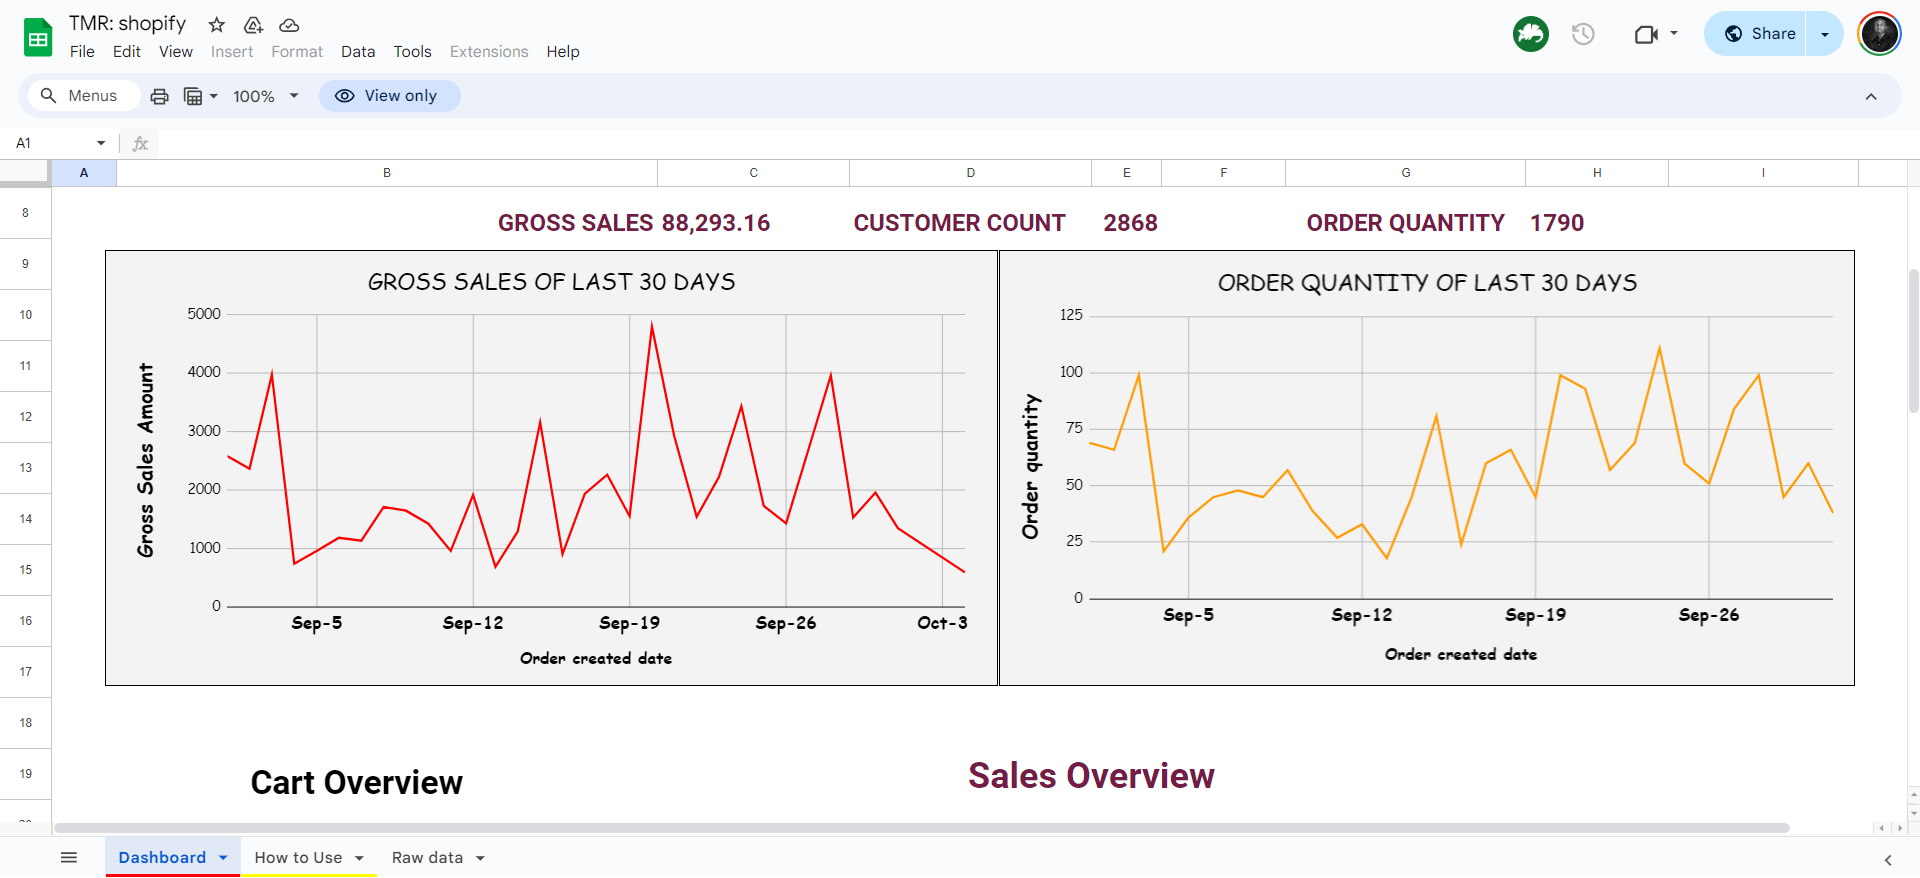
From cart reviews to checkouts and orders delivered — this template is essential for e-commerce and sales managers working for e-commerce brands. It overviews gross sales, customer count, and order quantity.
➡️ Download this template here.
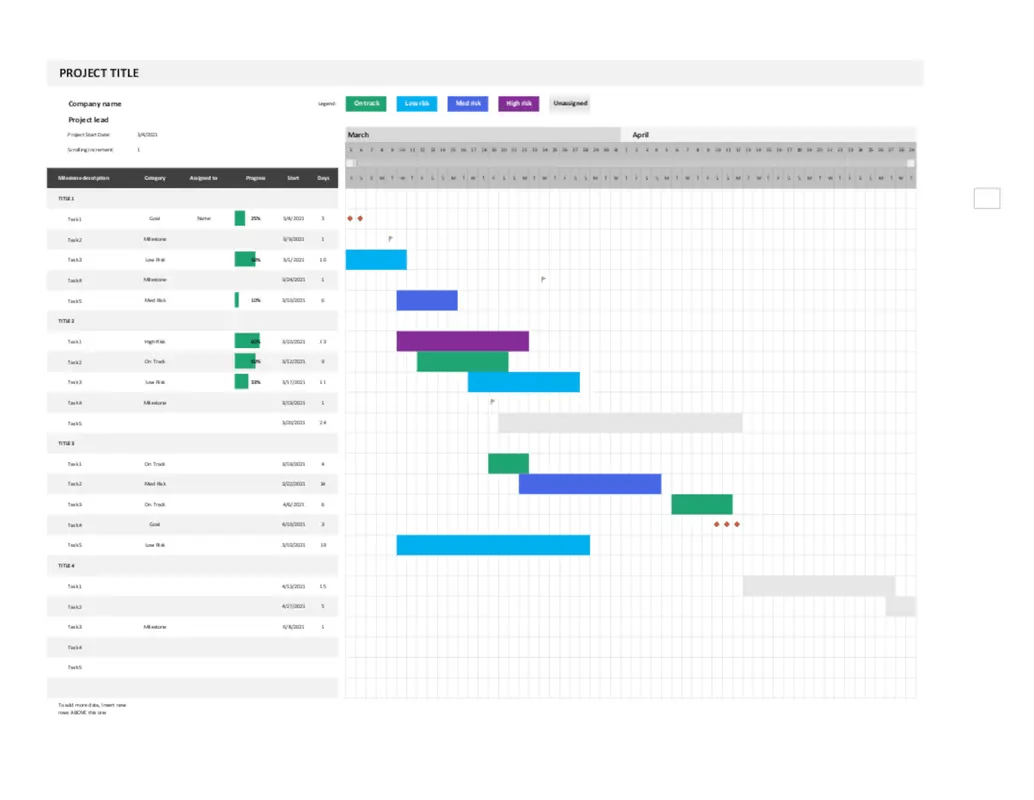
15. Gantt chart template
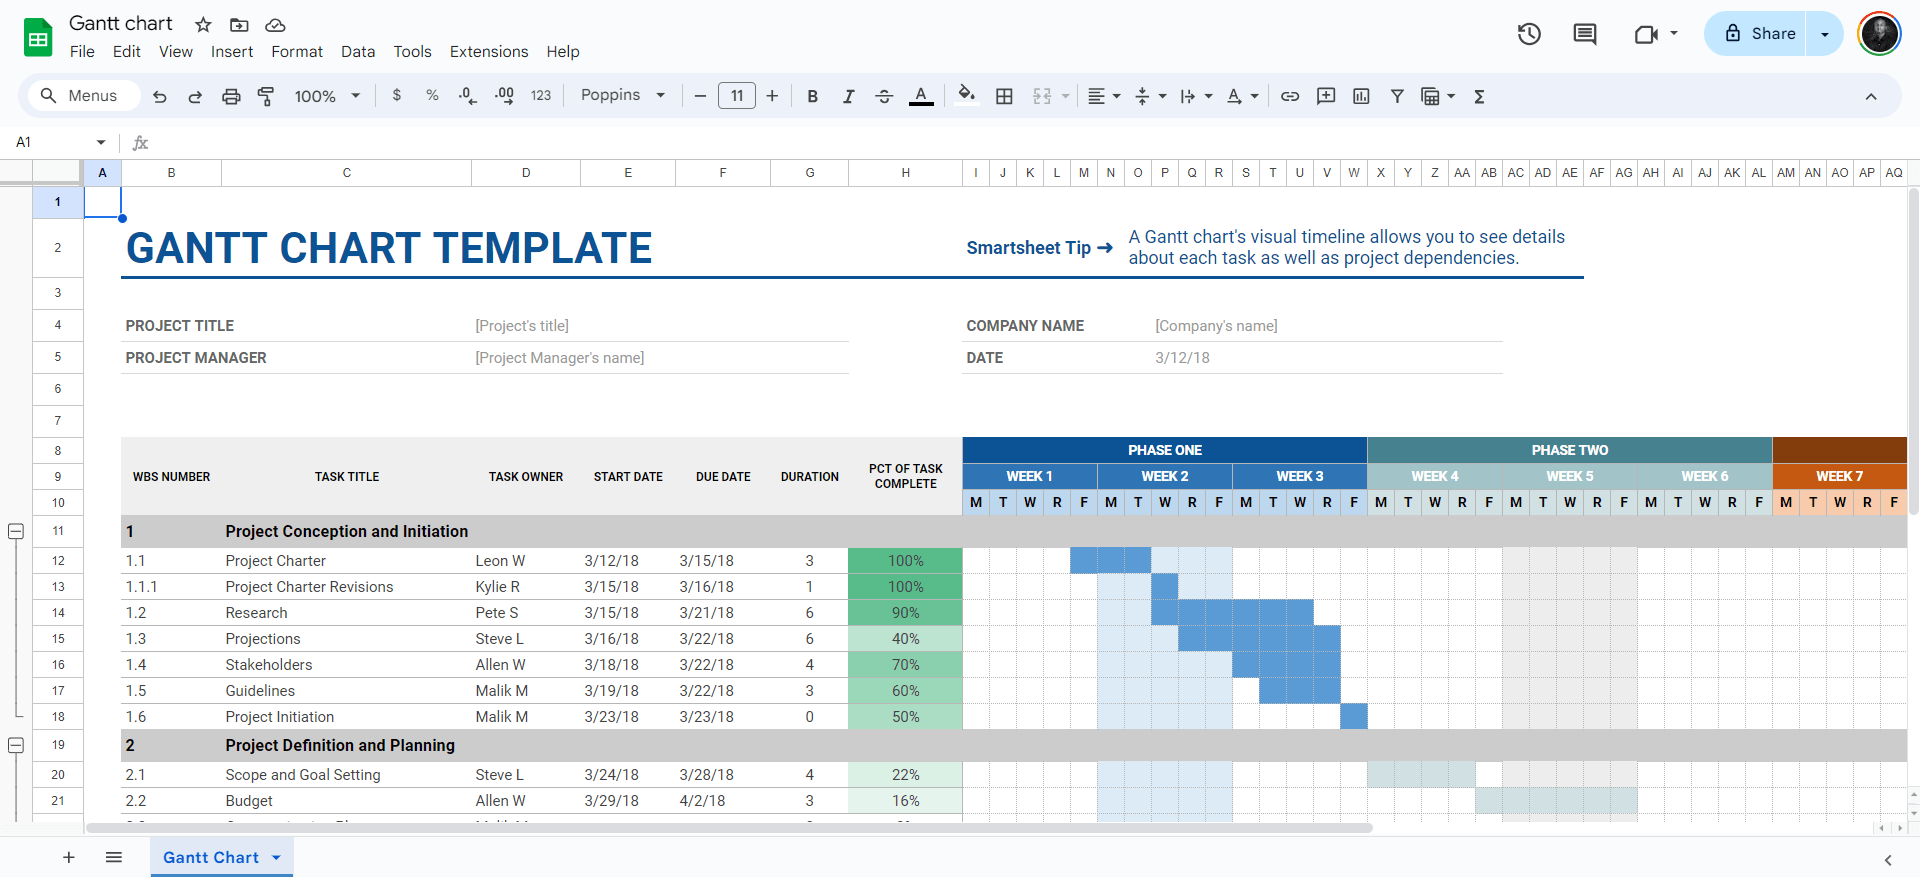
This template shows details about each task and project dependencies. It documents tasks, deadlines, dependencies, and progress in a horizontal bar chart. The Gantt Chart Dashboard allows project managers to easily track project milestones, allocate resources, identify potential bottlenecks, and communicate timelines to stakeholders.
➡️ Download this template here!
Also read: Best 15 free Google Sheets dashboard templates [2025]
Top 5 Free Excel Spreadsheet Templates
For Excel users, these free 'spreadsheet templates' are designed to tackle everything from financial modeling to employee scheduling. Each template offers built-in features tailored to make data entry and management seamless.
16. Expense report template
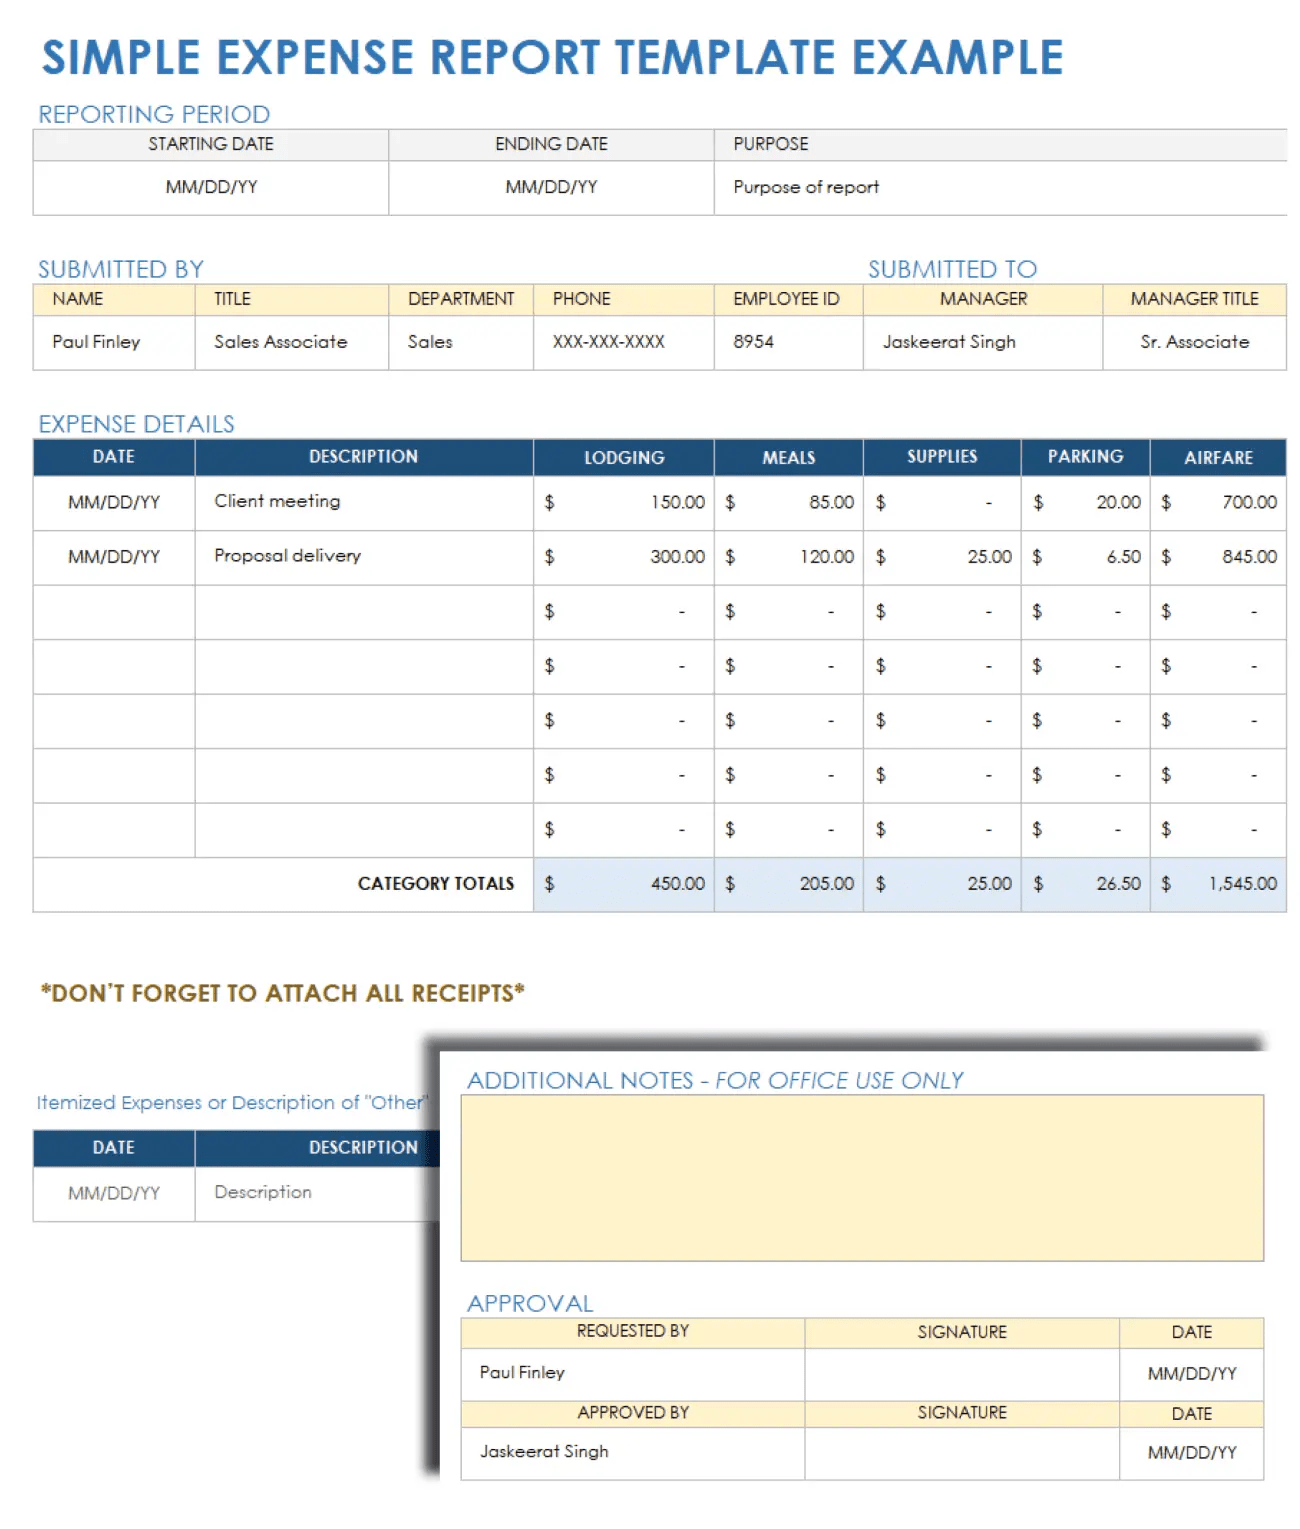
The expense report template records categorizes and summarizes business-related expenses. It provides a standardized format for employees to report their expenditures, usually including fields for the date, expense description, amount spent, and category of spending (such as travel, meals, or office supplies).
➡️ Download this template here!
17. Sales dashboard Excel
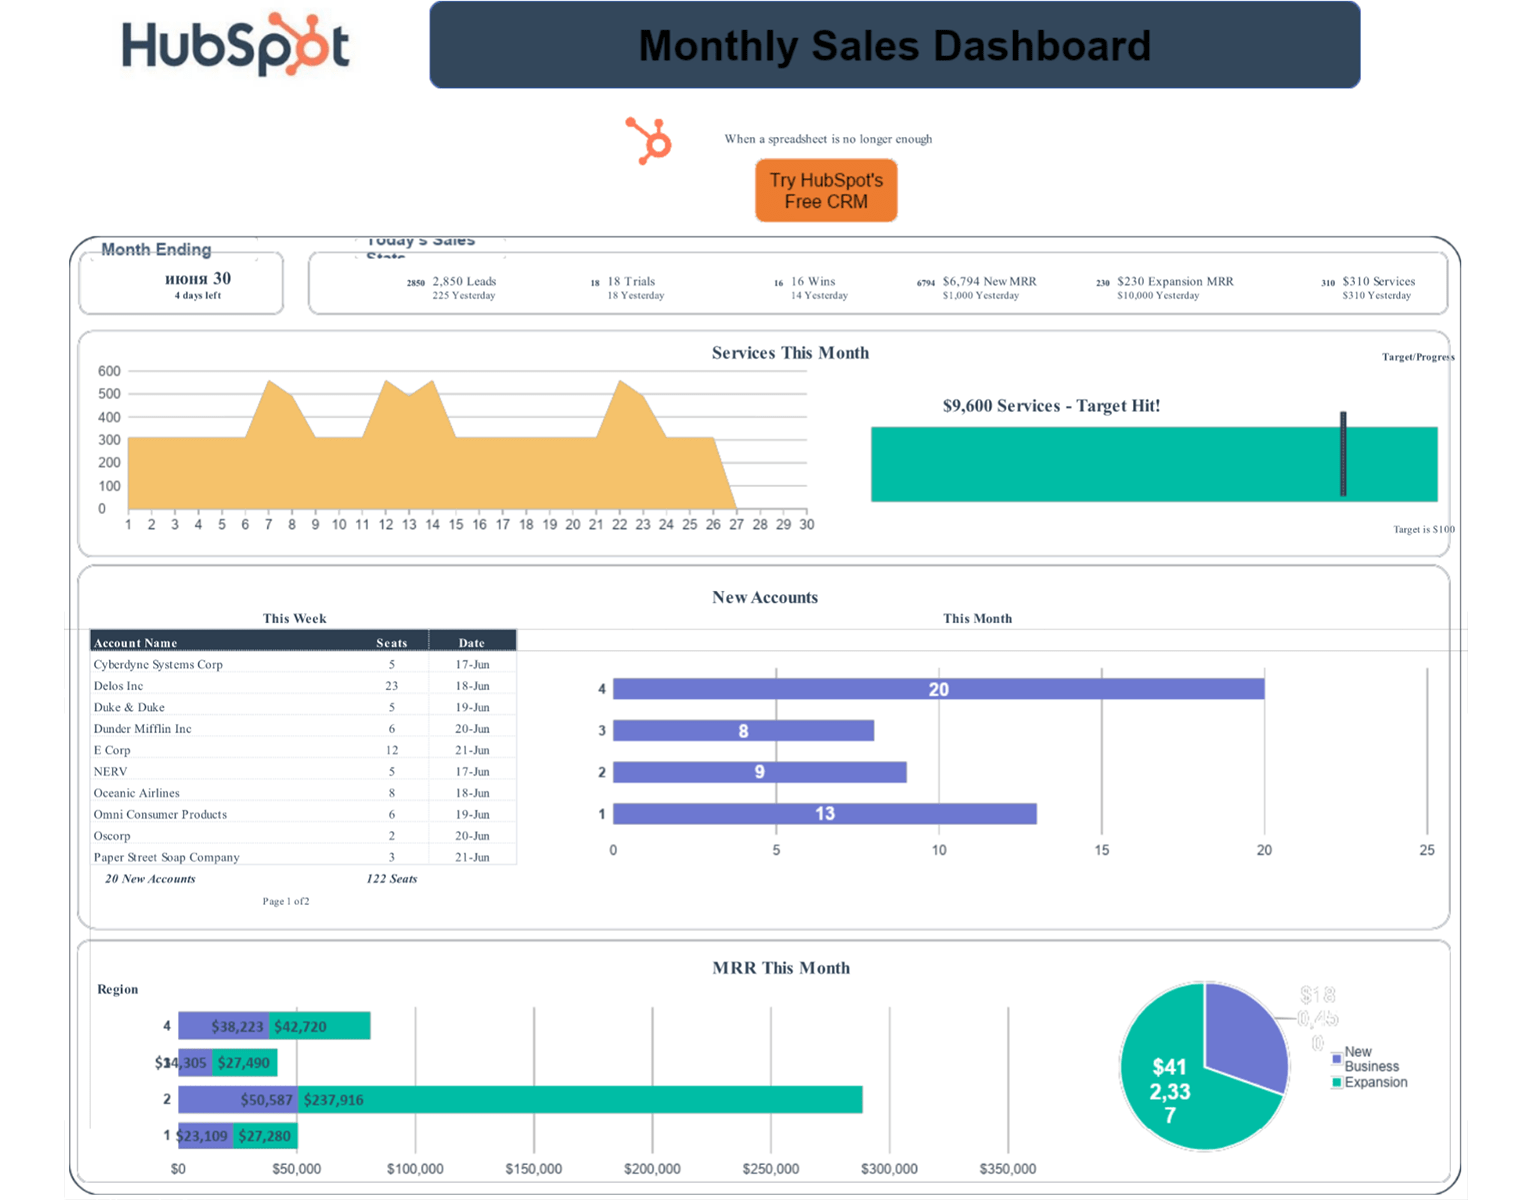
This template covers crucial aspects of sales management, including target account insights, high-level sales performance views, task tracking, account-based marketing strategies, and sales opportunity forecasting.
➡️ Download this template here!
18. Employee schedule template
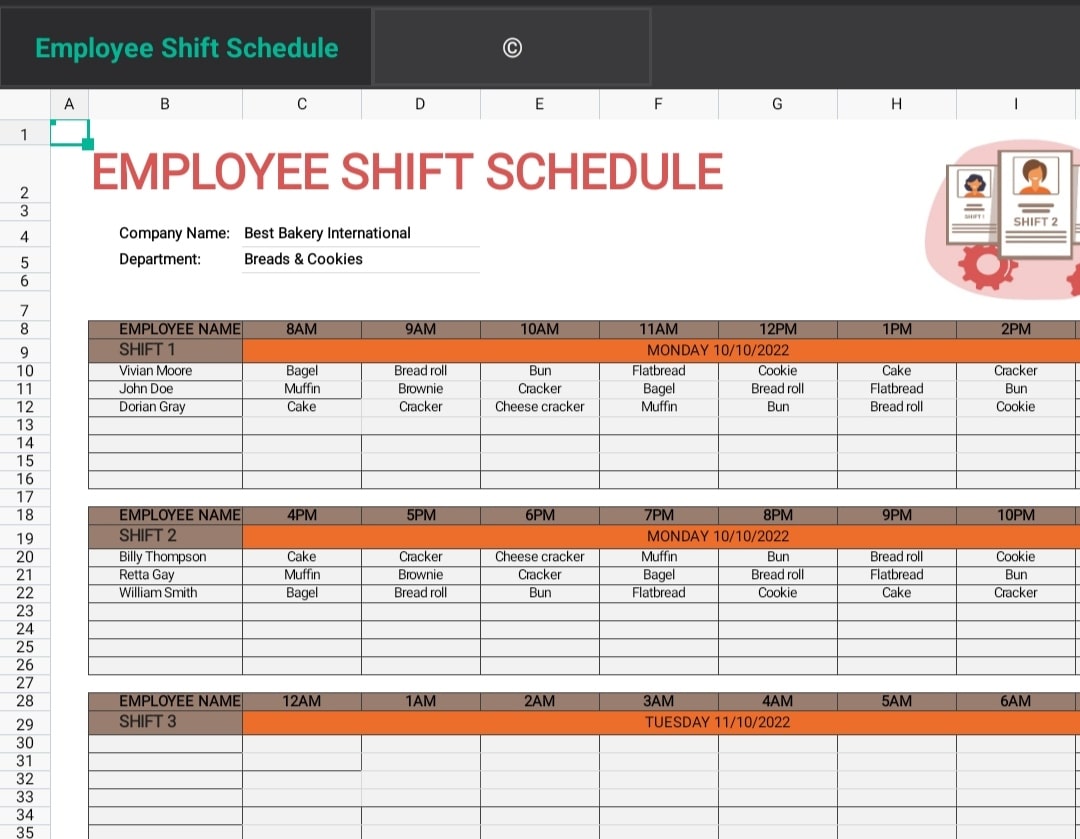
Are you a team lead, and do you want a spreadsheet that helps you coordinate employee role functions weekly? Then, you need an employee schedule template. With this template, you can organize the shift schedule for your team members and keep everyone up-to-date with their functions.
➡️ Download this template here!
19. Agile Gantt chart Excel template
Complex work projects can be tricky to manage without a clear, dynamic roadmap but an Agile Gaant chart template reduces stress.
By organizing tasks along a timeline and mapping them to sprints or deadlines, this template makes it a breeze to track your project's progress. The visual layout is a game-changer for agile teams, allowing you to make real-time adjustments as the project scope evolves.
➡️ Download this template here!
20. Comprehensive budget template
With intuitive, color-coded categories and a clean, straightforward layout, this template makes budgeting and money management easy. Track your income, expenses, savings, and investments all in one place, and watch as the smart formulas do the heavy lifting of categorizing and calculating your totals.
➡️ Download this template here!
100+ templates to level up your reporting game
Rows is connected to your business data, powered by AI and delightful to share.
Explore Templates
You don't have to click on “blank spreadsheet” all the time
Managing data doesn’t have to take up most of your day or require you to manually update the sheet every time the direction of your project or marketing campaign changes. Using a purpose-built spreadsheet template that automates capacity management, utilization tracking, and project reports takes less effort.
With spreadsheet software like Rows, integrating data from multiple data sources can save your team time, and scheduling your resources can save you up to hours a week! The sweet part is that we have an AI analyst to do the trench work for you — With the AI Analyst, you ask AI to analyze, summarize, transform, and enrich your analysis
If you or your team don’t have the time to try every product on our list, go to Rows.com, import data, automate your report, and see if it's the right match!