About Google Analytics 4 Traffic Acquisition Report
The Google Analytics 4 (GA4) Traffic Acquisition Report template is your ultimate tool for gaining in-depth insights into your website’s traffic acquisition over the past 90 days. This comprehensive report captures essential metrics and visualizations, empowering you to make data-driven decisions and optimize your marketing strategies effectively. Despite replicating the same report as in GA4, having the data on a spreadsheet enhances your ability to analyze, expand, and transform the data, providing greater flexibility and deeper insights.
Core template's components:
- Comprehensive Metrics Table: Track vital metrics such as active users, engagement sessions, average engagement duration, and conversions. This data is categorized by session user default channel group, offering a clear view of how different channels perform.
- Weekly Insights: Understand trends and seasonal variations with weekly breakdowns. The metrics are segmented by session user default channel group and yearWeek, giving you a detailed time-based analysis.
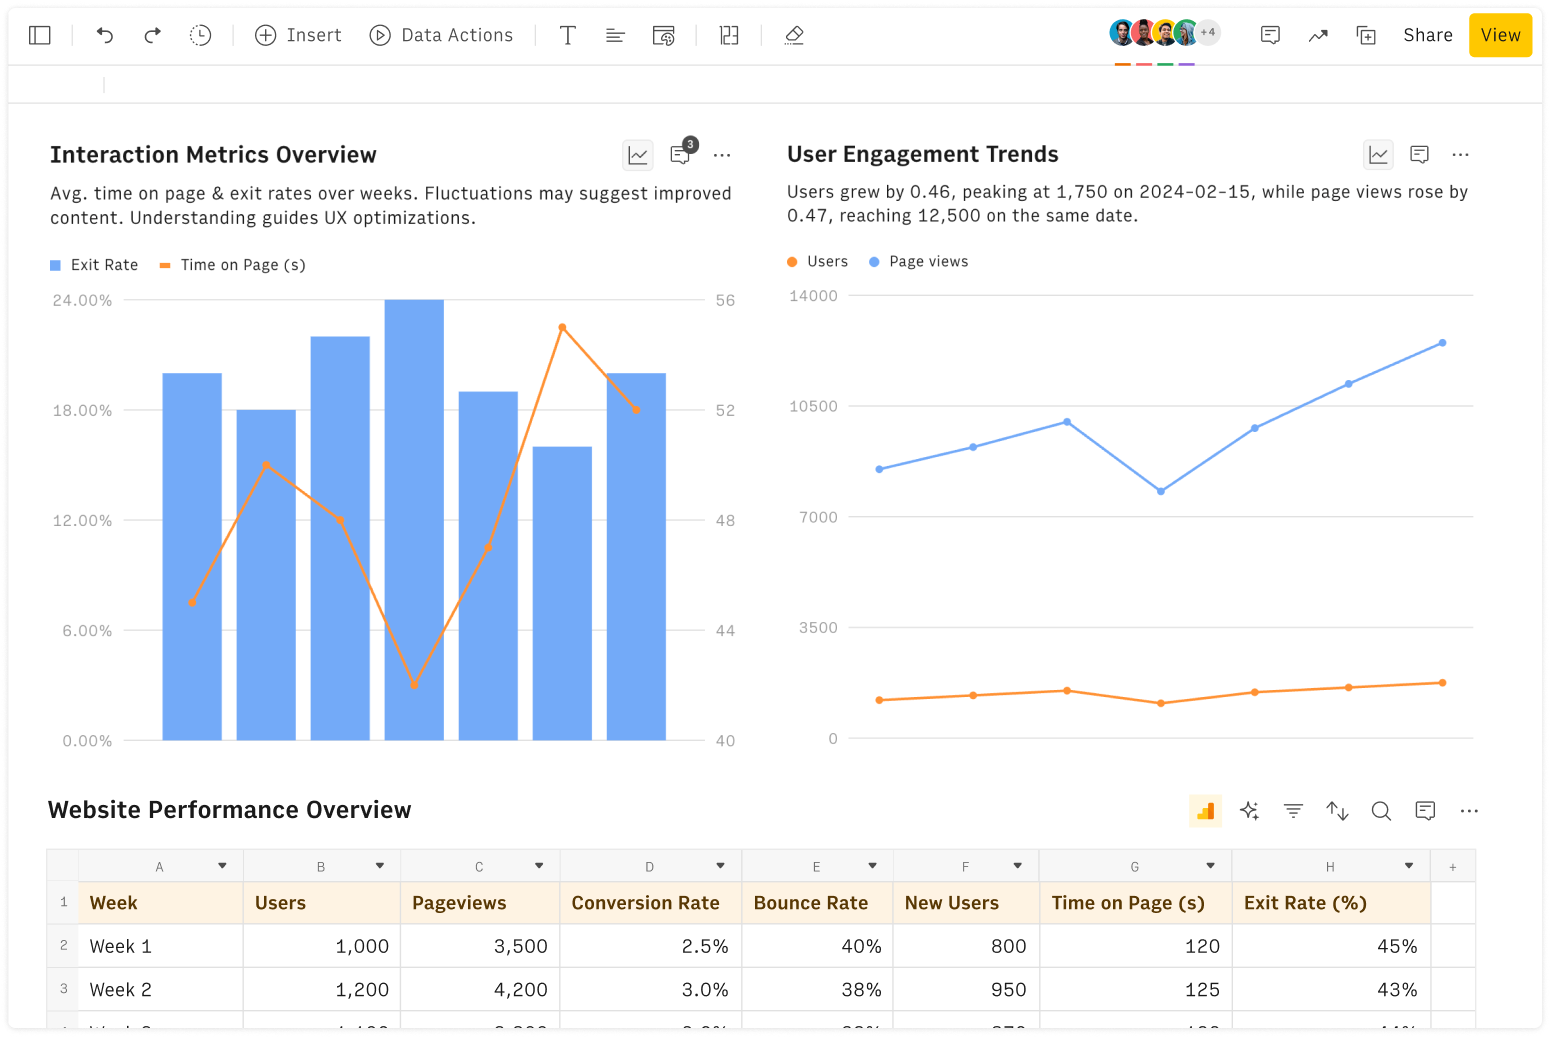
- Top Channels Bar Chart: Identify your most effective traffic sources with a bar chart that highlights the top session user default channel groups. See at a glance which channels are driving the most engagement and conversions.
- Trends Over Time Line Chart: Monitor the evolution of traffic channels with a line chart that tracks session user default channel group performance over time, helping you spot long-term trends and shifts.
Why Use This Template?
While this template mirrors the GA4 Traffic Acquisition report, its format as a spreadsheet offers additional benefits for your data analysis:
- Enhanced Analysis: Utilize spreadsheet functionalities to perform more detailed and customized analyses of your traffic data.
- Data Expansion: Easily integrate additional data sources and expand the dataset for a more comprehensive view of your traffic.
- Data Transformation: Transform and manipulate the data to fit your specific reporting and analysis needs, enabling deeper insights and more tailored reports.
Key Applications:
This GA4 Traffic Acquisition Report template is an invaluable resource for:
- Digital Marketers: Fine-tune your marketing campaigns by pinpointing which channels are most effective in attracting and engaging users.
- Business Analysts: Delve into user behavior and traffic patterns to make data-informed decisions and strategic recommendations.
- E-commerce Managers: Assess the impact of various marketing channels on user acquisition and optimize for the highest return on investment.
- Content Strategists: Determine which content attracts the most traffic and engagement, enabling more targeted and effective content planning.
Who Should Use This Template?
Ideal for professionals who rely on data to guide their decisions, this template is perfect for:
- Digital marketers looking to optimize acquisition strategies.
- Business analysts seeking to understand user behavior.
- E-commerce managers focused on enhancing customer acquisition.
- Content creators aiming to boost traffic and engagement.
Enhance your understanding of your website's traffic and make smarter, data-driven decisions with the Google Analytics 4 Traffic Acquisition Report. This template not only replicates the functionality of the GA4 Traffic Acquisition report but also leverages real GA4 data, ensuring you have the most accurate and actionable insights. Additionally, having this data in a spreadsheet format allows for more flexible and in-depth analysis, expansion, and transformation, empowering you to drive better business outcomes.
How it works
How it works
Get started
Click on 'Use template' and start using it right away. No forms, no signup. Your data first.
Connect your Google Analytics account
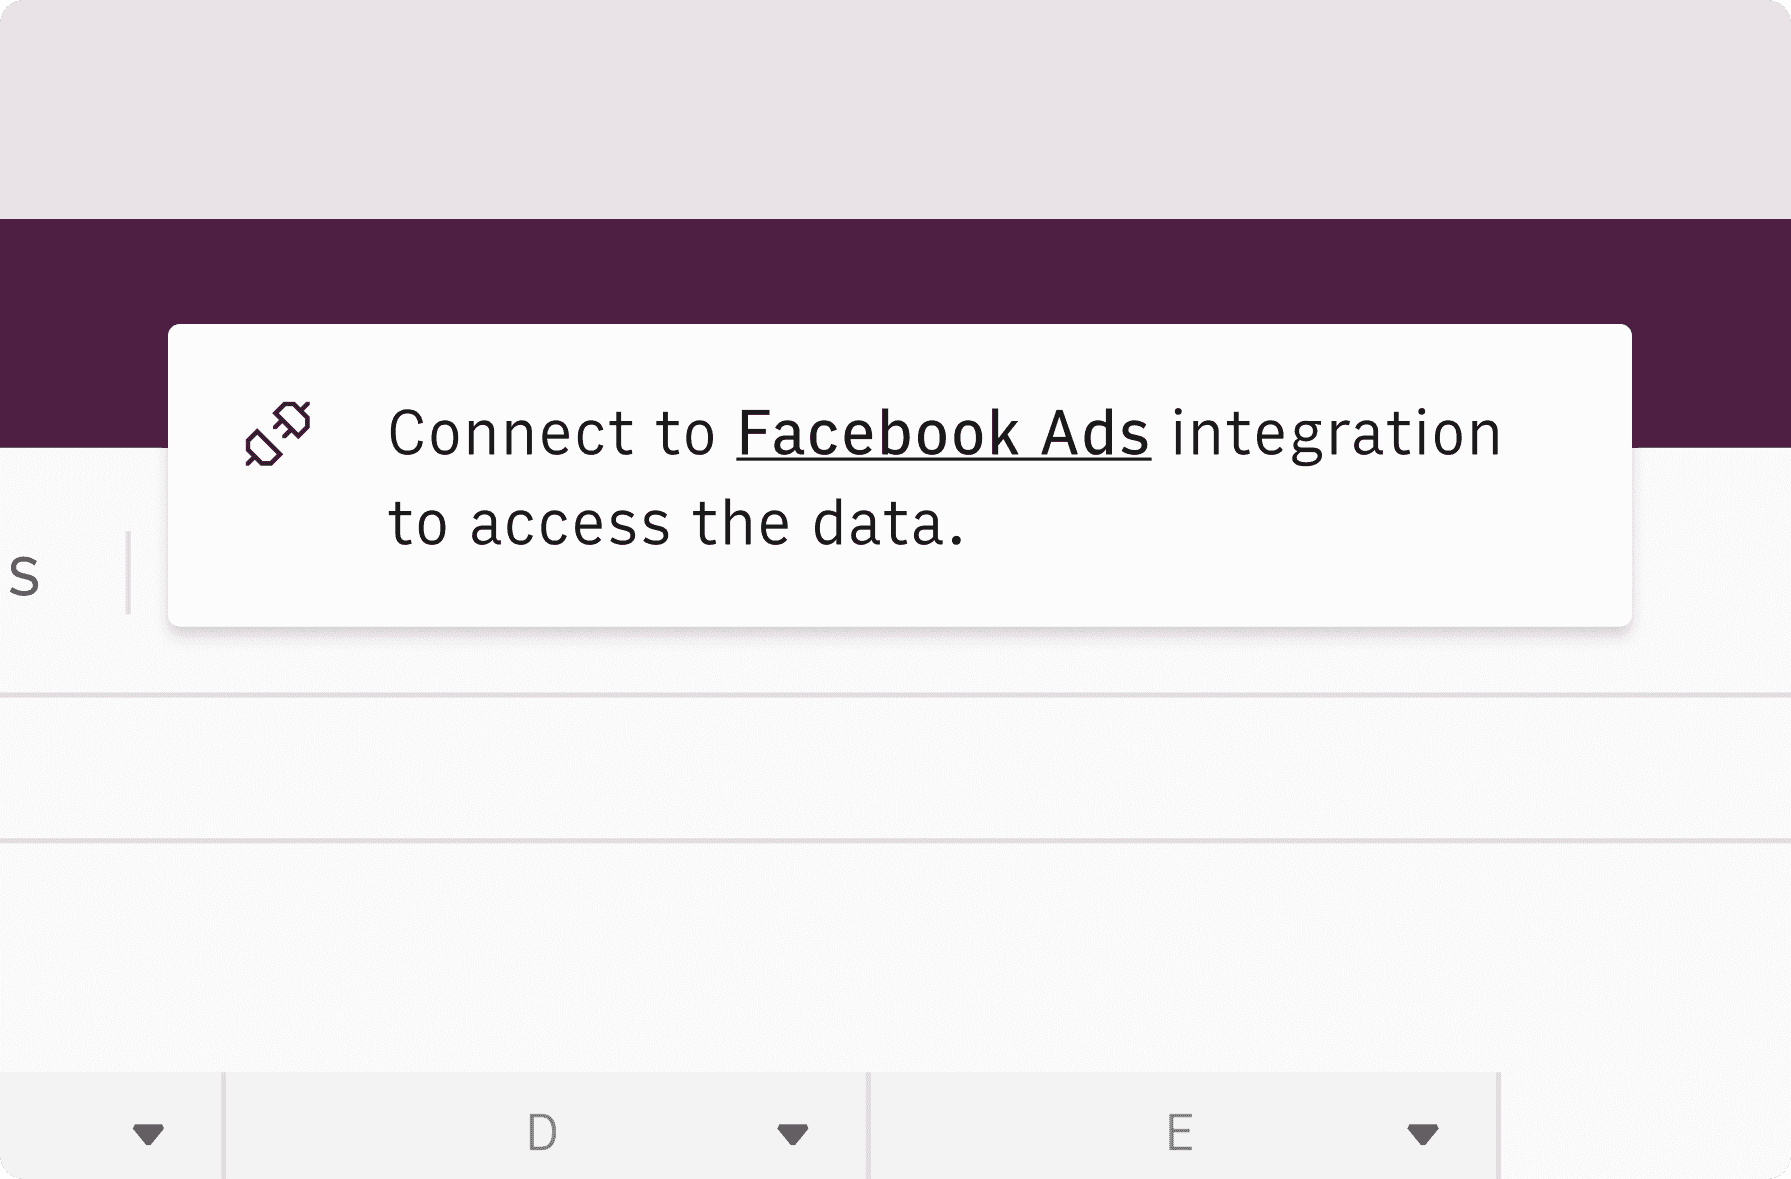
Once landed on the spreadsheet, follow the instructions to connect the required integration and pick your account.
Customize the template and schedule refresh
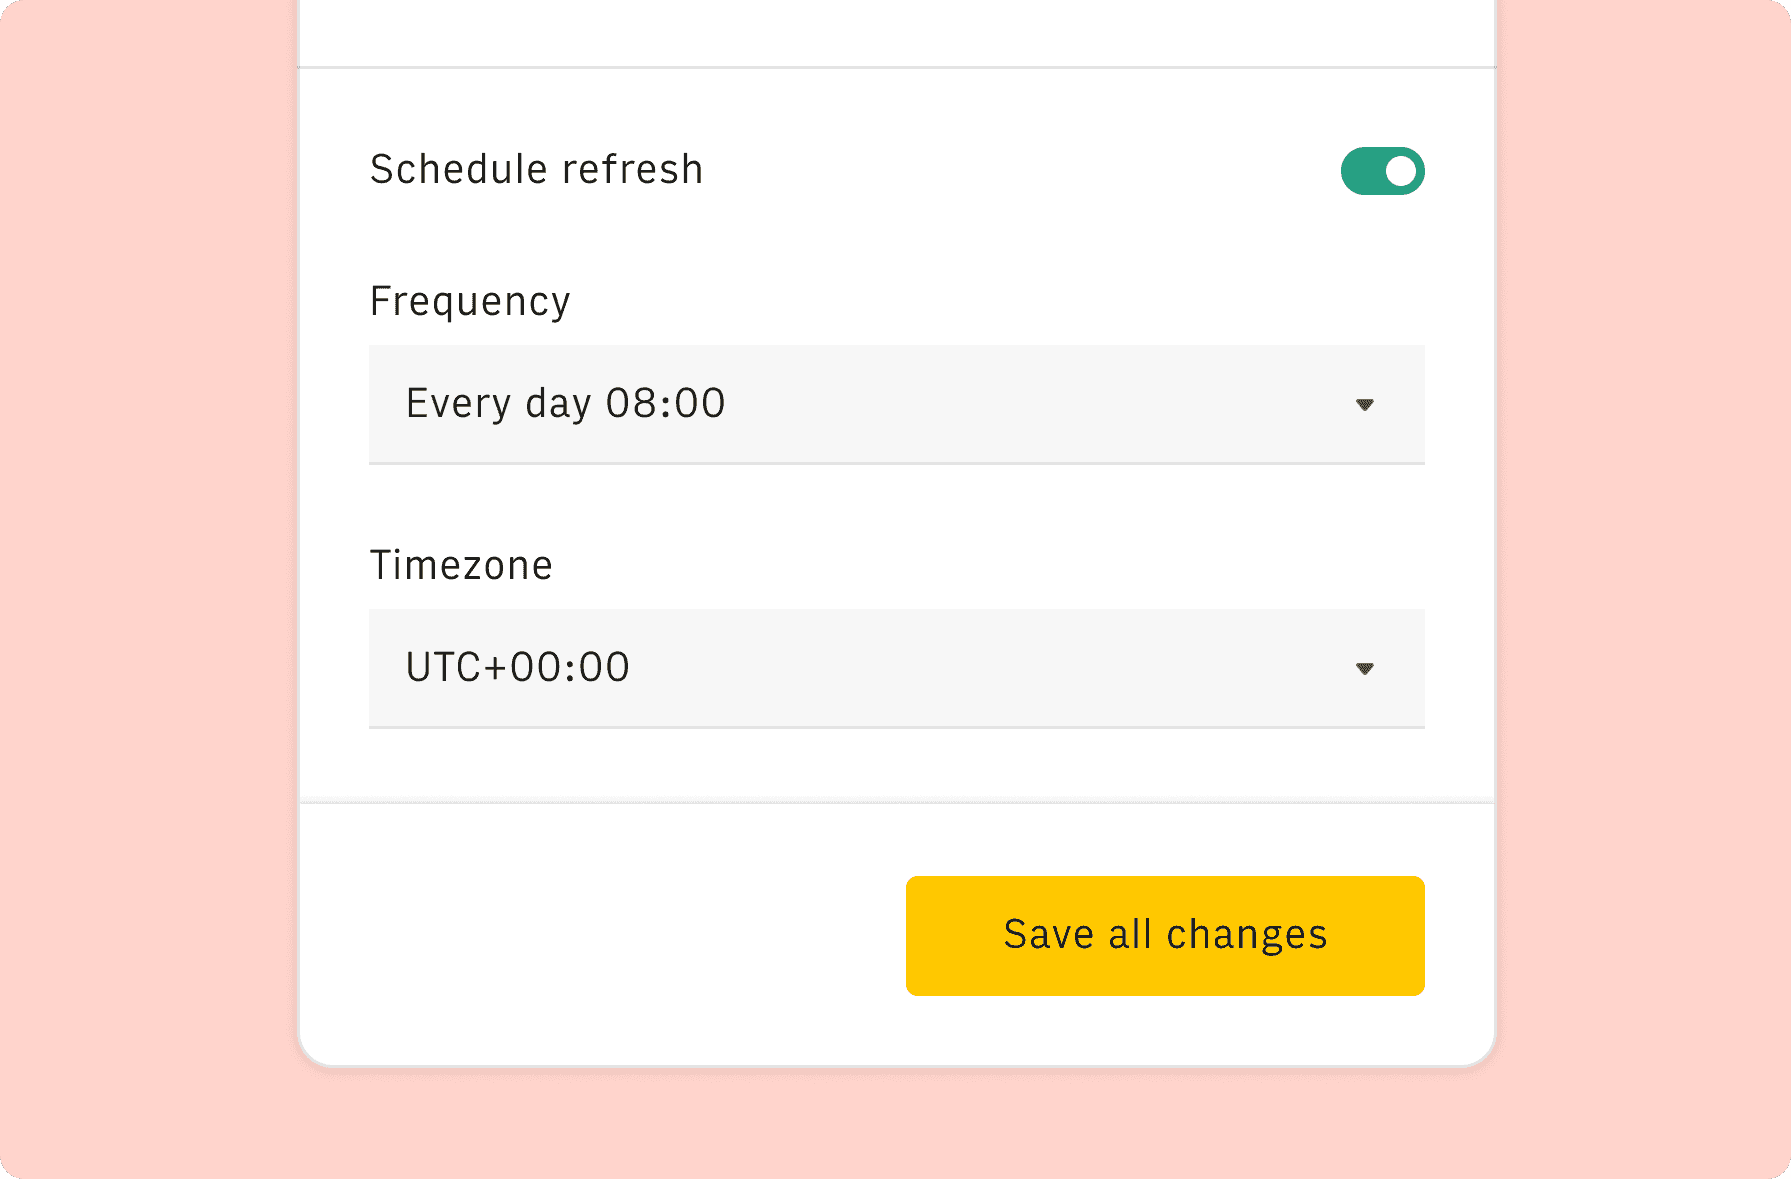
Once the integration has been connected, all tables will update automatically with your own data. Click on 'Edit Source' to change the retrieved data and automate the data refresh. You can then insert a chart or a pivot table, add a column or personalize formats, using all the regular functions and shortcuts that make spreadsheets great.
Embed tables and charts
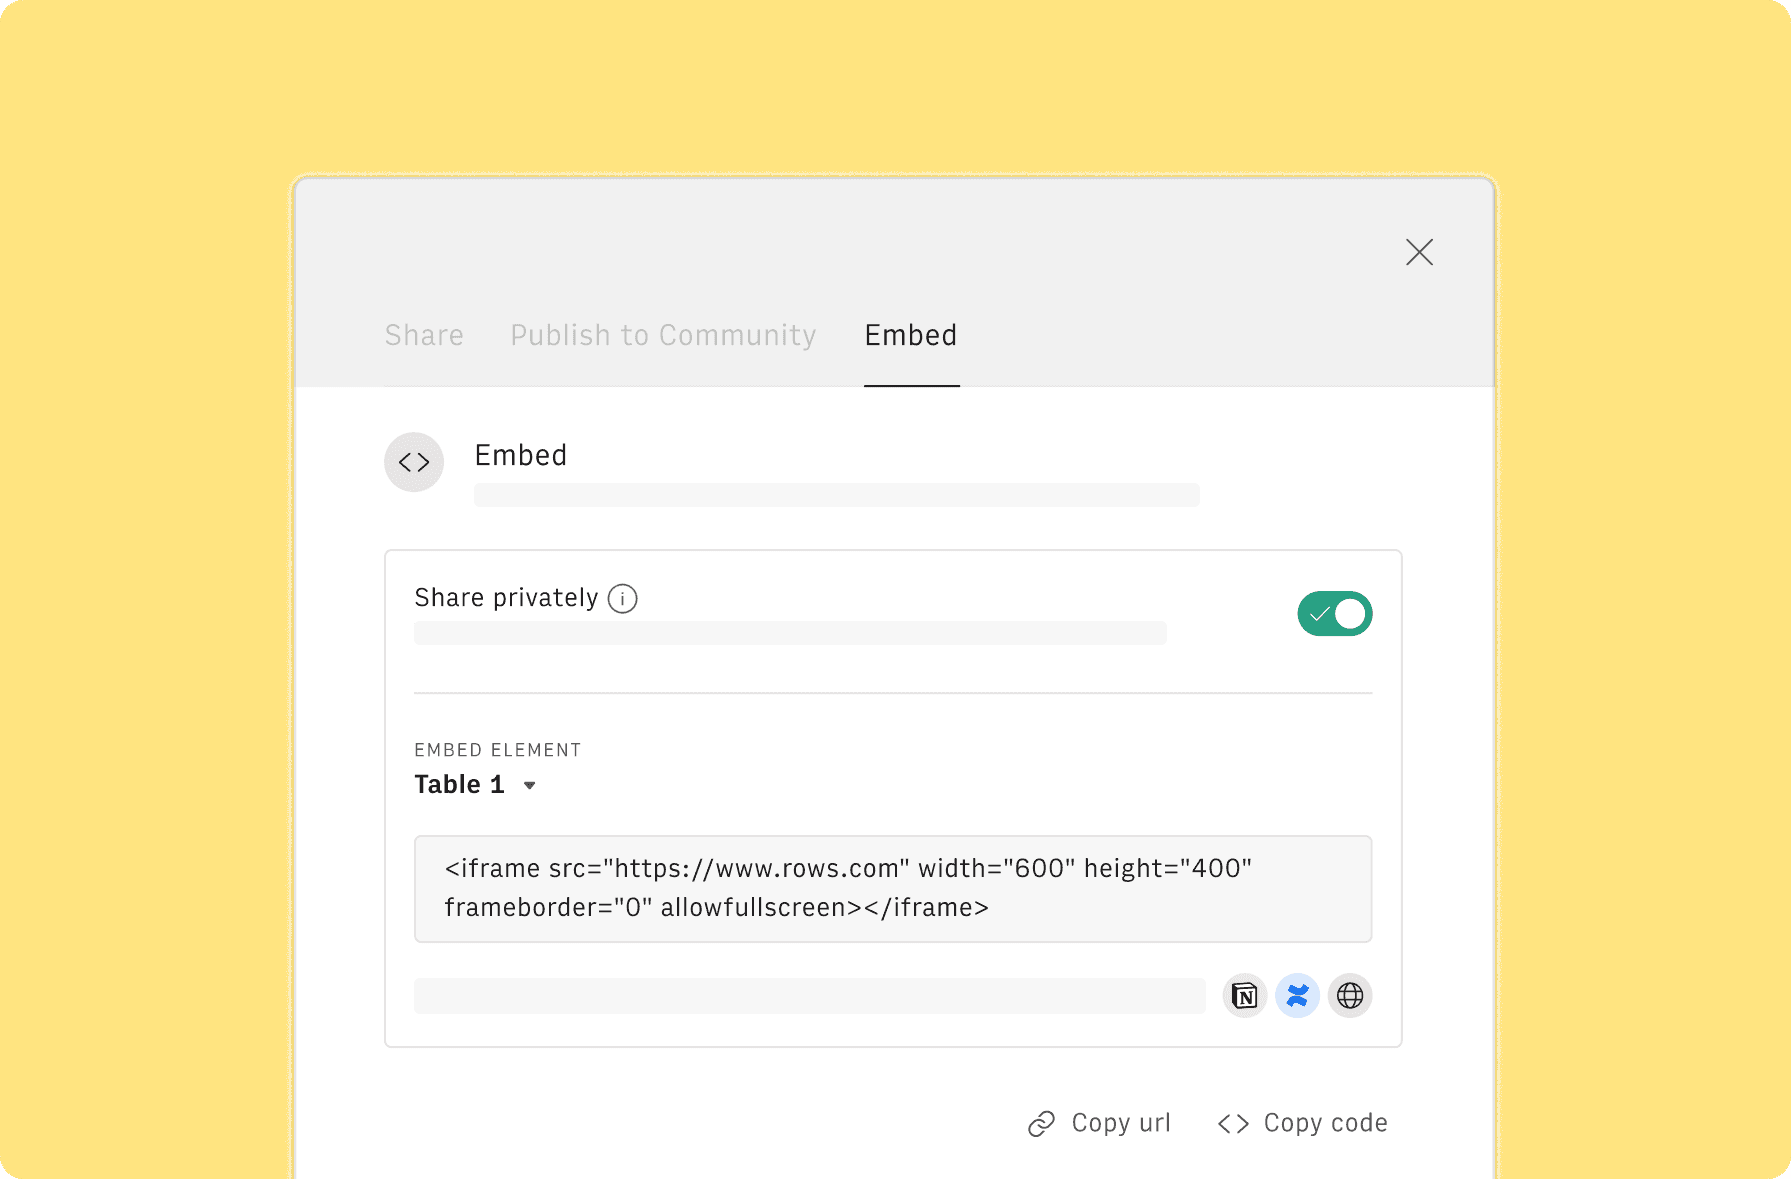
Click on the option menu to embed tables and chart on your Notion, Confluence or any other iframe-ready documents.
Questions and answers
Can I use Rows for free?
More than a Google Analytics 4 Traffic Acquisition Report
Rows is your new AI Data Analyst. It lets you extract from PDFs, import your business data, and analyze it using plain language.
Signup for free
Import your business data
Extract from PDFs and images, import from files, marketing tools, databases, APIs, and other 3rd-party connectors.
Know moreAnalyze it with AI
Ask AI✨ any question about your dataset - from VLOOKUPs to forecasting models - and surface key insights, trends, and patterns.
Know moreCollaborate and Share
Seamlessly collaborate and share stunning reports with dynamic charts, embed options, and easy export features.
Know more

