Web Analytics Dashboard
Get a complete outlook of the traffic to your website, including the best performing source/medium and landing pages.

 100% spreadsheet
 Connected to your data
 Daily+ refresh
 Embed everywhere
About Web Analytics Dashboard
What is a web analytics dashboard?
A web analytics dashboard is a visual report that presents relevant data, metrics, and performance indicators from your website in real time or over a specific period. It helps you understand visitor behaviour and overall website performance, allowing you to make more informed marketing and optimization decisions.
Want to unlock your website's full potential with our Web Analytics Dashboard? Learn how to Leverage GA4 data to gain actionable insights and drive growth effortlessly with the insights below.
Key Features of Our Web Analytics Dashboard Template
Integration with Google Analytics 4
Rows has the ability to integrate with GA4 and 49 other data sources in your marketing stack. Our dashboard templates offer seamless integration with Google Analytics 4, the next generation of analytics from Google. This integration allows you to:
- Access real-time data from GA4 directly within your custom dashboards.
- Leverage GA4's enhanced machine learning capabilities to identify trends and anomalies
- Customize data views to align with your specific business goals and KPIs.
Customizable Metrics and Visuals
At Rows, we understand that every SEO expert has unique needs and priorities for branding styles. Our dashboard template goes beyond one-size-fits-all solutions, with features like:
Flexible Metric Selection: Choose from a wide array of metrics to display, including traffic sources, conversion rates, user engagement, and more. For insights on these metrics, check the breakdown of the template in the next heading.
Dynamic Data Visualization: you can transform raw data into compelling visual stories with our diverse range of charts, graphs, and infographics. Options include line charts for trend analysis, pie charts for composition breakdowns, heat maps for user behavior, and more.
Web Analytics Dashboard breakdown: How Can You Use this Dashboard?
Our Web Analytics Dashboard leverages Google Analytics 4 (GA4) data for comprehensive website analytics reports. To access insights about your website, you must connect your GA4 account to your Rows account.
Below are a few steps on how to start out with this web analytics dashboard
Step 1: On this page, click on "Use Template".
Once done, you'll see a pop-up that shows — “Select spreadsheet destination” — click on “Create a spreadsheet.”
Step 2: Connect Google Analytics 4 (GA4) integration to Rows.
Without connecting your account, you'll be unable to access insights and analytics about your page.
Step 3: Set a date range.
By specifying a date range, you can observe ad campaign performance for a particular period of time. This allows you to identify trends, such as whether your rankings are improving, declining, or remaining stable.
Key metrics at a glance in the web analytics dashboard
- Top 5 channels by conversion
This chart identifies the most effective conversion traffic sources, helping prioritize marketing efforts and budget allocation.
- Top 5 channels by traffic
This chart shows which channels drive the most visitors, useful for understanding audience acquisition and optimizing traffic strategies.
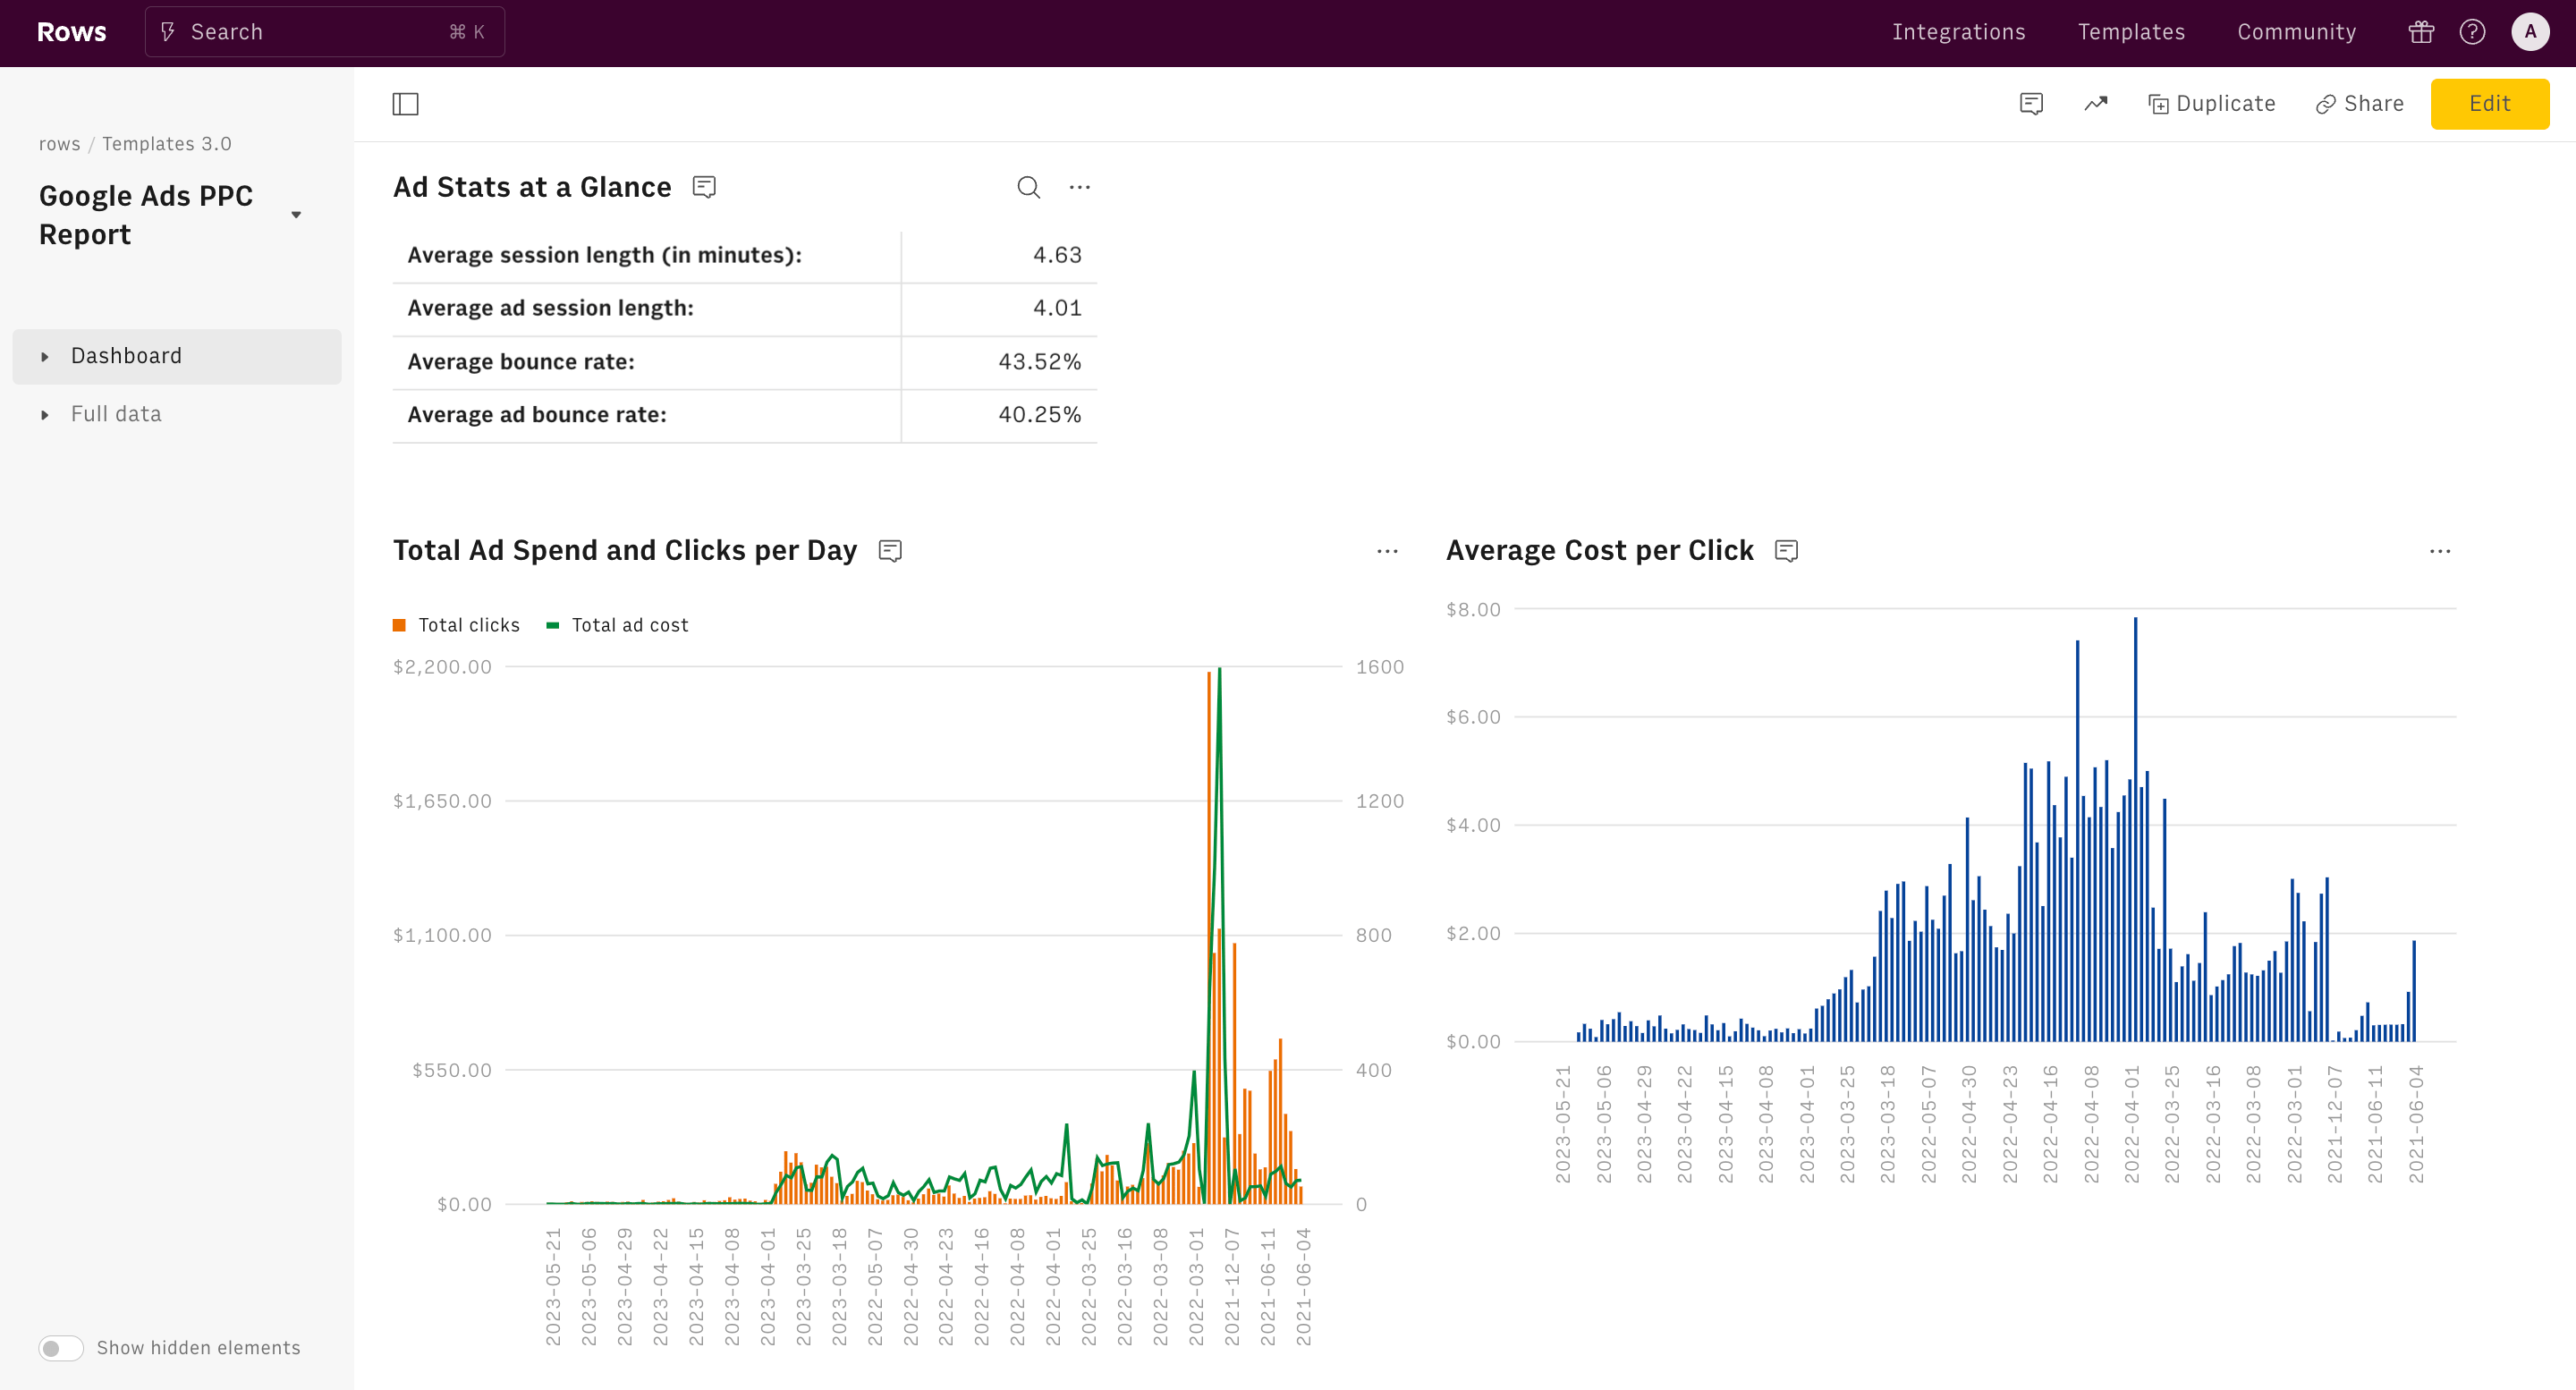
- Sessions and PageViews chart
This chart visualizes traffic patterns over time, helping identify peak periods and potential areas for improvement.
- Conversion rate chart
This chart tracks how effectively the site converts visitors into customers or leads, which is crucial for measuring overall site effectiveness.
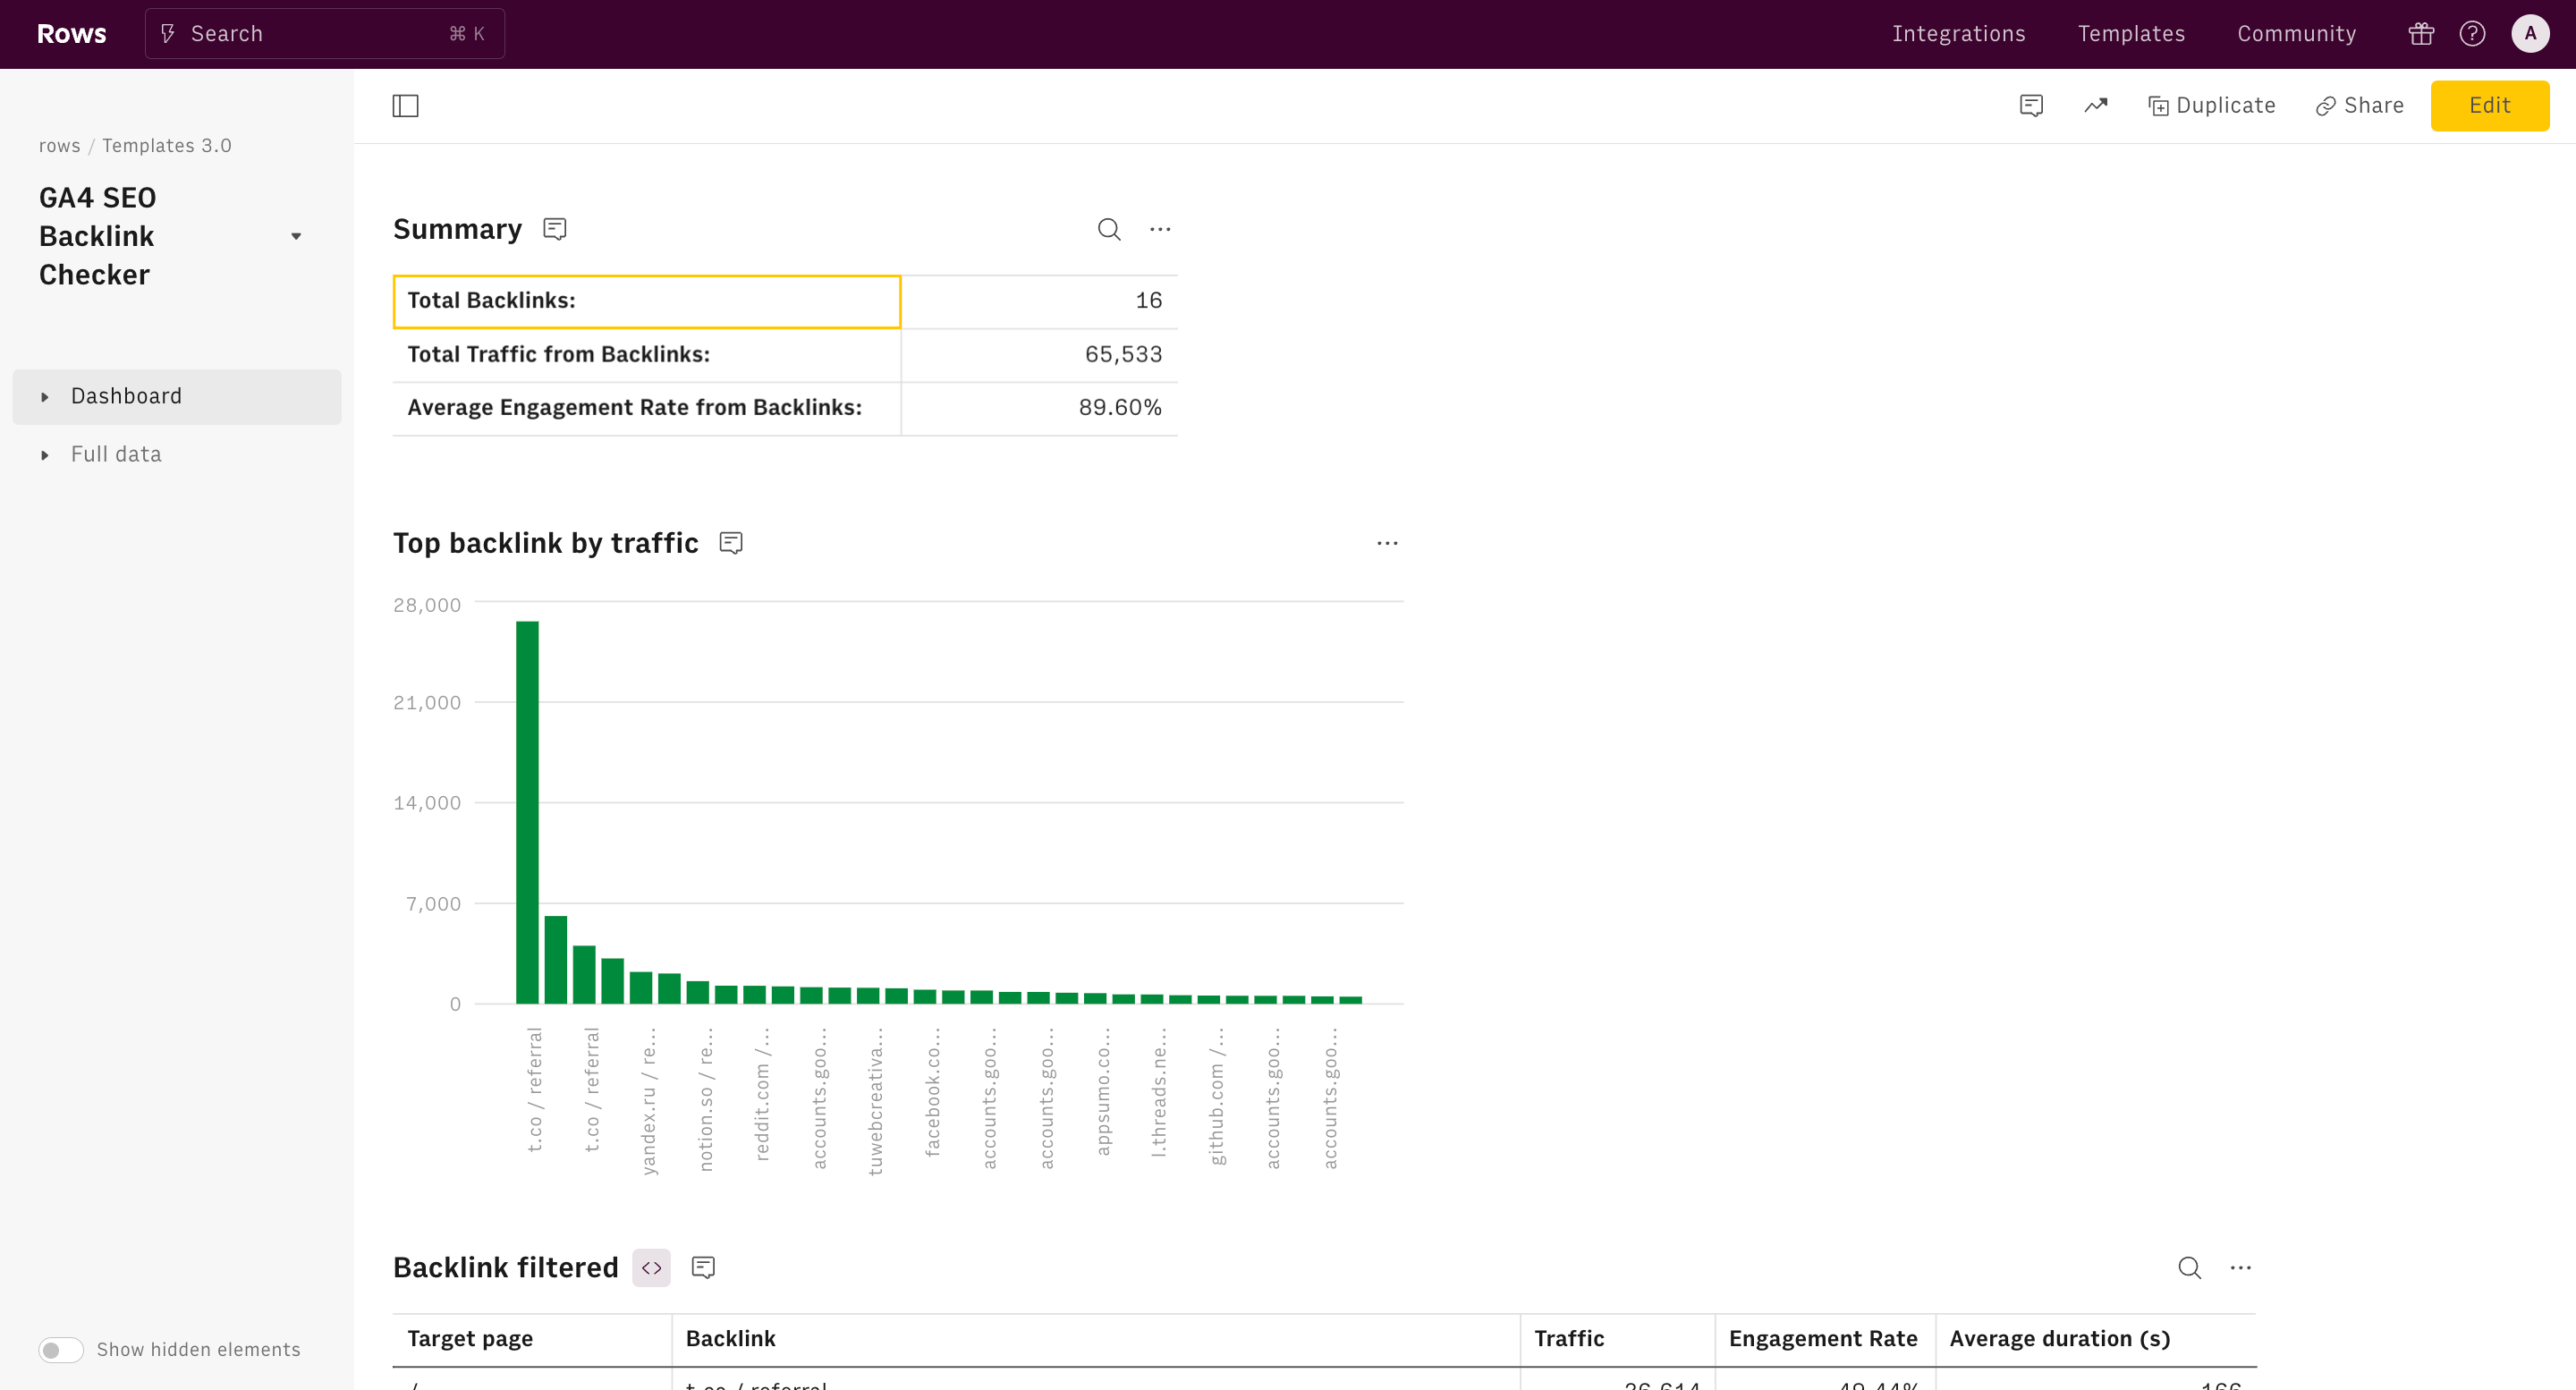
- Top 5 sources by Conversions
This table pinpoints specific referral sources driving conversions, allowing for targeted optimization of high-performing channels.
- Top 10 Source Medium by Total Users:
This table details traffic sources, useful for understanding which marketing tactics are most effective in attracting visitors.
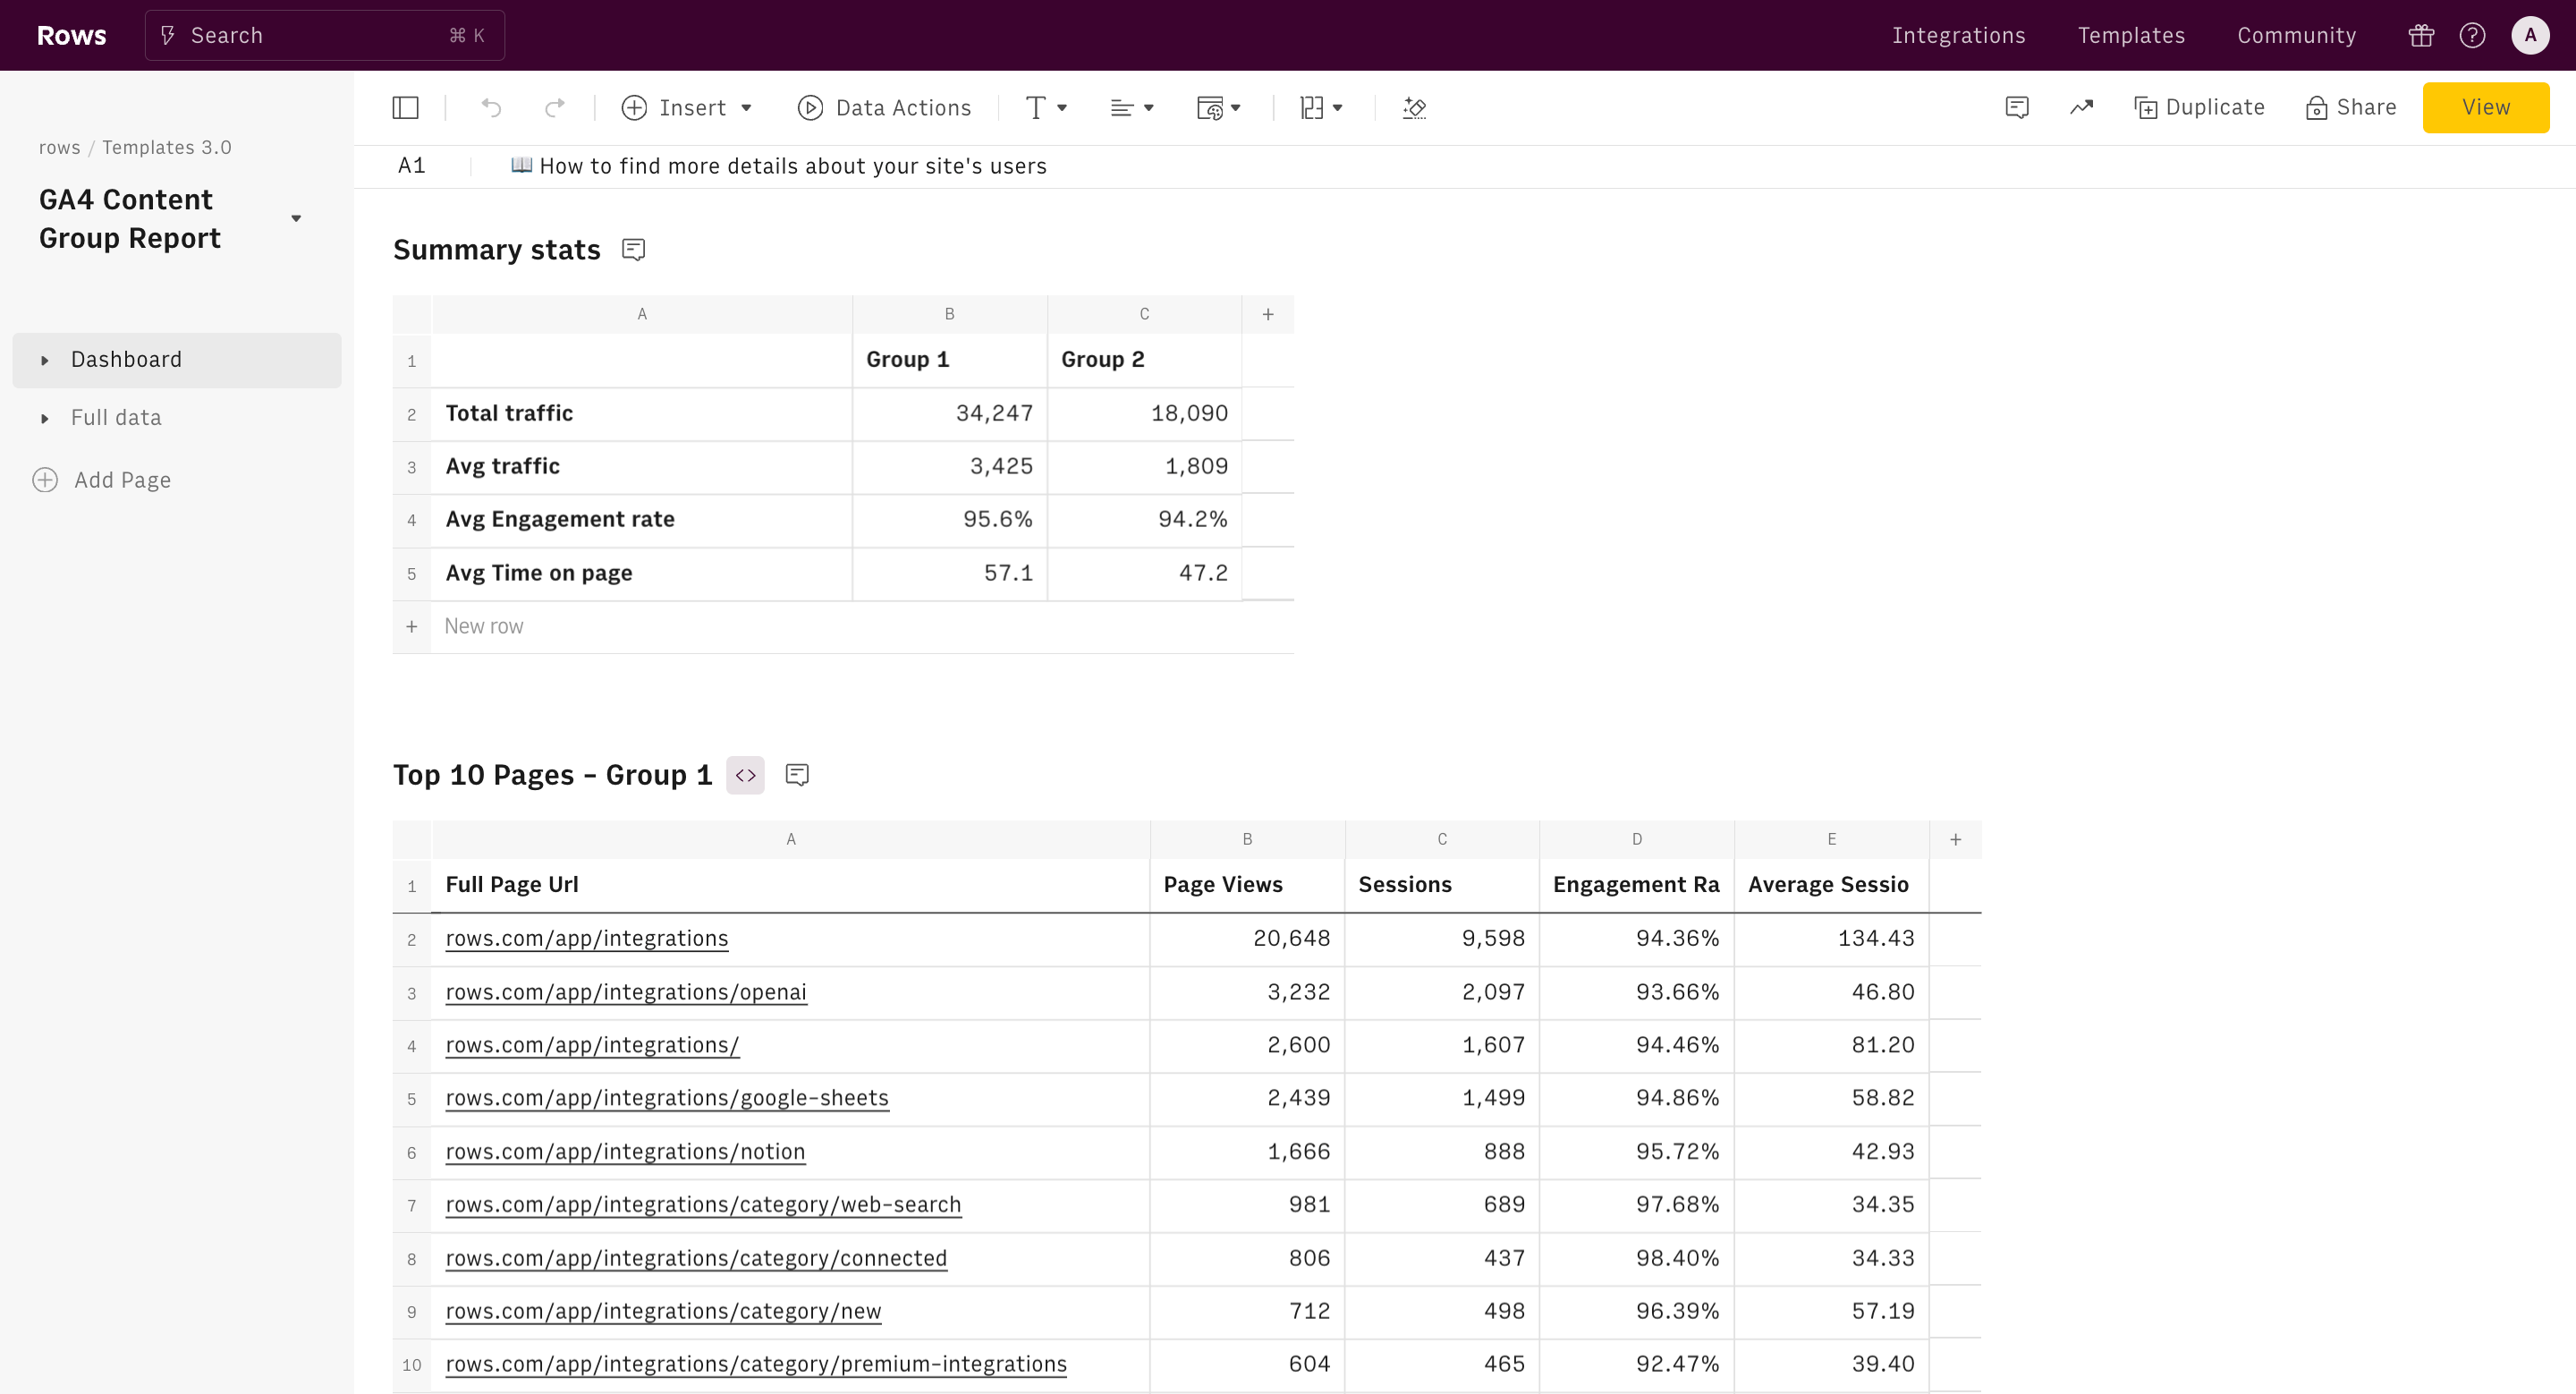
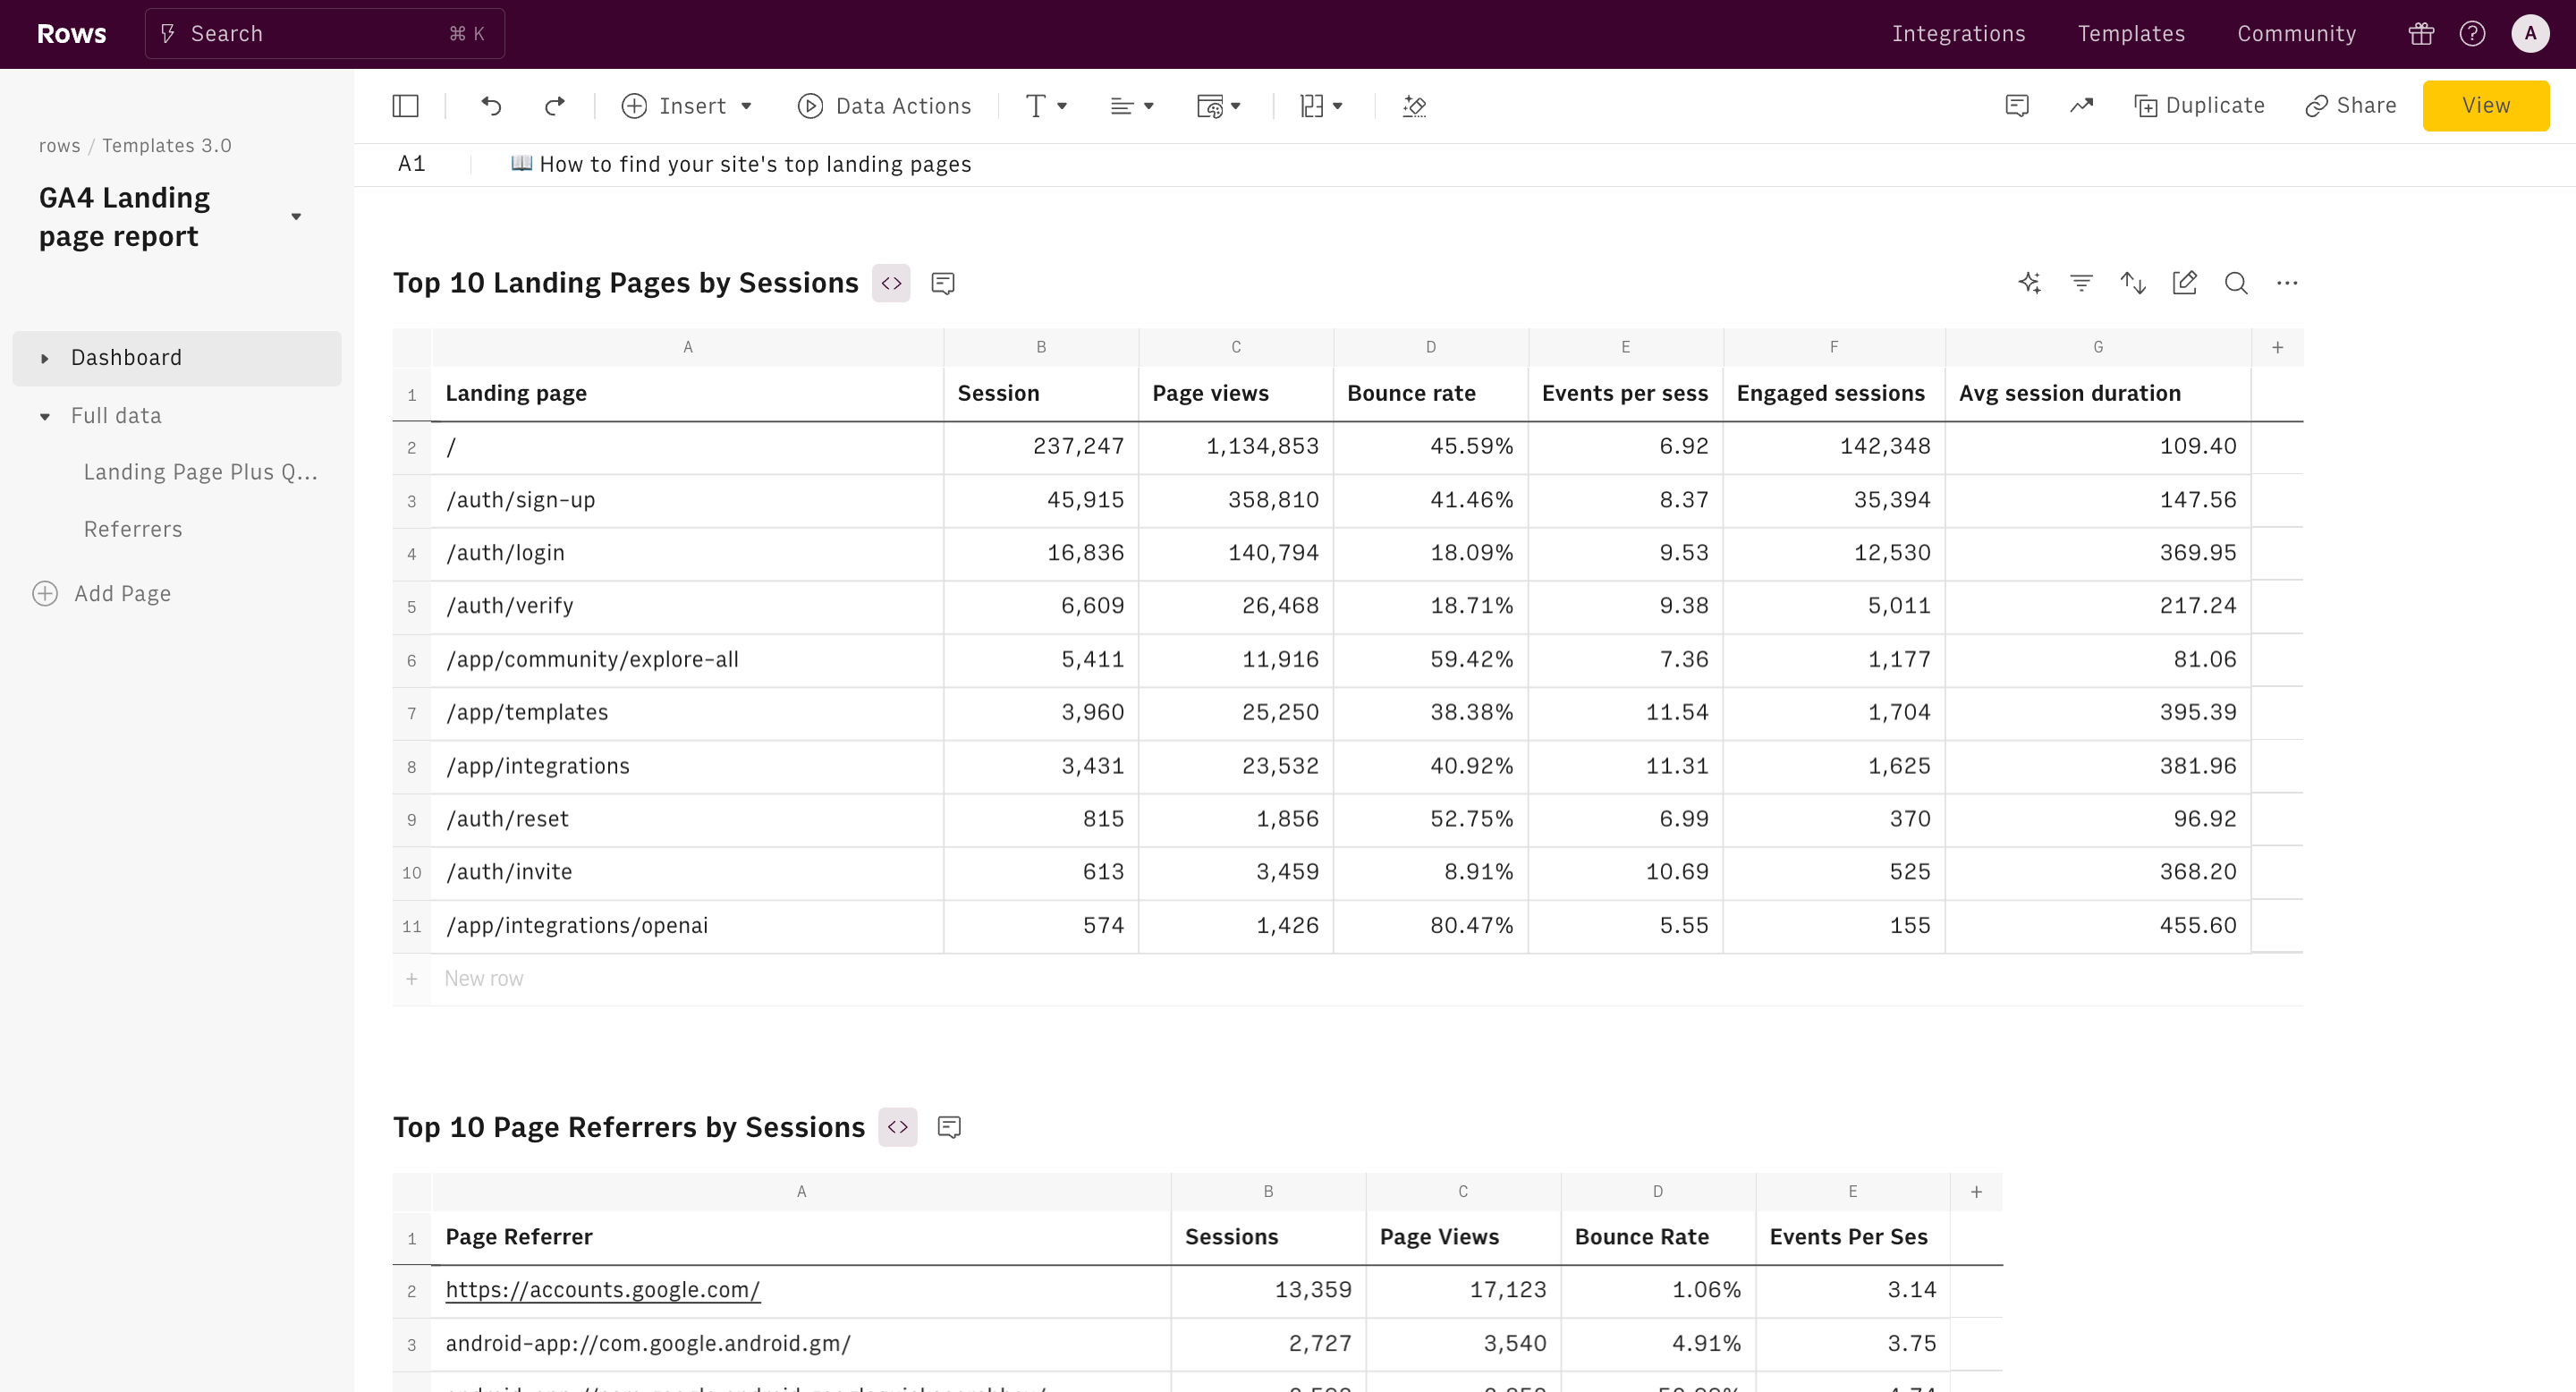
- Top 10 Landing Pages by Total Users:
This table highlights the most popular entry points to the site, helping focus optimization efforts on high-impact pages.
Benefits of using our web analytics dashboard
Monitoring metrics like user engagement, session duration, and conversion rates allows you to adjust real-time strategies and ensure optimal performance.
Here are some benefits of using our web analytics dashboard:
Gets your real-time analytics data faster.
Time is a limited commodity–especially when you’re a marketing agency or managing a client website account.
With this dashboard, you'll get real-time data quickly without worrying about manual data collection. All metrics are set on a chart to illustrate key performance indicators over a particular period of time.
Customizable Insights for SEOs and other members of the marketing team.
The diverse range of metrics and visualizations caters to different departments’ needs. Whether it's high-level KPIs for executives or granular data for marketers, this dashboard can be tailored to provide relevant insights to each team member, fostering better collaboration and alignment across departments.
Provides justification for ROI and Budget optimization.
The detailed breakdown of traffic sources, conversion rates, and user behavior provides concrete data to justify marketing spend and optimize budget allocation. This can be particularly valuable when presenting results to clients or seeking approval for new initiatives, as it demonstrates various strategies' impact on bottom-line results.
How it works


How it works
Get started
Click on 'Use template' and start using it right away. No forms, no signup. Your data first.
Connect your Google Analytics 4 account
Once landed on the spreadsheet, follow the instructions to connect the required integration and pick your account.
Customize the template and schedule refresh
Once the integration has been connected, all tables will update automatically with your own data. Click on 'Edit Source' to change the retrieved data and automate the data refresh. You can then insert a chart or a pivot table, add a column or personalize formats, using all the regular functions and shortcuts that make spreadsheets great.
Embed tables and charts
Click on the option menu to embed tables and chart on your Notion, Confluence or any other iframe-ready documents.


Questions and answers
Can I use Rows for free?
More than a Web Analytics Dashboard
Rows is your new AI Data Analyst. It lets you extract from PDFs, import your business data, and analyze it using plain language.
Signup for free

Import your business data
Extract from PDFs and images, import from files, marketing tools, databases, APIs, and other 3rd-party connectors.
Know moreAnalyze it with AI
Ask AI✨ any question about your dataset - from VLOOKUPs to forecasting models - and surface key insights, trends, and patterns.
Know moreCollaborate and Share
Seamlessly collaborate and share stunning reports with dynamic charts, embed options, and easy export features.
Know more