Google Analytics 4
Get the key metrics and analytics reporting on your website available on Google Analytics 4.
Connect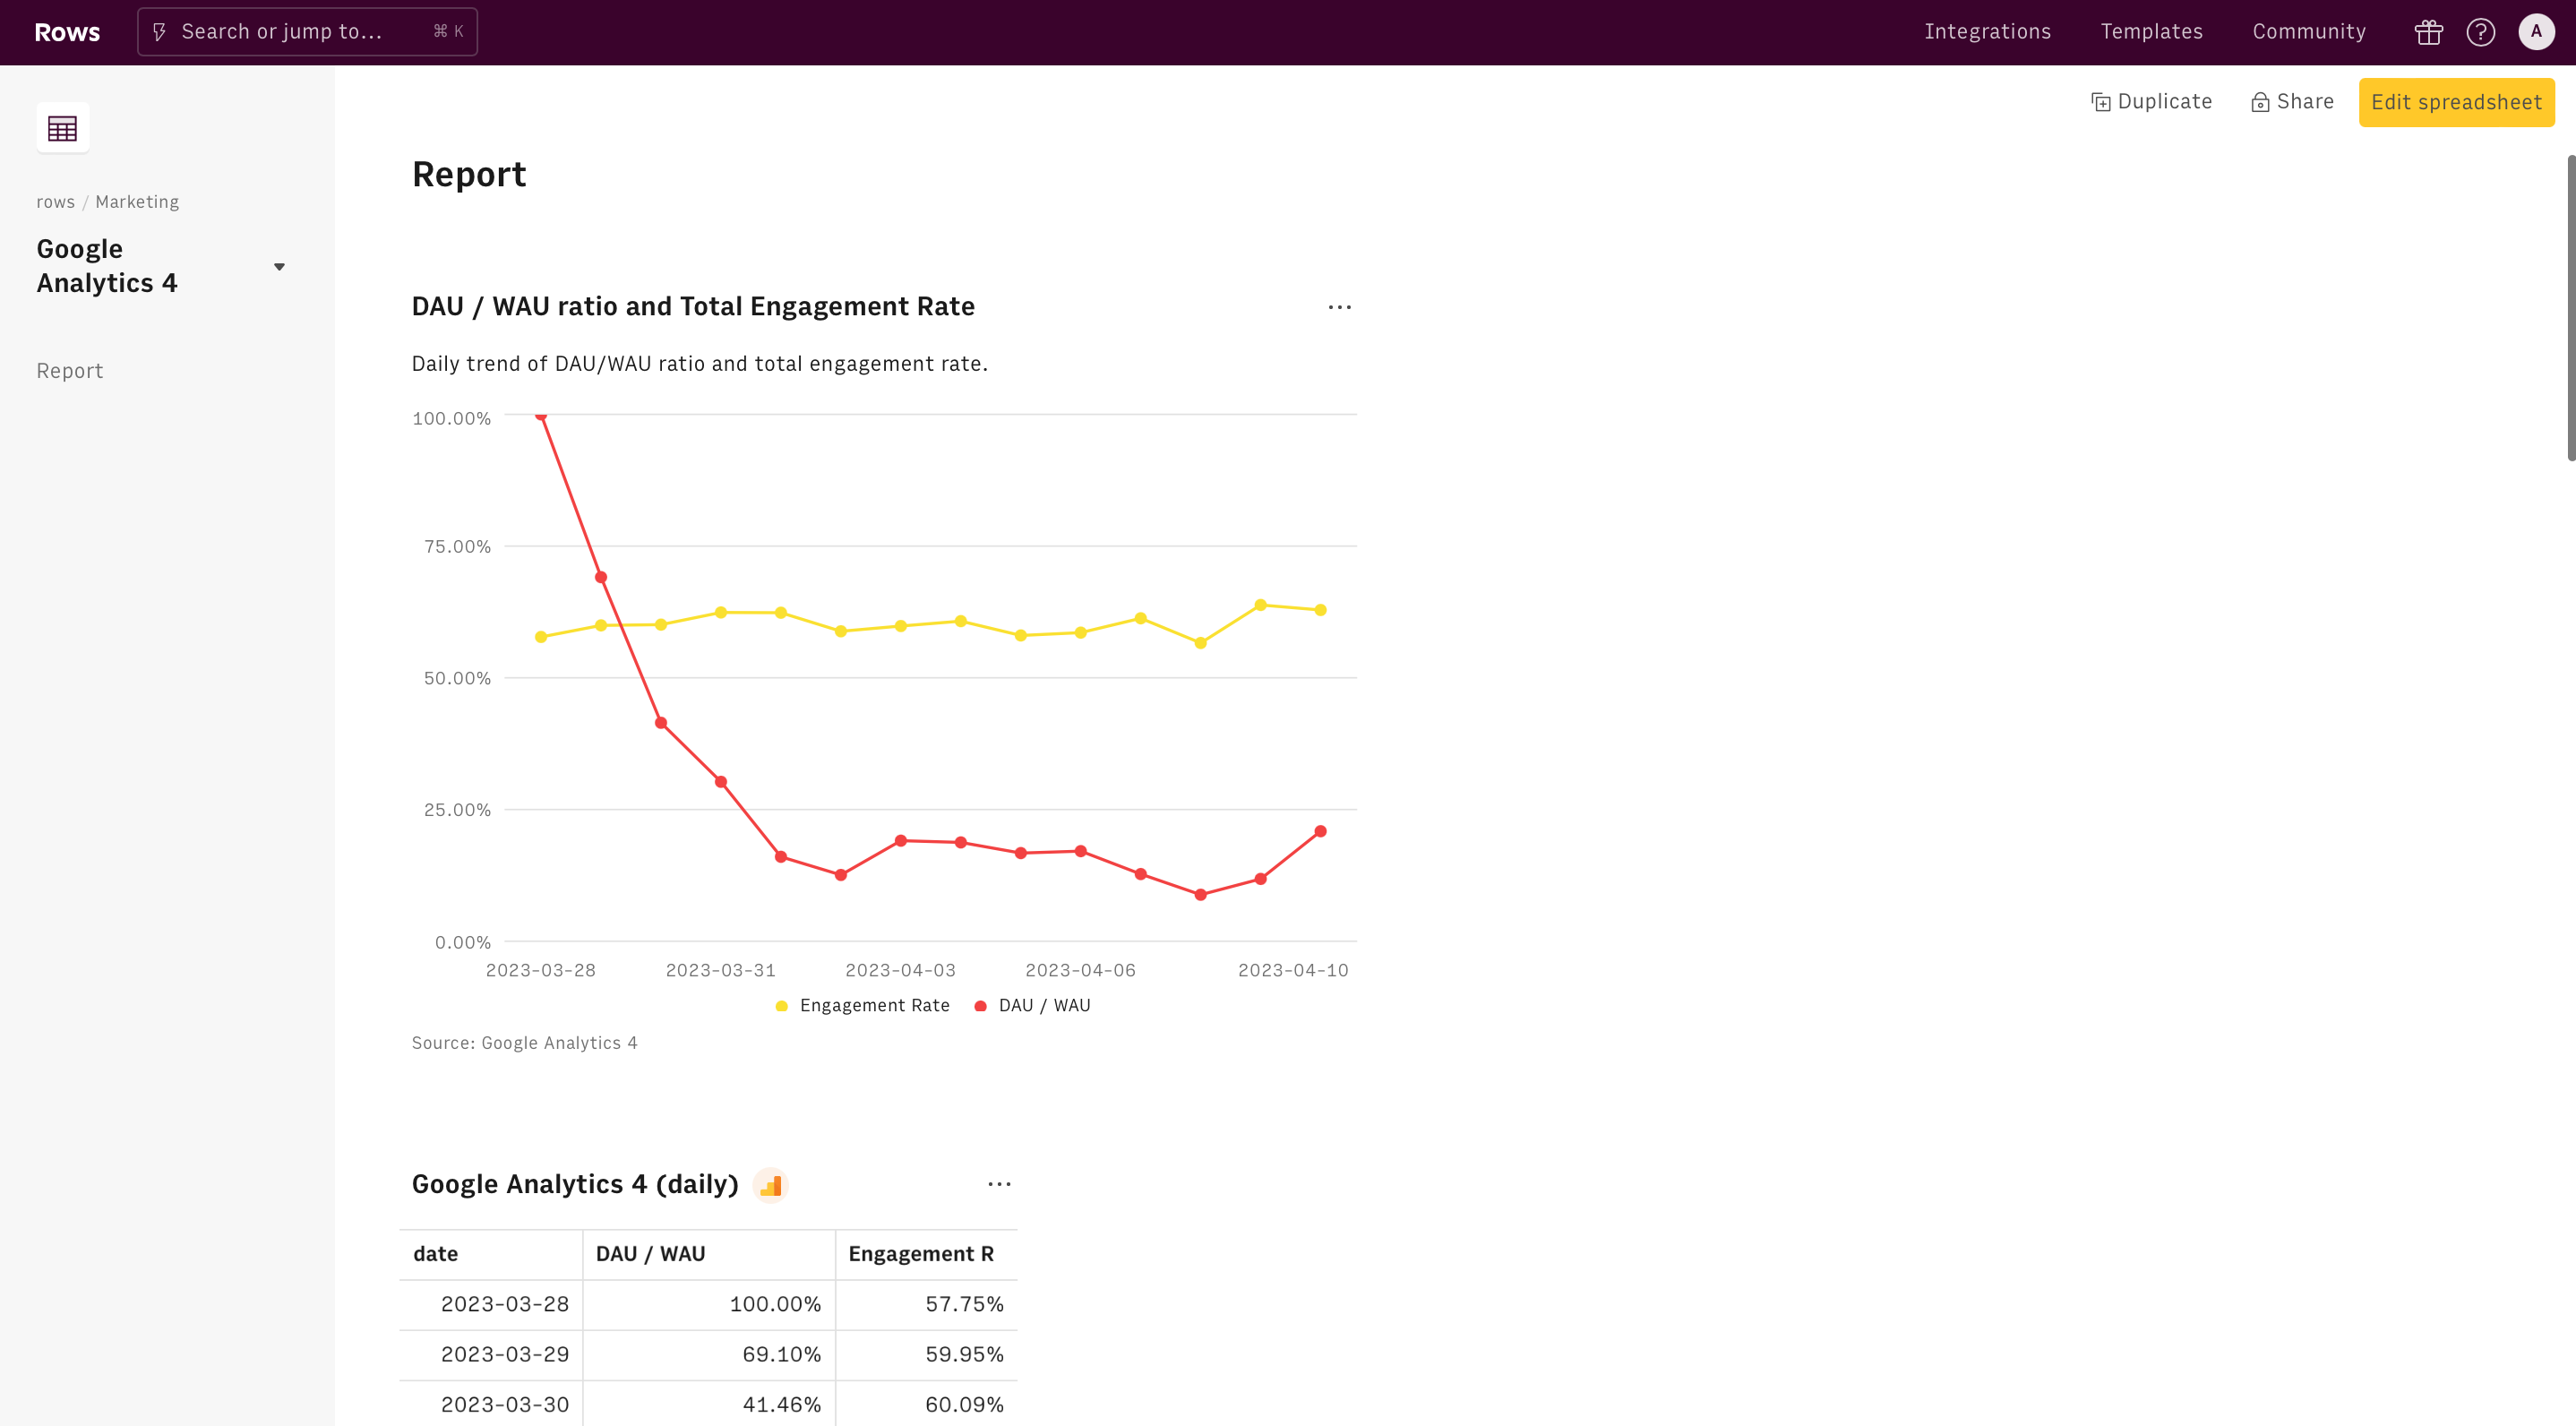
Connecting Google Analytics 4 with Rows gives you the power to query, download and export Google Analytics data, analyse your performance and make important business decisions, all with the flexibility of a spreadsheet.
First, use your Google account to connect Rows to Google Analytics 4. Then select your site ID, a date range and pick one of our preset reports: in two clicks, you will download Google Analytics data on your spreadsheet.
Thanks to our Schedule Refresh option, you can generate GA4 automated reports, just by picking your desired refresh rate (daily is free of charge).
Use Embed to export Google Analytics data into your Notion or Confluence documents, or any iframe-ready tool.
Google Analytics Universal Access (UA) will be fully replaced by Google Analytics 4 by July 2023, and there are significant differences between them. Let's go through some of them
Tracking for Apps: GA4 can track data for both websites and apps within the same property, using a measurement model similar to Google Analytics Firebase (used for mobile apps), where all interactions are captured as events.
Event-based Tracking: Unlike UA, GA4 captures all interactions as events, instead of in different hit types such as page views, transactions, and social interactions.
Session tracking: UA considers a session as the period during which a user is actively engaged with a website. In UA, sessions end after 30 minutes of inactivity (or your session timeout settings), or if the clock strikes midnight (resulting in a new session), or if new campaign parameters are encountered. In contrast, GA4 generates a session ID when a session_start event occurs, and all subsequent events within that session are associated with that session ID. Sessions in GA4 can span across midnight, and they are not affected by new campaign parameters. However, if your website has a global audience, you may notice disparities in the session figures you see for UA and GA4.
GA4 Bounce Rate: Bounce Rate in GA4 is computed differently than UA. As per GA4, the Bounce Rate is the inverse (opposite) of Engagement rate: this means that, if out of 100 sessions, 40 were not 'engaged' then your Bounce Rate is 40%. Google Analytics UA classifies Bounce Rate as the percentage of sessions that contain a single page view on your website. For example, if a user visits only 1 page of your website, and another visits two pages, you will have a 50% bounce rate. This is because half of the sessions contained a single page view. Nowadays, pages are more engaging and allow user to perform a multitude of actions, and thus stay longer: as a result, your website can generate high engagement even on one single page. As a result, UA bounce rate would have underestimate engagement substantially.
GA4 Engagement Rate: GA4 computes Engagement Rate as the ratio between all Engaged Sessions and Total Sessions. A session is considered 'Engaged' if it lasts longer than 10 seconds, has a key events, or has at least 2 pageviews or screenviews.
Google Analytics sampling: Google Analytics 4 sampling is a data collection method that processes a subset of user data to estimate website traffic trends, rather than analyzing all data due to volume constraints. Unlike Universal Analytics (UA), GA4's approach to sampling is more adaptive, relying on machine learning to analyze larger datasets without significantly compromising data accuracy. GA4 provides more detailed and comprehensive insights, especially for high-traffic sites, by efficiently managing vast amounts of data compared to UA's more straightforward, but less scalable sampling methods.
What data does the realtime report show?: Due to GA4's event-based model, its real-time reports offers a granular look at user interactions, such as events and conversions, in contrast to UA's session-based model that centers on pageviews and sessions. GA4 enhances real-time insights with a modern interface, detailed engagement data, and an integrated view of traffic sources and user actions, while UA provides a more straightforward visualization of live data, emphasizing volume of users and page views.
Export to BigQuery: With GA4, you can export data to BigQuery for free, which is a feature that was only available to Analytics 360 properties in UA. This means that you can send raw events to BigQuery, which you can then query using SQL.
Account Structure: In UA, the account structure contains three elements: Account - Property - View. In GA4, there are only two elements: account and property. GA4 introduces the concept of data streams, which represent a flow of data from your website or app to Analytics. Unlike UA, which collects data at the property level with a tracking ID, GA4 collects data at the stream level via a unique data stream ID. Each GA4 property can have up to 50 data streams, and there is a limit of 30 app data streams. GA4 does not include any views within its properties.
Use cases
Things you can do when using Google Analytics 4 with Rows include:
- Retrieve Google Analytics website metrics from multiple properties and create custom automated reports and dashboards. Then, publish it in View mode and share seamlessly with your team members.
- Break down the GA4 Engagement Rate by every significant dimension in a few clicks.
- Retrieve the GA4 Bounce Rate in your reports, and break it down by every significant dimensions.
- Display the number of Engaged Sessions GA4 and immediately spot the best performing pages of your site.
- Step up your analytics reporting game by mixing GA4 data with Google Search Console data and map the whole user funnel.
- Automate your analytics reporting by scheduling a daily refresh, embed charts and tables on your recurring documents in Notion and Confluence
- Automate your analytics reporting by setting up an email notification whenever new data is available with our gmail integration.
- Automate your analytics reporting process and send the daily, weekly, or monthly metrics to a Slack user or a Slack channel.
About Google Analytics 4
Google Analytics is a free Web analytics service that provides statistics and basic analytical tools for search engine optimization (SEO) and marketing purposes. As of 2019, Google Analytics is the most widely used web analytics service on the web.
marketingplatform.google.com/about/analytics/GET_METRICS_GOOGLE_ANALYTICS_4
Get a report with Google Analytics 4 metrics within a date range. Dimensions and filters are also available.
Google Analytics 4 content to help you get started!