Intro
Over the last decade, the advent of social networks, Facebook, Instagram, and LinkedIn completely changed the way businesses interact with their target consumers. After starting mainly as a mean of entertainment, companies quickly realized the importance of their social media presence and are actively trying to come up with new ways to make a lasting impression on consumers all over.
Among all the metrics, the number of followers is a relevant one because it is a symbol of relevancy, popularity, and importance. Following a profile on social media puts its updates directly on your feed, allowing you to get updated when new relevant content is published. From a business perspective, this opens a smooth avenue to conversate with your potential clients, allowing you to deliver quality content. Furthermore, a spillover effect is in place: followers make a business look more reliable, being a source of credibility for other potential clients.
In this short guide, we’ll walk you through building an easy spreadsheet to monitor the follower-base growth of your main social media accounts.
Here is a sneak peek of what you will get:
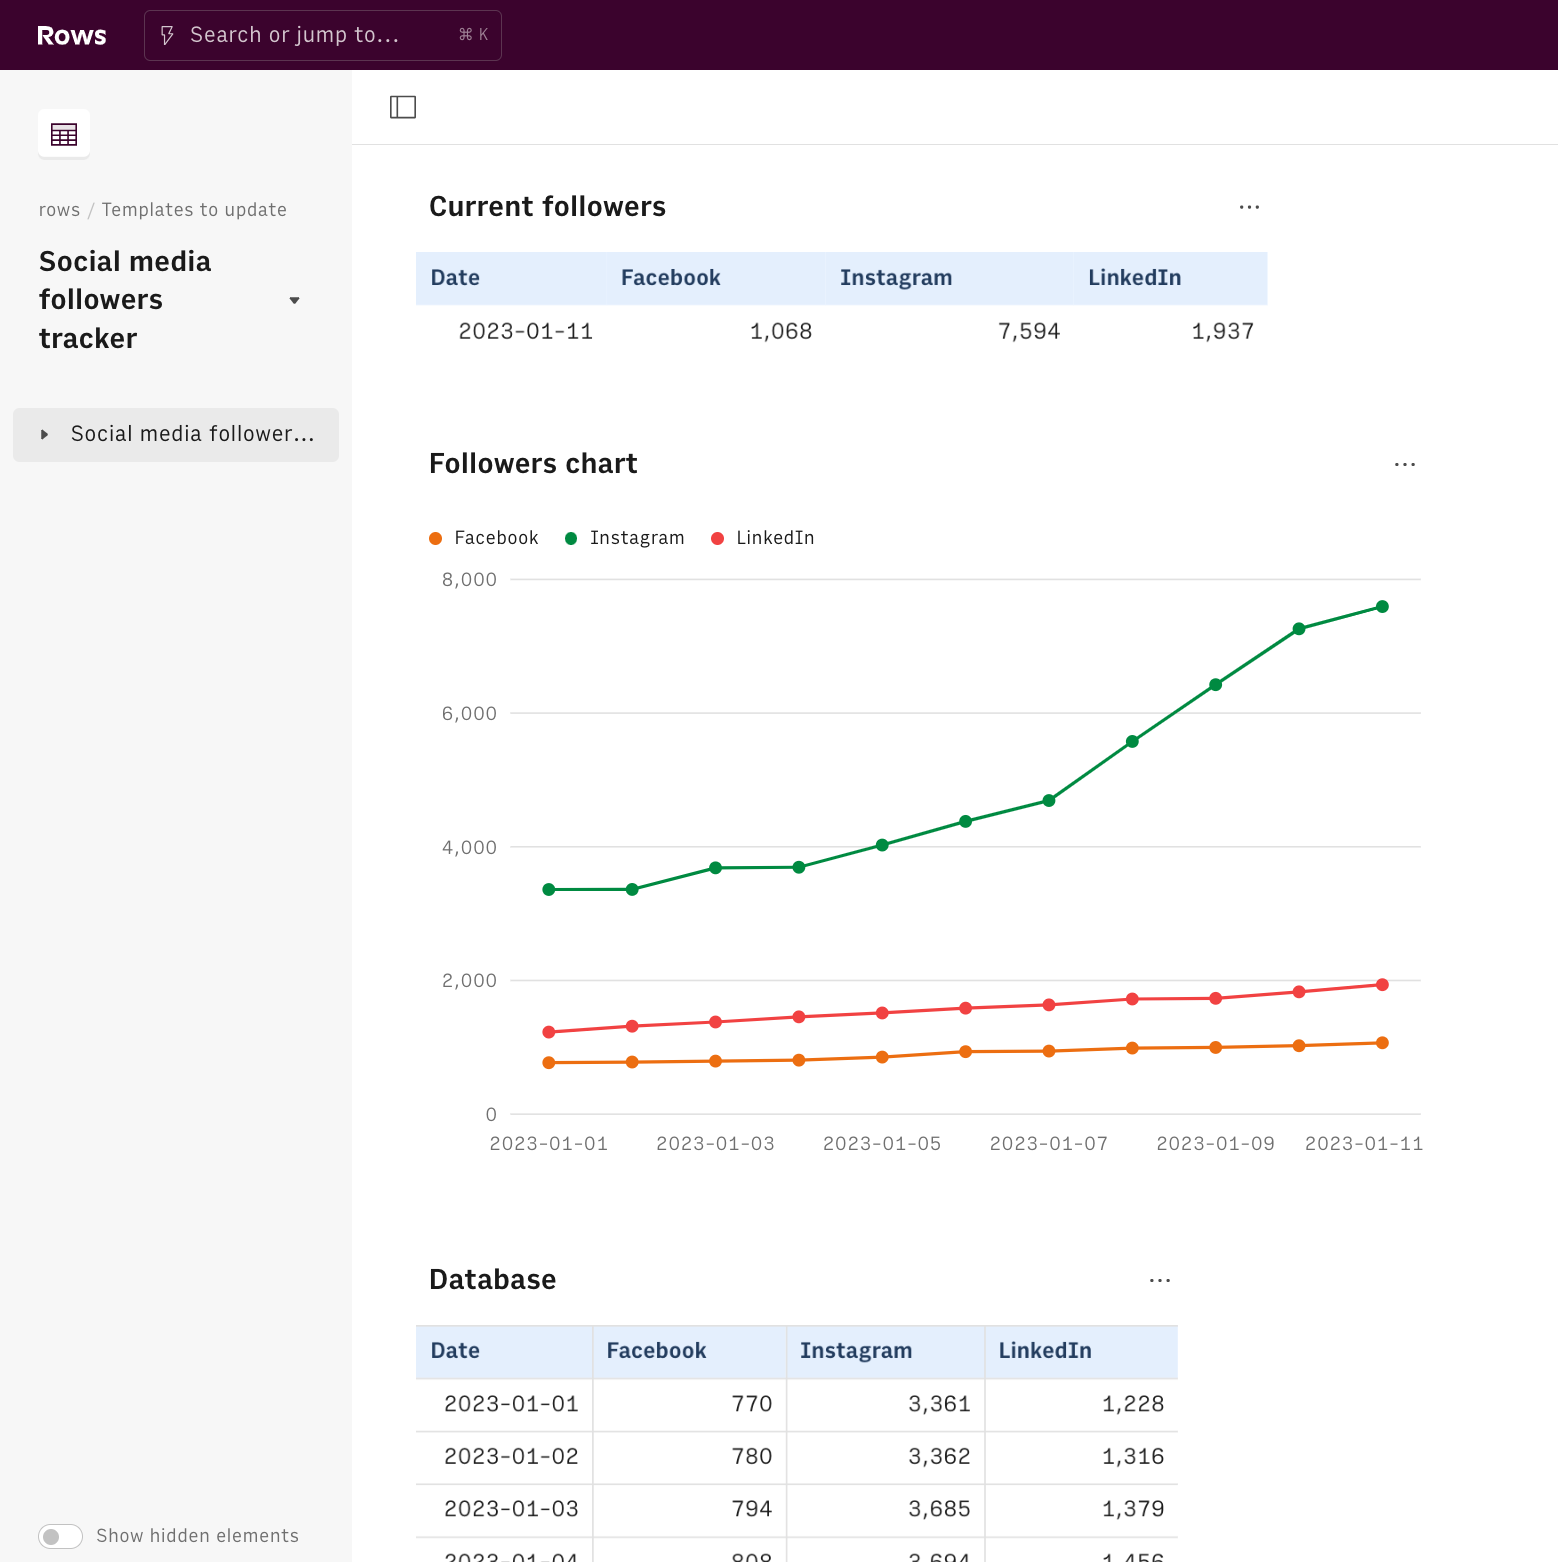
Let's go!
First of all, use our template at the following link Social media followers tracker and save it in one of your workspace's folders.
This template provides you with a unique dashboard to monitor the growth of all your follower base on the four main social media: Facebook, Instagram, and Linkedin.
Let's reverse-engineer it together.
First of all, you need to enable Rows data integration and connect your social media account to Rows. Click on the top modal and then follow the instructions. Alternatively, click on the following links:
Following each of the links above, the typical Auth page will open: enter your credentials and authorize Rows to retrieve your data.
Check this out
To enable the Facebook or Instagram integration in Rows, you must have respectively:
- a Facebook page
- an Instagram Business or Creator account, linked to a Facebook Page
See here how to set up a Creator account on Instagram.
Now you are back on the spreadsheet, ready to set it up. In cells B1:B4 of the Setup table, input your account names. Cell B6 offers you some options to set the refresh rate, that is the frequency at which Rows will automatically update the dashboard data. Let's pick "every day at 08:00", and turn on tracking, as follows:
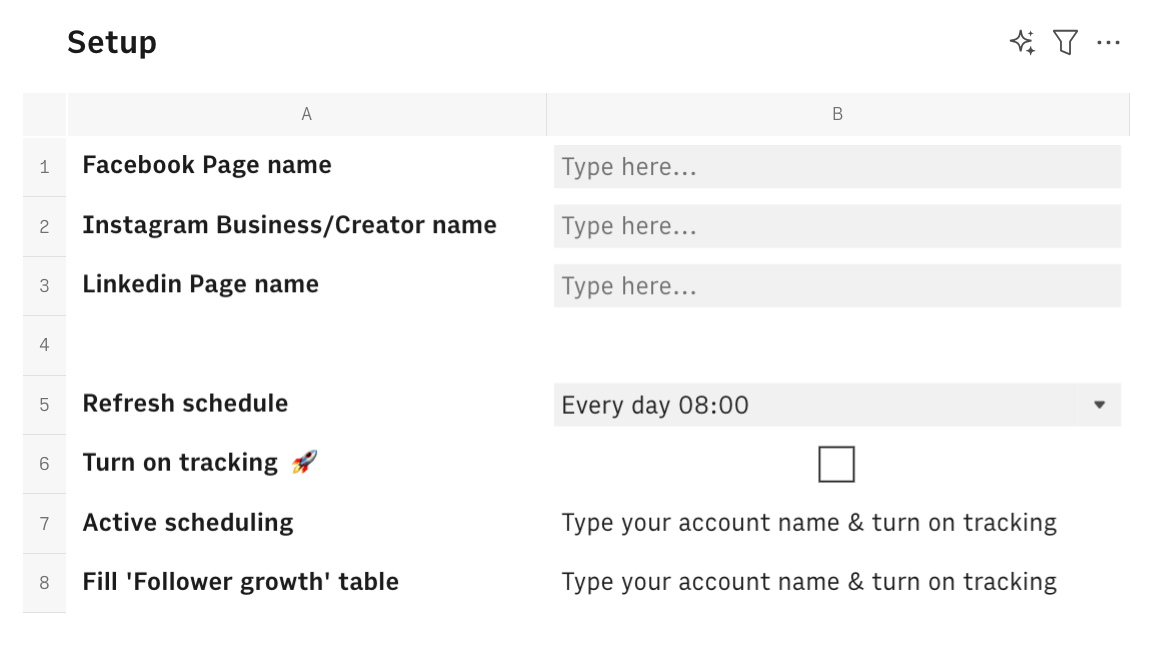
Cell B7 and B8 enclose two important automation jobs for this template to work: the SCHEDULE() function triggers automatically the cells in the 'Current followers' table ('Current followers'!A1:E2, the first argument) to recompute the counts at the selected frequency (B6 the second argument):
1 =SCHEDULE('Current followers'!A2:E2,B6)The UPDATE() function is responsible for building the log, that is storing daily snapshots in the 'Database' table.
1 =UPDATE('Current followers'!A1:E2,'Database'!A1,'Database'!A1:E1)Let's do a deep dive into it.
- The first argument contains the data to be added, including the header,i.e.
'Current followers'!A1:E2, the current followers' calculation - The second is the key(s) to be used as a reference to check the content of the destination table and decide whether or not to update the table, here the date,
'Database'!A1 - The third one is the destination header, the 'Database table', here
'Database'!A1:E1
The Current followers table
The table 'Current followers' gives you a snapshot of the current state of the specific account showing the followers count for each account. Let's go through them one by one:
- Date displays the current day date, through the function
TODAY() - Facebook displays the number of followers of your Facebook page, through the function
GET_FOLLOWERS_FACEBOOK()

- Instagram displays the number of followers of your Instagram account, through the function
GET_FOLLOWERS_INSTAGRAM()

- LinkedIn displays the number of followers of your LinkedIn page, through the function
GET_FOLLOWERS_LINKEDIN()

The database table
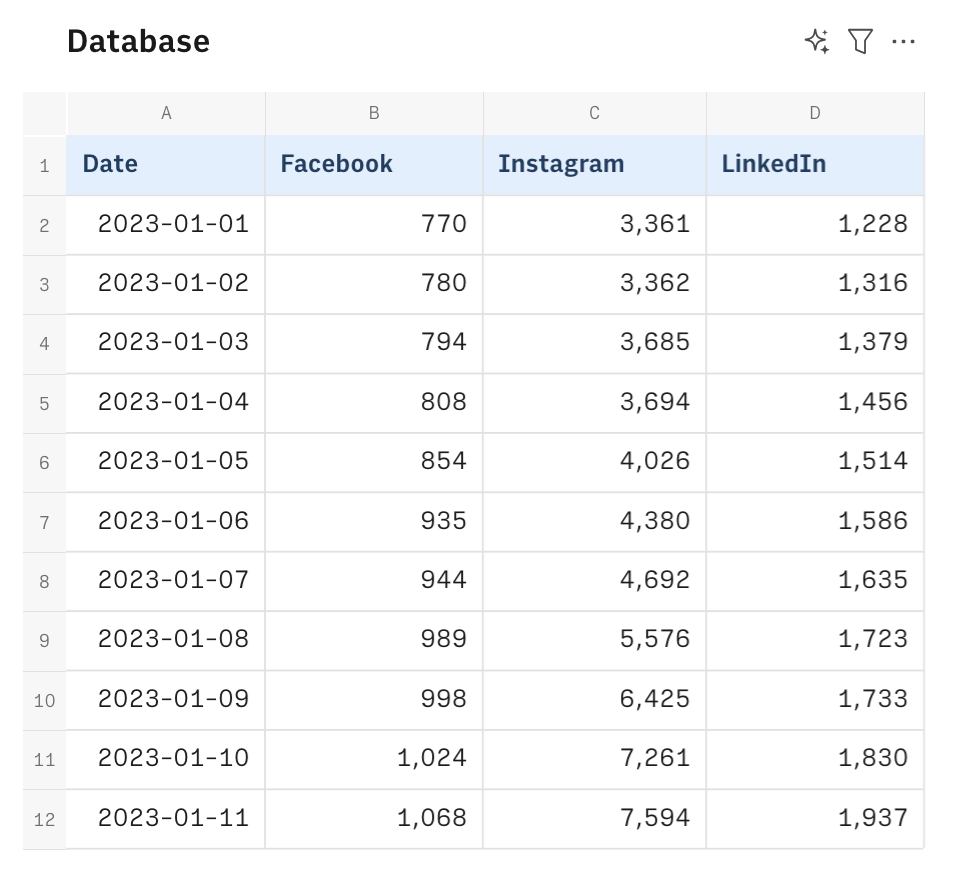
This table is built thanks to the UPDATE() function in cell B8 of the 'Setup' table and represents a log of all the data that the 'Current followers' table fetched at the desired schedule.
As time goes by, at the desired schedule, the spreadsheet will fetch the new data, and add it to the database table, as follows:
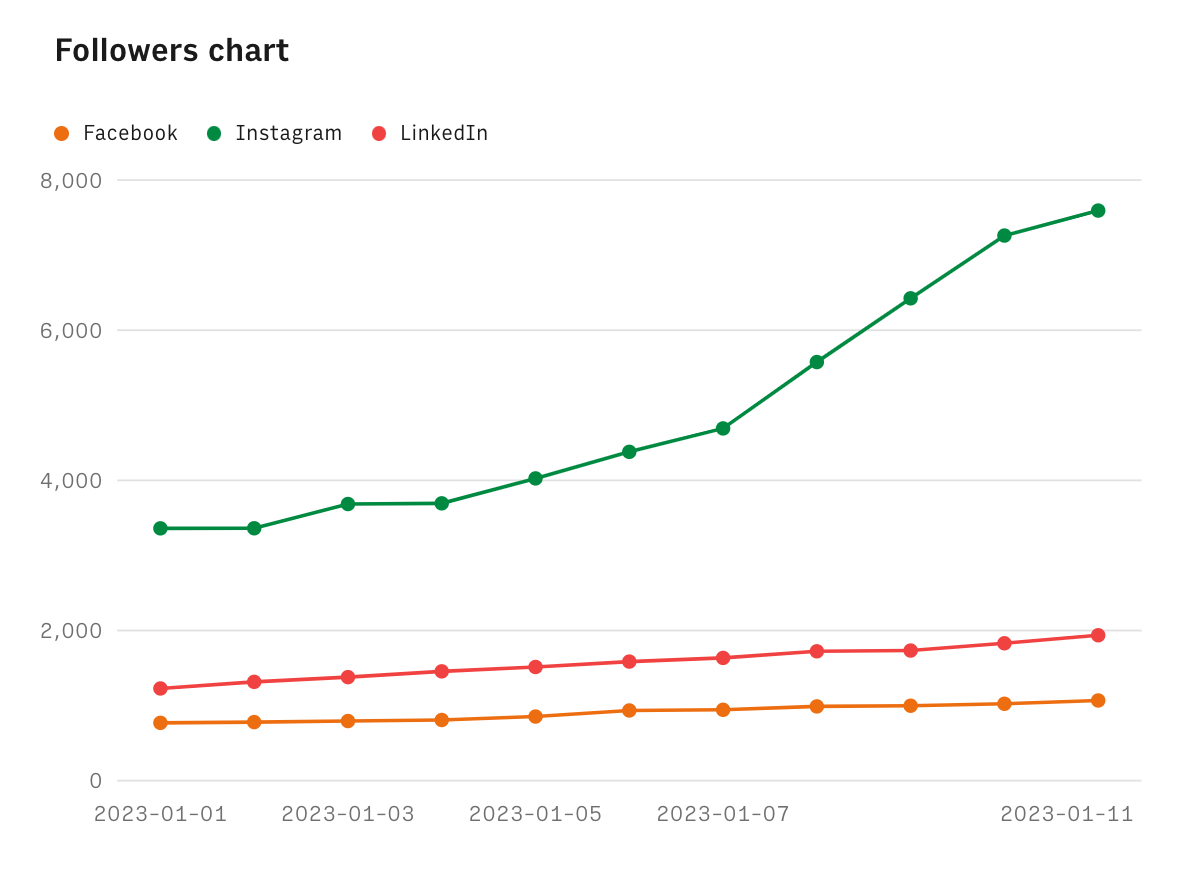
A chart helps you visualize trends in the 'Database' tables. To build it, we just selected the whole source table with unbounded range - here 'Database'!A1:E - and click on Chart under the Insert menu in the toolbar.
Embed into documents
Finally, if you are using Notion or any other internal tools that support iframes to build a report, you can embed any table or chart of this spreadsheet in your document. Just click on the ... icon in the top right corner of any table or chart and pick Embed. A modal will open, as follows:
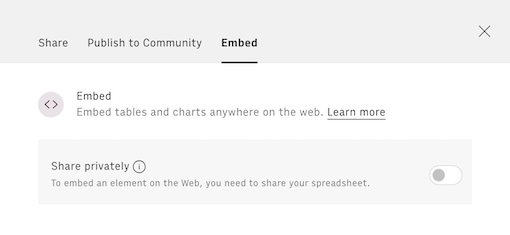
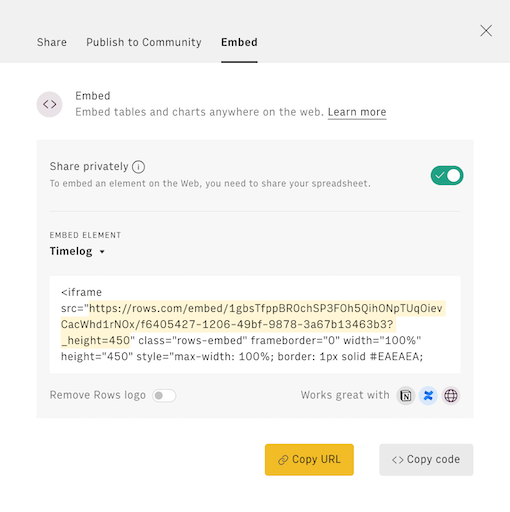
Before embedding, you need to grant access to it. To do so, toggle on the Share privately option and then hit the Copy URL button: your element is now ready to be pasted into your favorite tool.
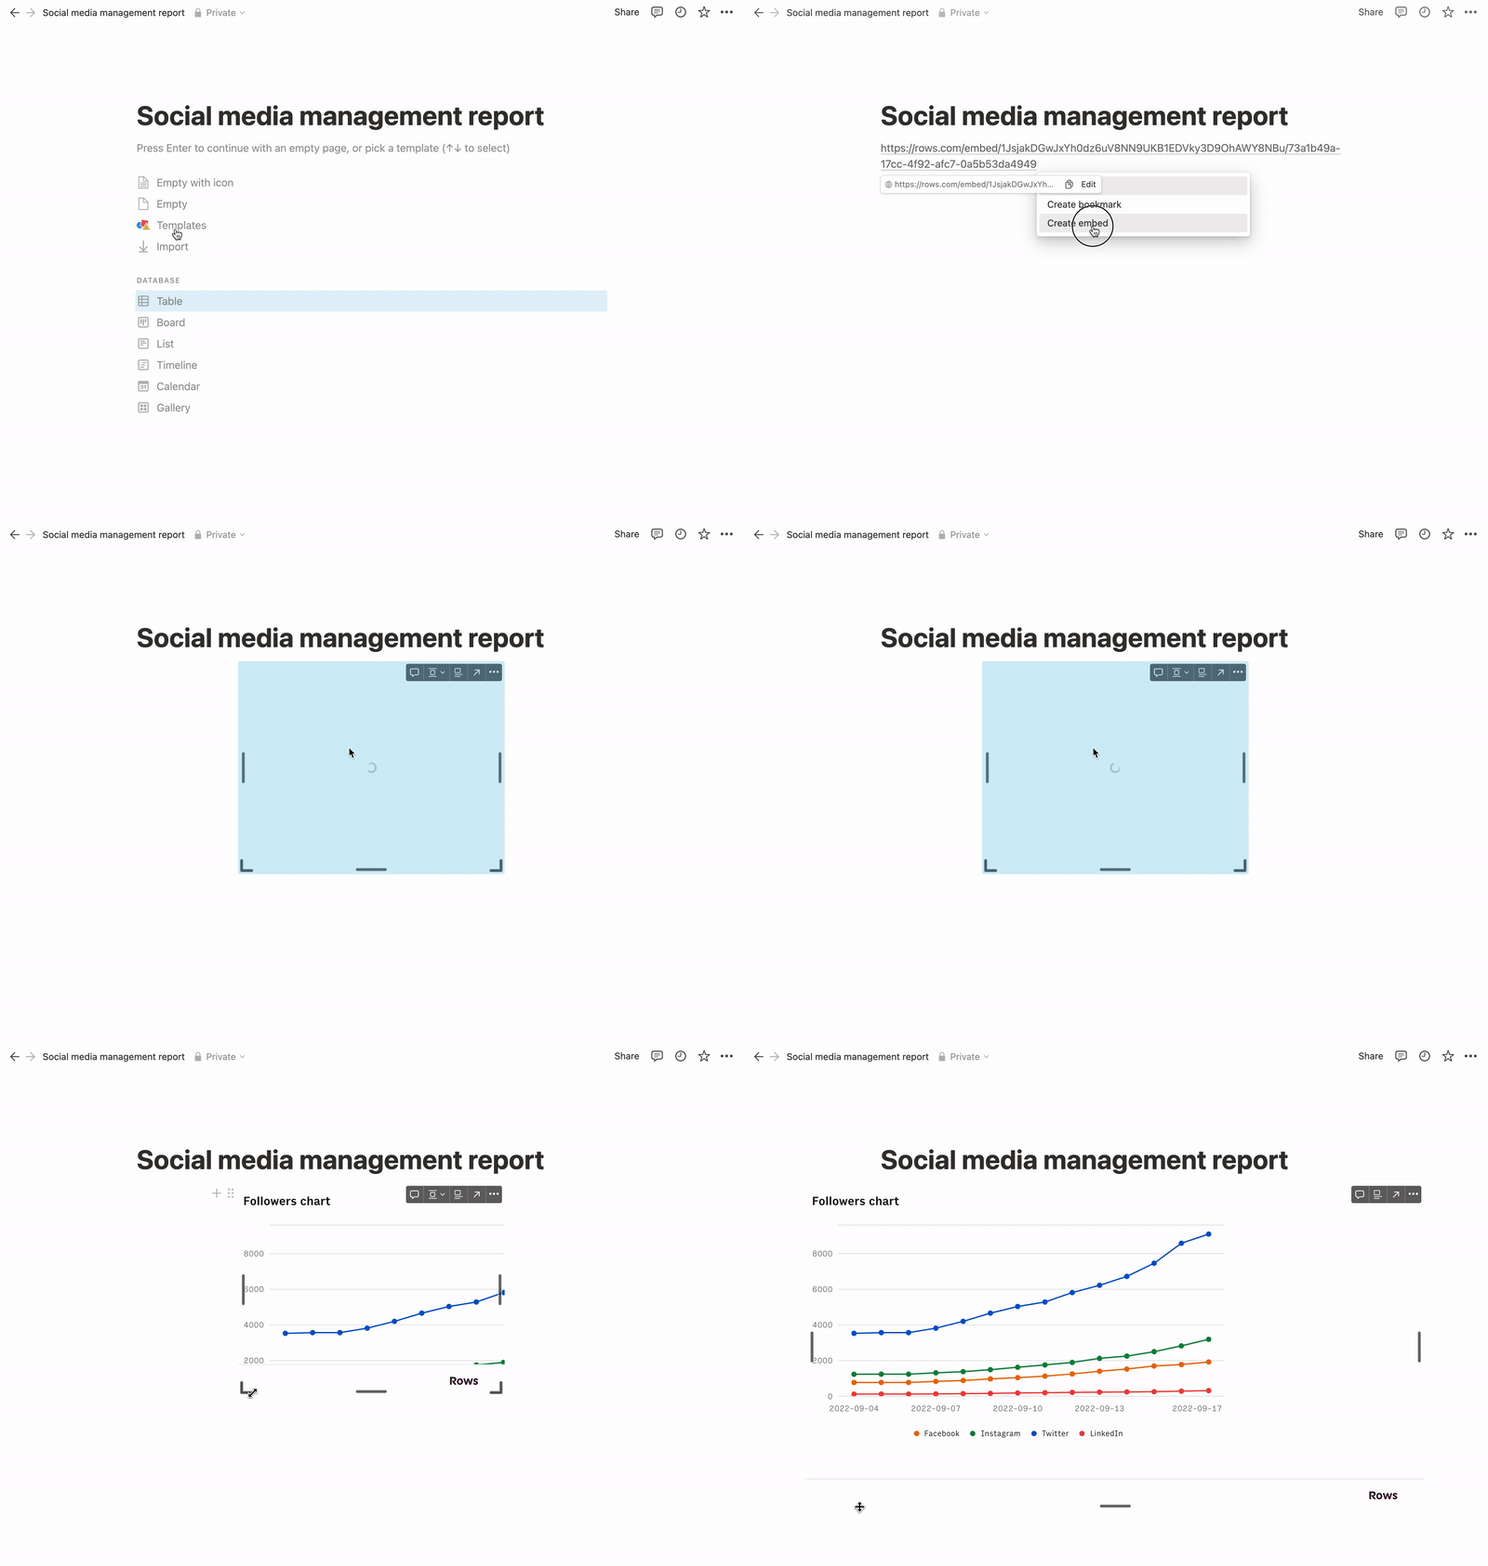
This is how Rows embed looks on Notion:
You might also like
More for Social Media managers
Social media management is your bread and butter? Also read:
Discover our Marketing playbook.