Intro
With almost 830 million users worldwide in over 200 countries, LinkedIn is by far the largest professional networking website around the globe. No surprise that businesses, since its inception, considered it among the go-to destinations to establish their presence online and create a meaningful conversation with their target.
In this short guide, we’ll walk you through everything you need to build a report to track the performance of your LinkedIn posts, that pulls data directly from LinkedIn into your Rows spreadsheet.
Here’s a sneak peek at what you will get:
LinkedIn engagement glossary
Before getting started, let's go briefly through some definitions. LinkedIn offers its members a broad range of analytics to understand how their posts are performing.
- Impressions are the total number of exposures to your content. This can include the same person seeing your content multiple times.
- Likes are the total number of like your post has received.
- Clicks are the total number of clicks generated by your post on any external link present in the text, such as mentions or URLs, including profile visis.
- Shares are the total number of times a post is shared, within or outside the LinkedIn platform.
- Engagement is the sum of all interactions with the post, divided by total impressions.
Let's go
First of all, use our template at the following link LinkedIn post report and save it in one of your workspace's folders.
To understand how it's been built, let's reverse-engineer it together.
First of all, you need to enable Rows data integration and connect your LinkedIn Page to Rows. Click on the top modal (or this link) then follow the instructions. The typical LinkedIn Auth page will open: enter your LinkedIn credentials and authorize Rows to retrieve your data.
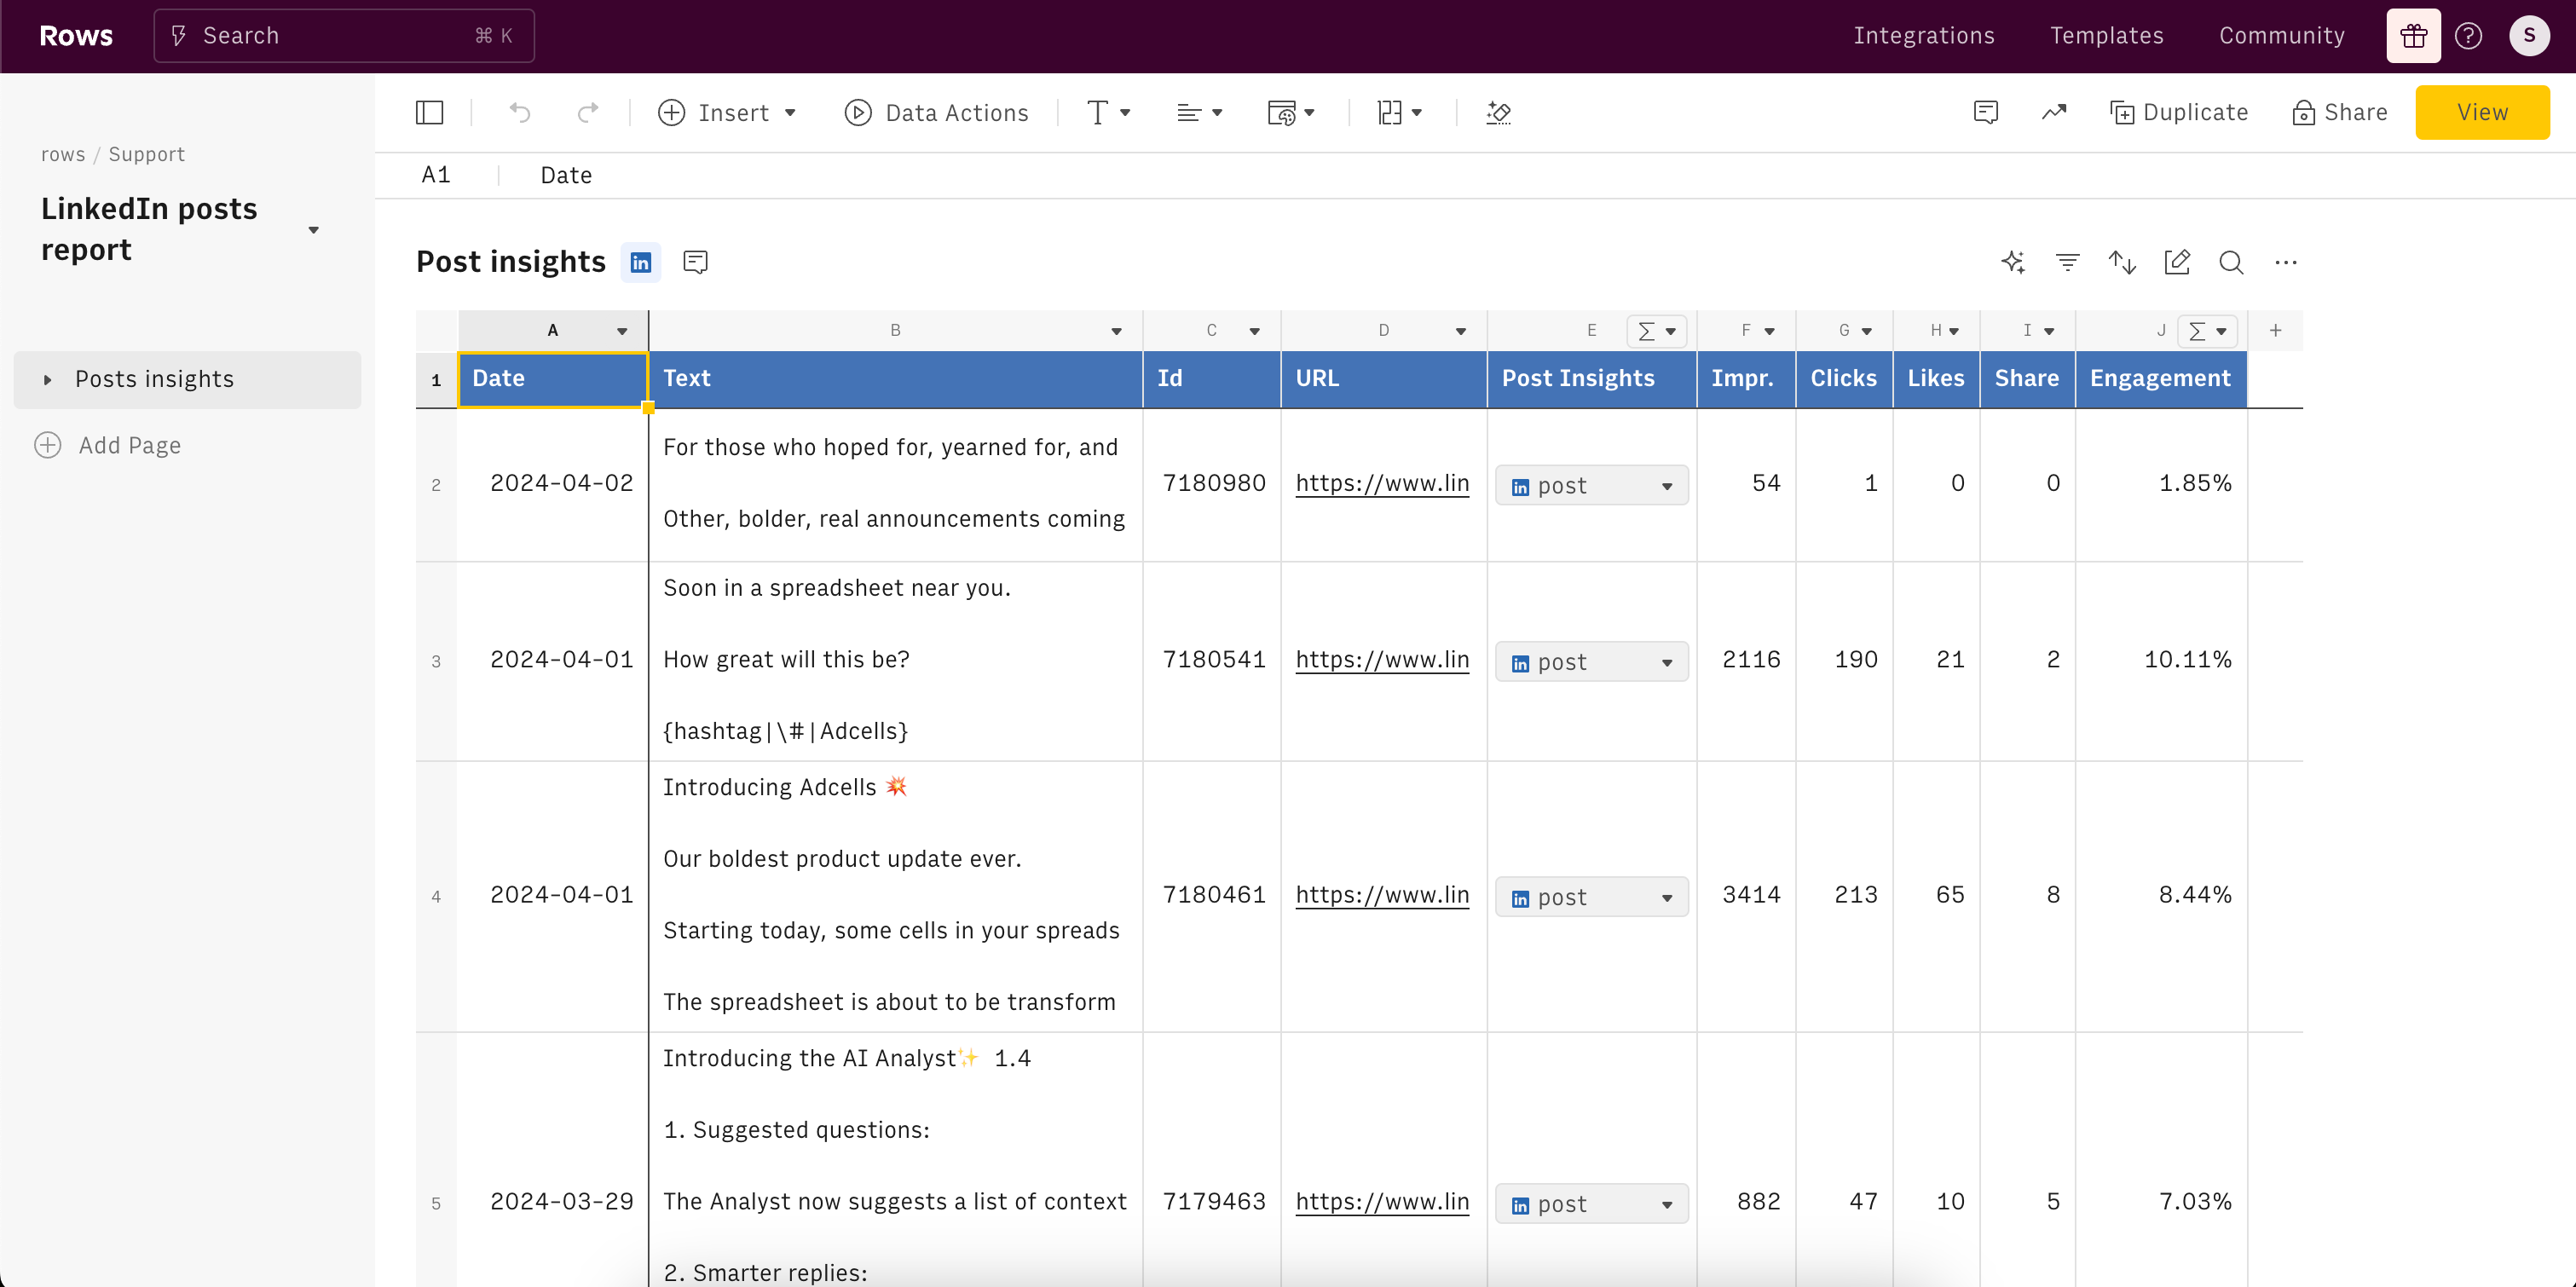
If you choose to retrieve all available data, the output table is the following:
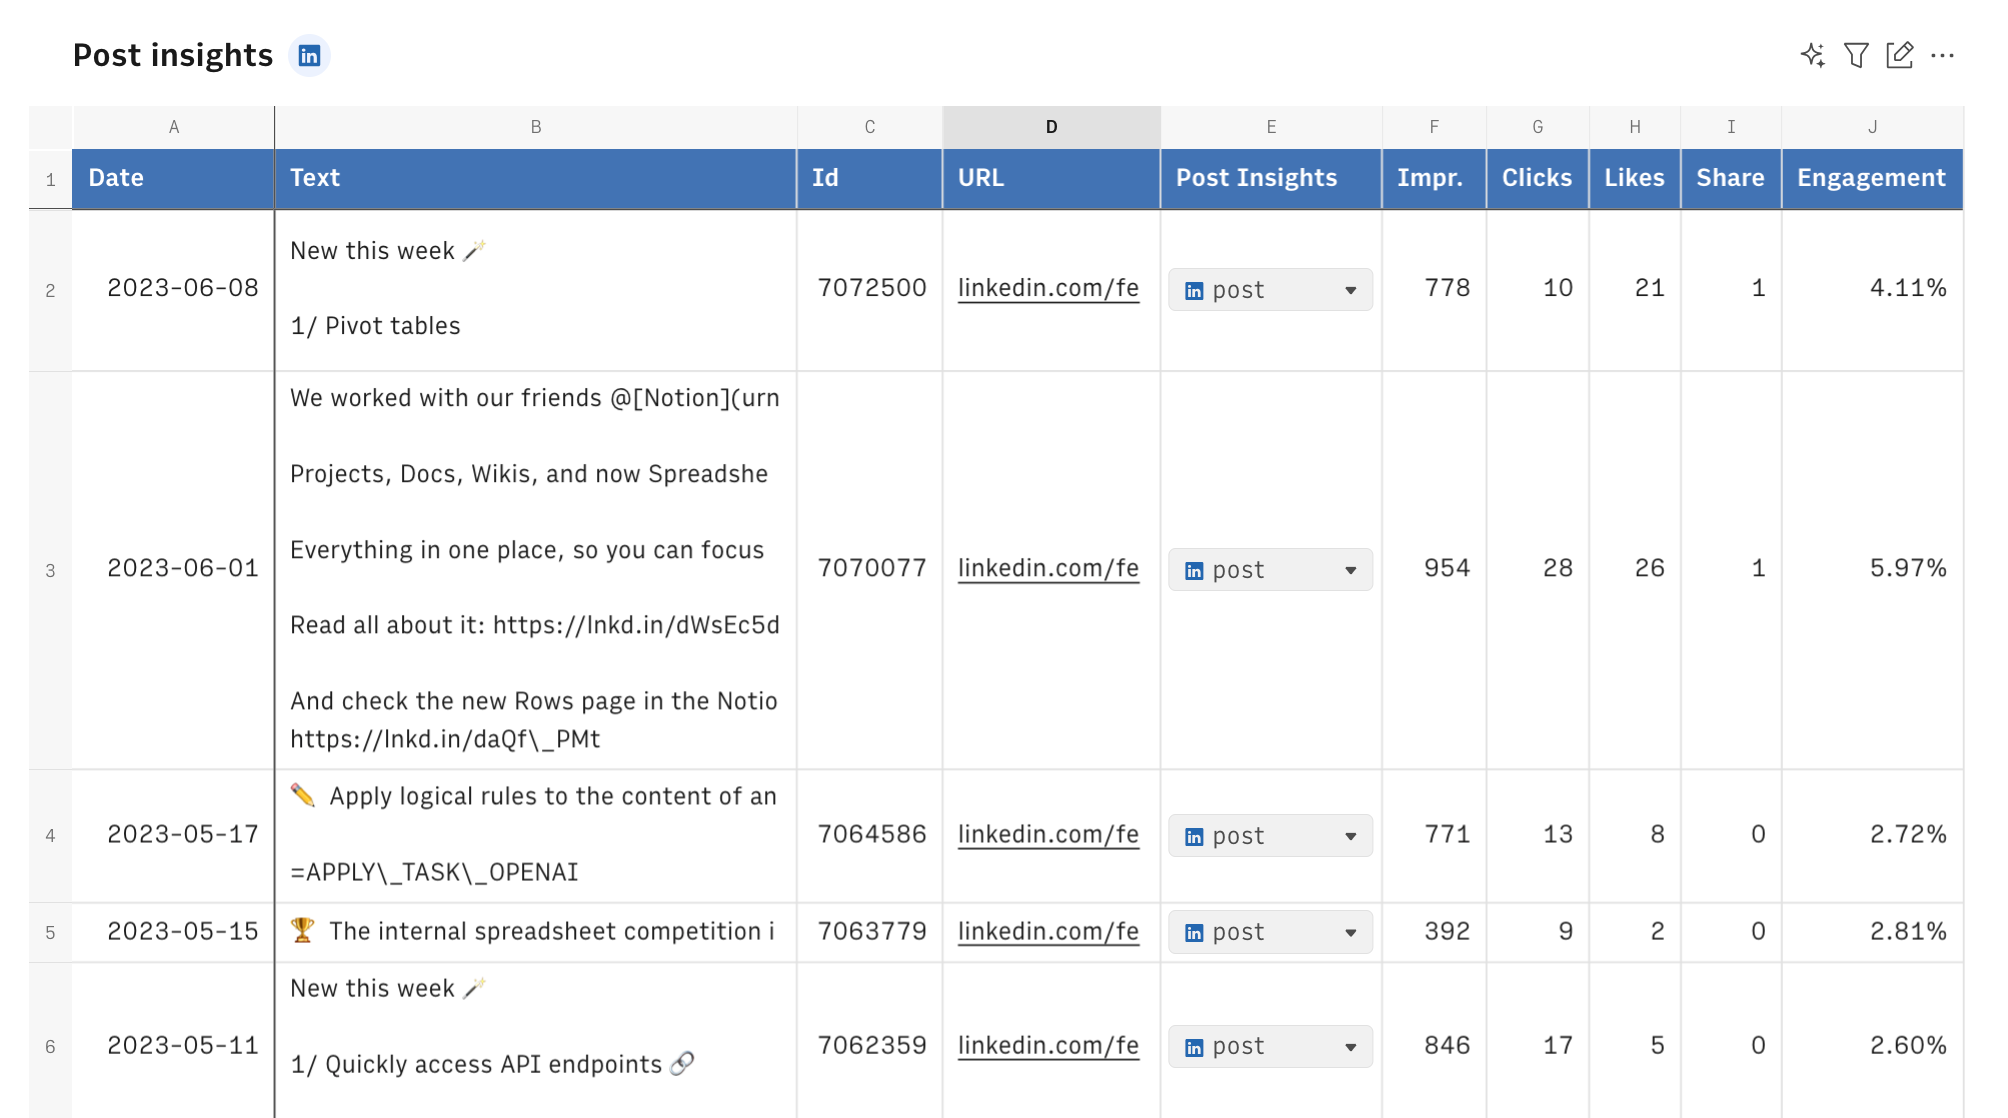
As you may see, column E includes a further data cell. Specifically, we used Rows GET_POST_INSIGHTS_LINKEDIN() to pull performance details for any post, using the post_id as the single argument.
1 =GET_POST_INSIGHTS_LINKEDIN(B2)We added it through the formula column option, as follow:
As a result, column E includes data cells with post-specific information. As all other data cells in Rows, they need to be expanded to be properly read.
To do this, we clicked on the arrow icon in cell E2 and hit Inspect data: a right end side panel will open, showing a structured document in JSON format.
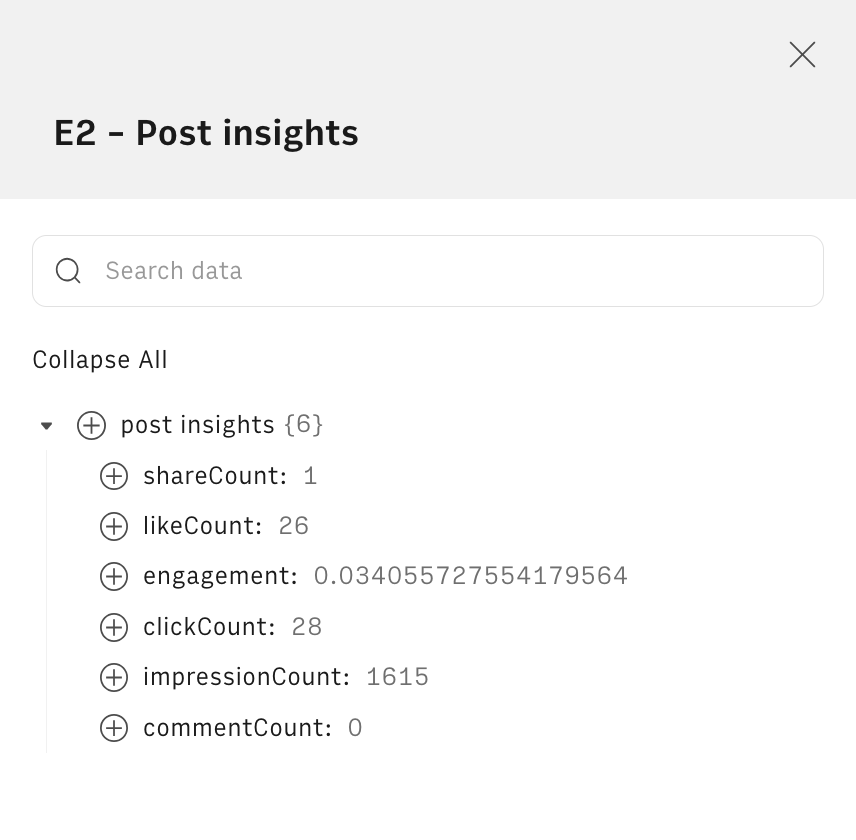
Next to each data point, there is a + button. We hit it and select cell where you want to store the metric, e.g. F2. The destination cell will be filled a formula similar to the following, that uses our PARSE() function to read and extract specific data points from any JSON document. The first argument is the data cell E2, and the second includes the path to follow to retrieve that specific data point.
1 =PARSE(E2,"['impressionCount']")Once added the first metric to cell F2, you can proceed with all others, such as clicks, shares, likes, comments, and engagement. Finally drag them to execute for the whole table.
The final result is a comprehensive view of all your LinkedIn posts with the main metrics.
Schedule automation
Whenever you create a Data Table, Rows allows you to switch on the Schedule refresh option to automate data retrievement at a specific time interval.
To check it in the Post Insights tables, click on the ... menu and switch it on from the right end panel, as follows
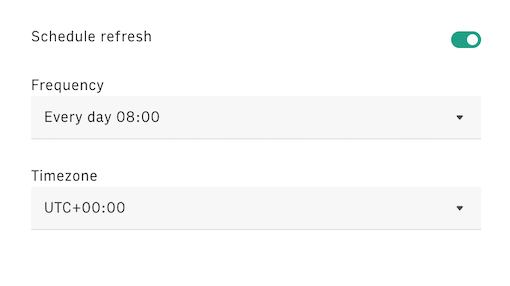
This way, the Facebook/Instagram integration will check if there are new new posts at the chosen time interval, e.g. "Every day 08:00".
To make also the GET_POST_INSIGHTS_LINKEDIN in column E fetch updated metrics over time, we need to employ our proprietary SCHEDULE() function.
To do so, add SCHEDULE() function to cell B2 of the Setup table: use the entire column 'Post insights'!E:E as the first argument and pick a refresh schedule as a second one, i.e. "Every day 08:00".
1 =SCHEDULE('Post insights'!E:E,"Every day 08:00")In so doing, Rows will refresh the data for each post, too.
You might also like
Check also
Social media management is your bread and butter? Please check also:
- Tracking your follower-base growth on social media
- Measuring your Facebook and Instagram posts performances
Discover our Marketing playbook.