About Free SEO Report Template for Agencies
An SEO report template is an important resource for agencies, companies, and creative who want to effectively communicate the value of their SEO practices.
So, if you are looking for a free SEO report template that is easy to customize and flexible — then we've got you covered — our free template is a time saver, you can schedule automatic data refreshes and provide an holistic overview of your website's performance over a particular period of time.
Let's take a deep dive at what you should know about SEO reporting and our template.
How Often Should You Report to your clients?
The general rule of thumb is to report to your client on a monthly basis. It’s not just us saying it.
It is widely reported that 70% of SEO professionals report to clients monthly, focusing on organic traffic, keyword rankings, and conversions.
You see, SEO is not a “get ranked quick” scheme. The previous optimization required some time to generate measurable results.
A period of one month provides sufficient time to assess basic metrics like keyword metrics, traffic fluctuations and conversion rates.
However, most SEO programs may require bi-weekly, bi-monthly or tri-monthly reports — and these could be based on the tenacity of practices executed. However the goal is to be in constant touch with your clients.
Key Elements to Include in an SEO Report Template
Let's take a look at a few standout features that must be included in an SEO report template:
1. Top-level Performance Summary
The template should contain a brief overview highlighting the key findings and overall performance. For example, our SEO report template features 3 charts that give you an overview of the last months trend of impressions, clicks, position and branded/non-branded traffic.
2. Traffic Analysis
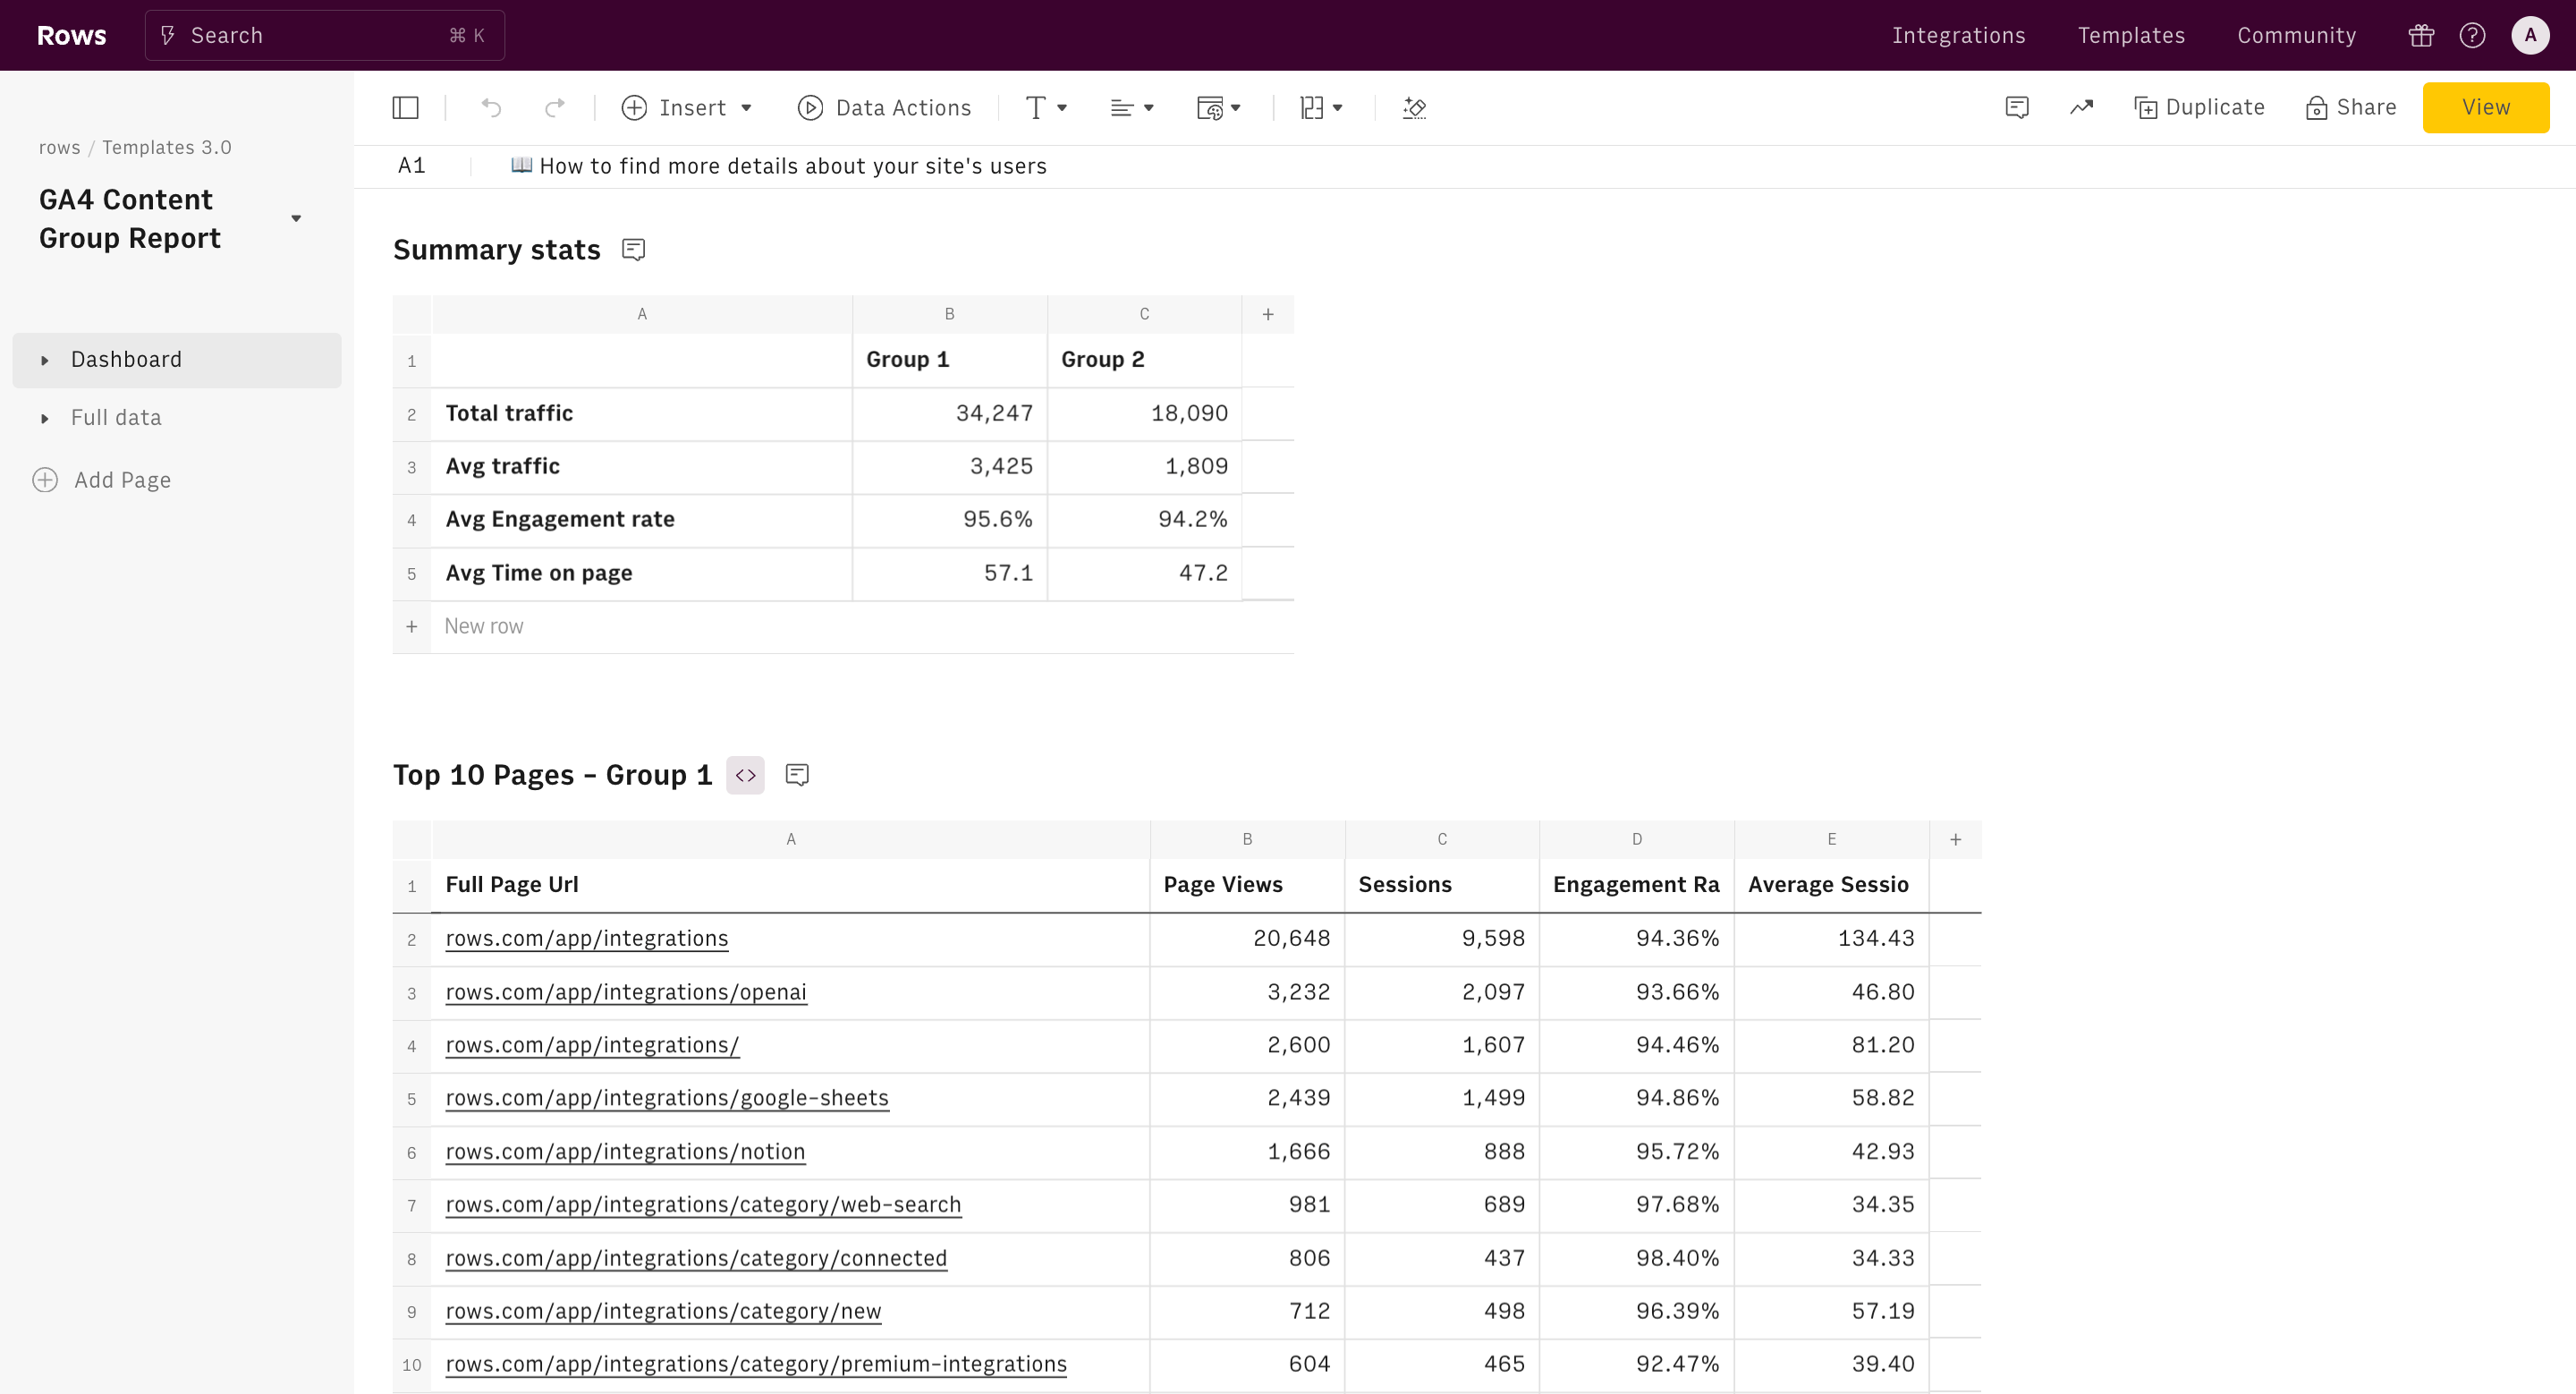
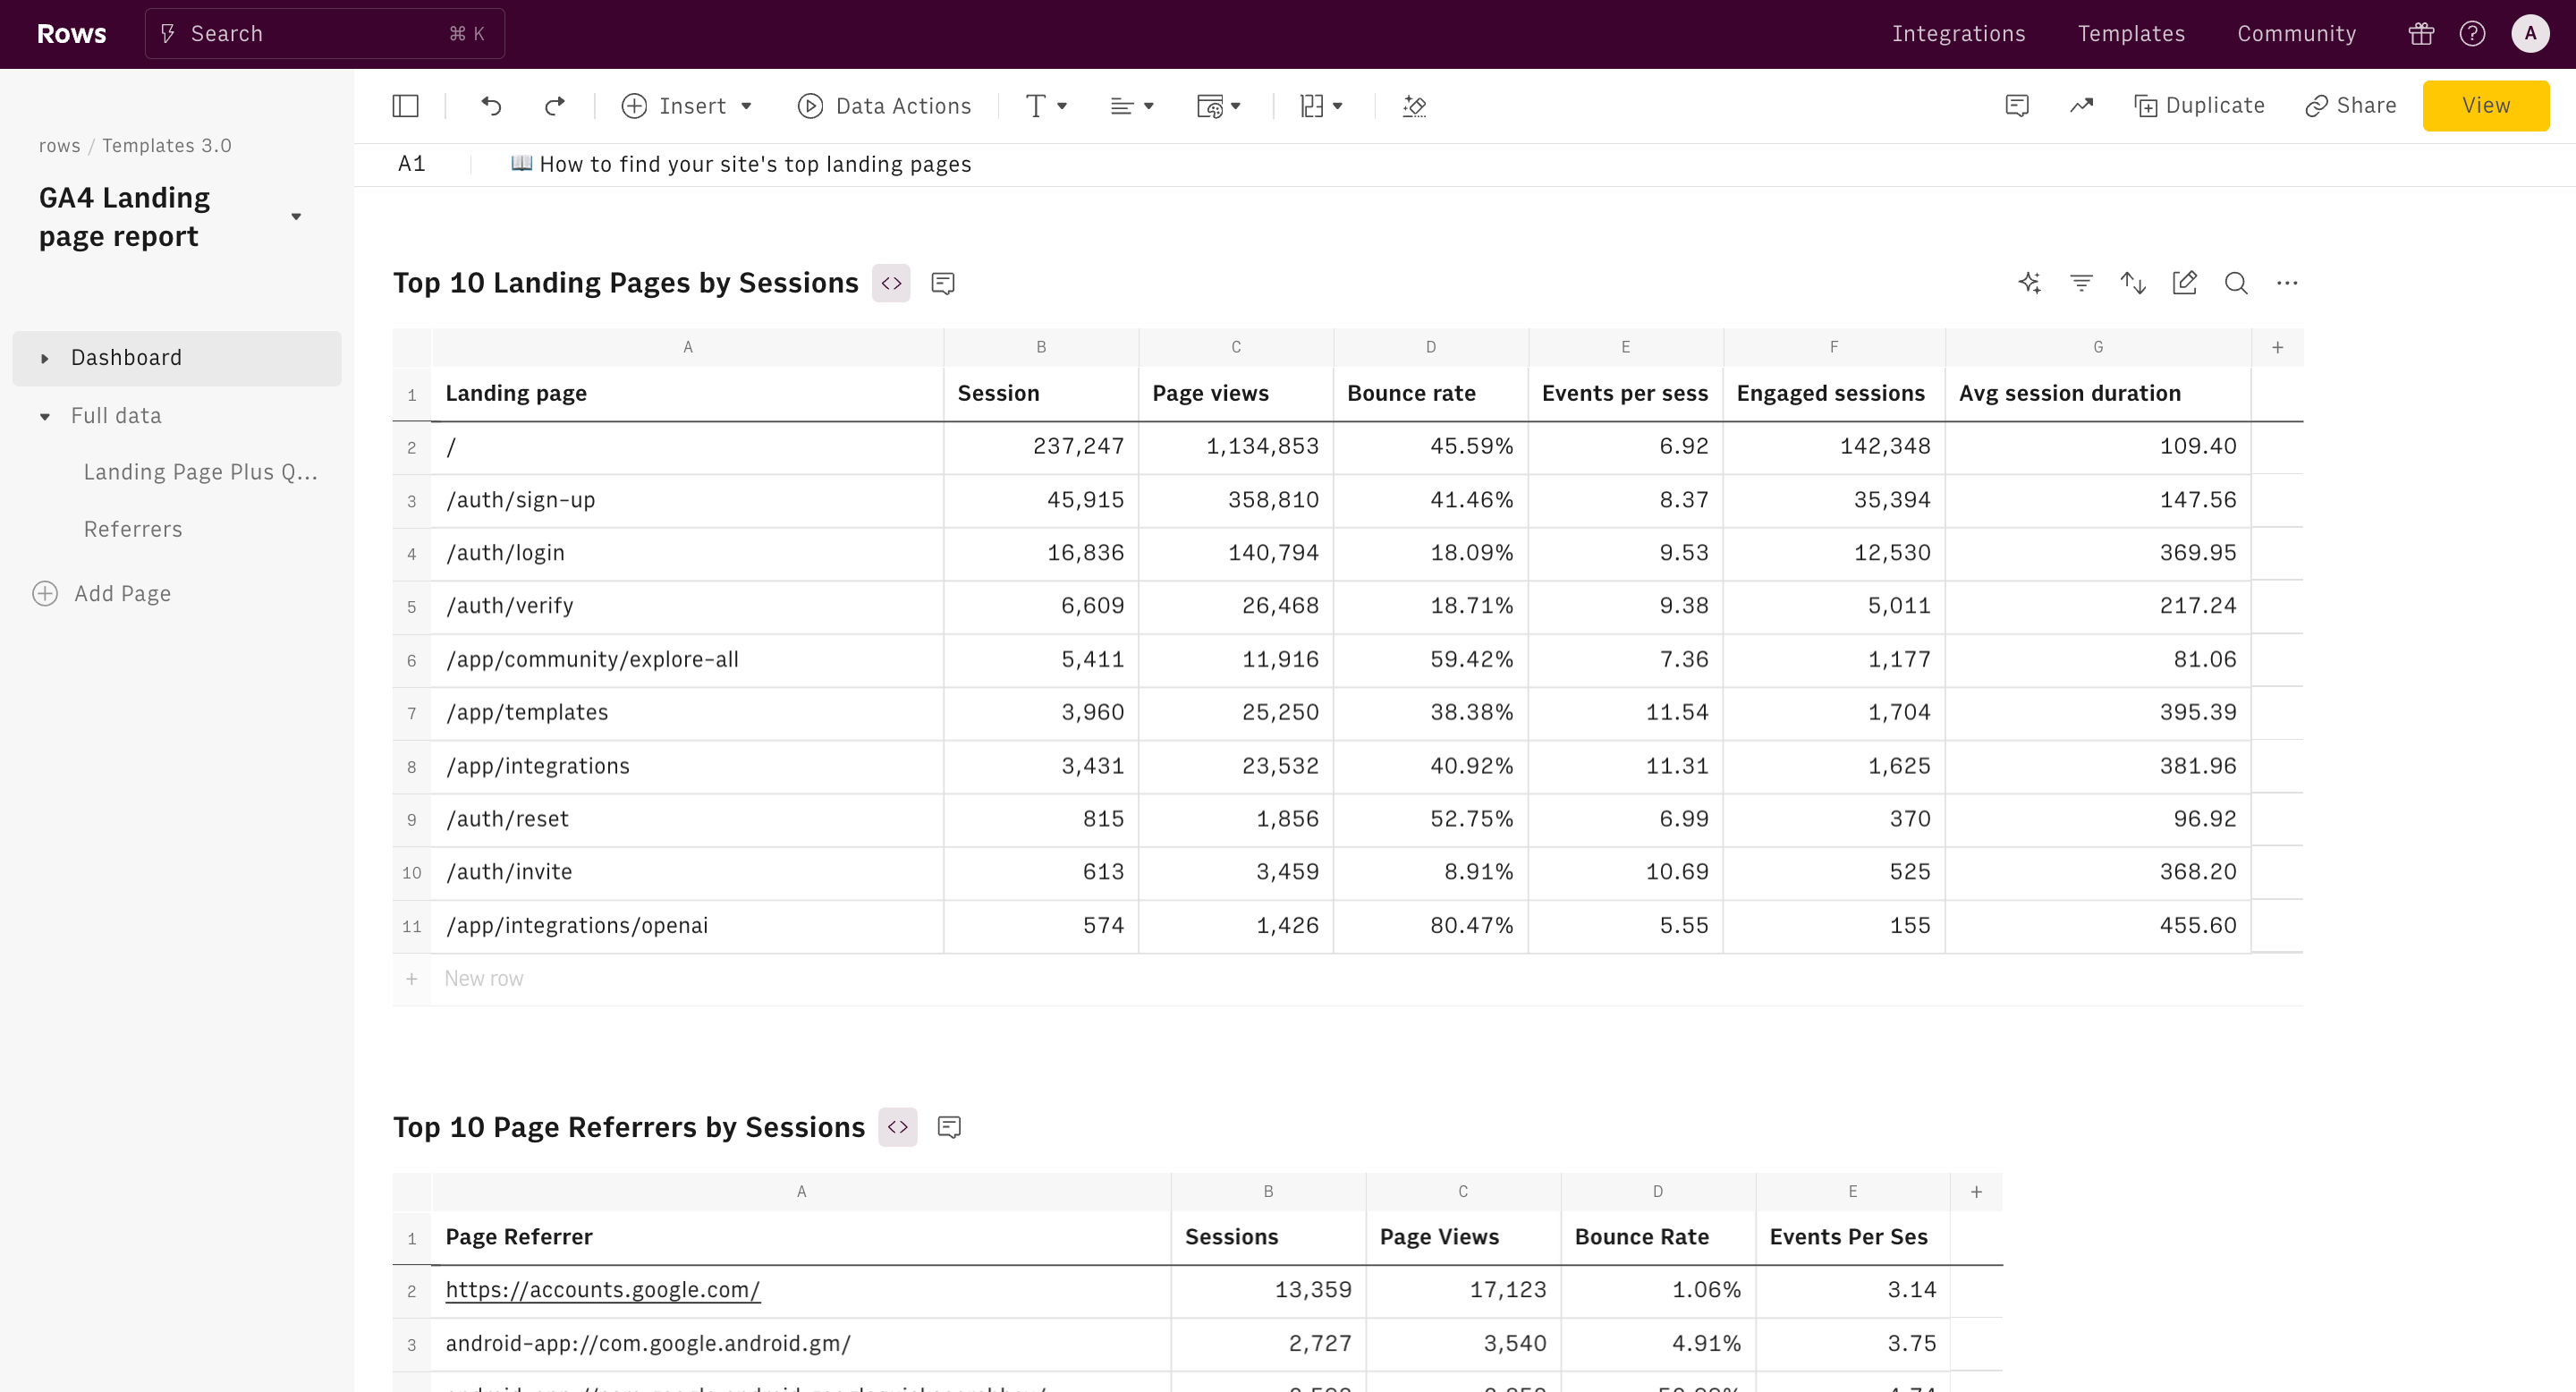
Insights into where your traffic is coming from, including the most effective pages. For example, in our core SEO report template , there is one section devoted to top (least) performing pages. These tables are filtered to show your clicks, impressions and positions per page, over a certain period of time compared to previous period or Year Over Year.
3. Content Performance
It should show metrics on how well specific topics you are writing about engage users and drives traffic. For example, using our SEO Report template, you can gauge the performance of user-selected topic clusters by checking the trend of clicks and impressions over time. Alternatively, you can have a deep-dive with our Content Grouping Template.
4. Keyword Rankings
It should contain a snapshot of your targeted keywords' performance in search results. For example, Our SEO report templates can show your top-ranked keywords (both branded and non-branded). For a deeper keyword research, try our Keywords Research Template.
5. Backlink Profile
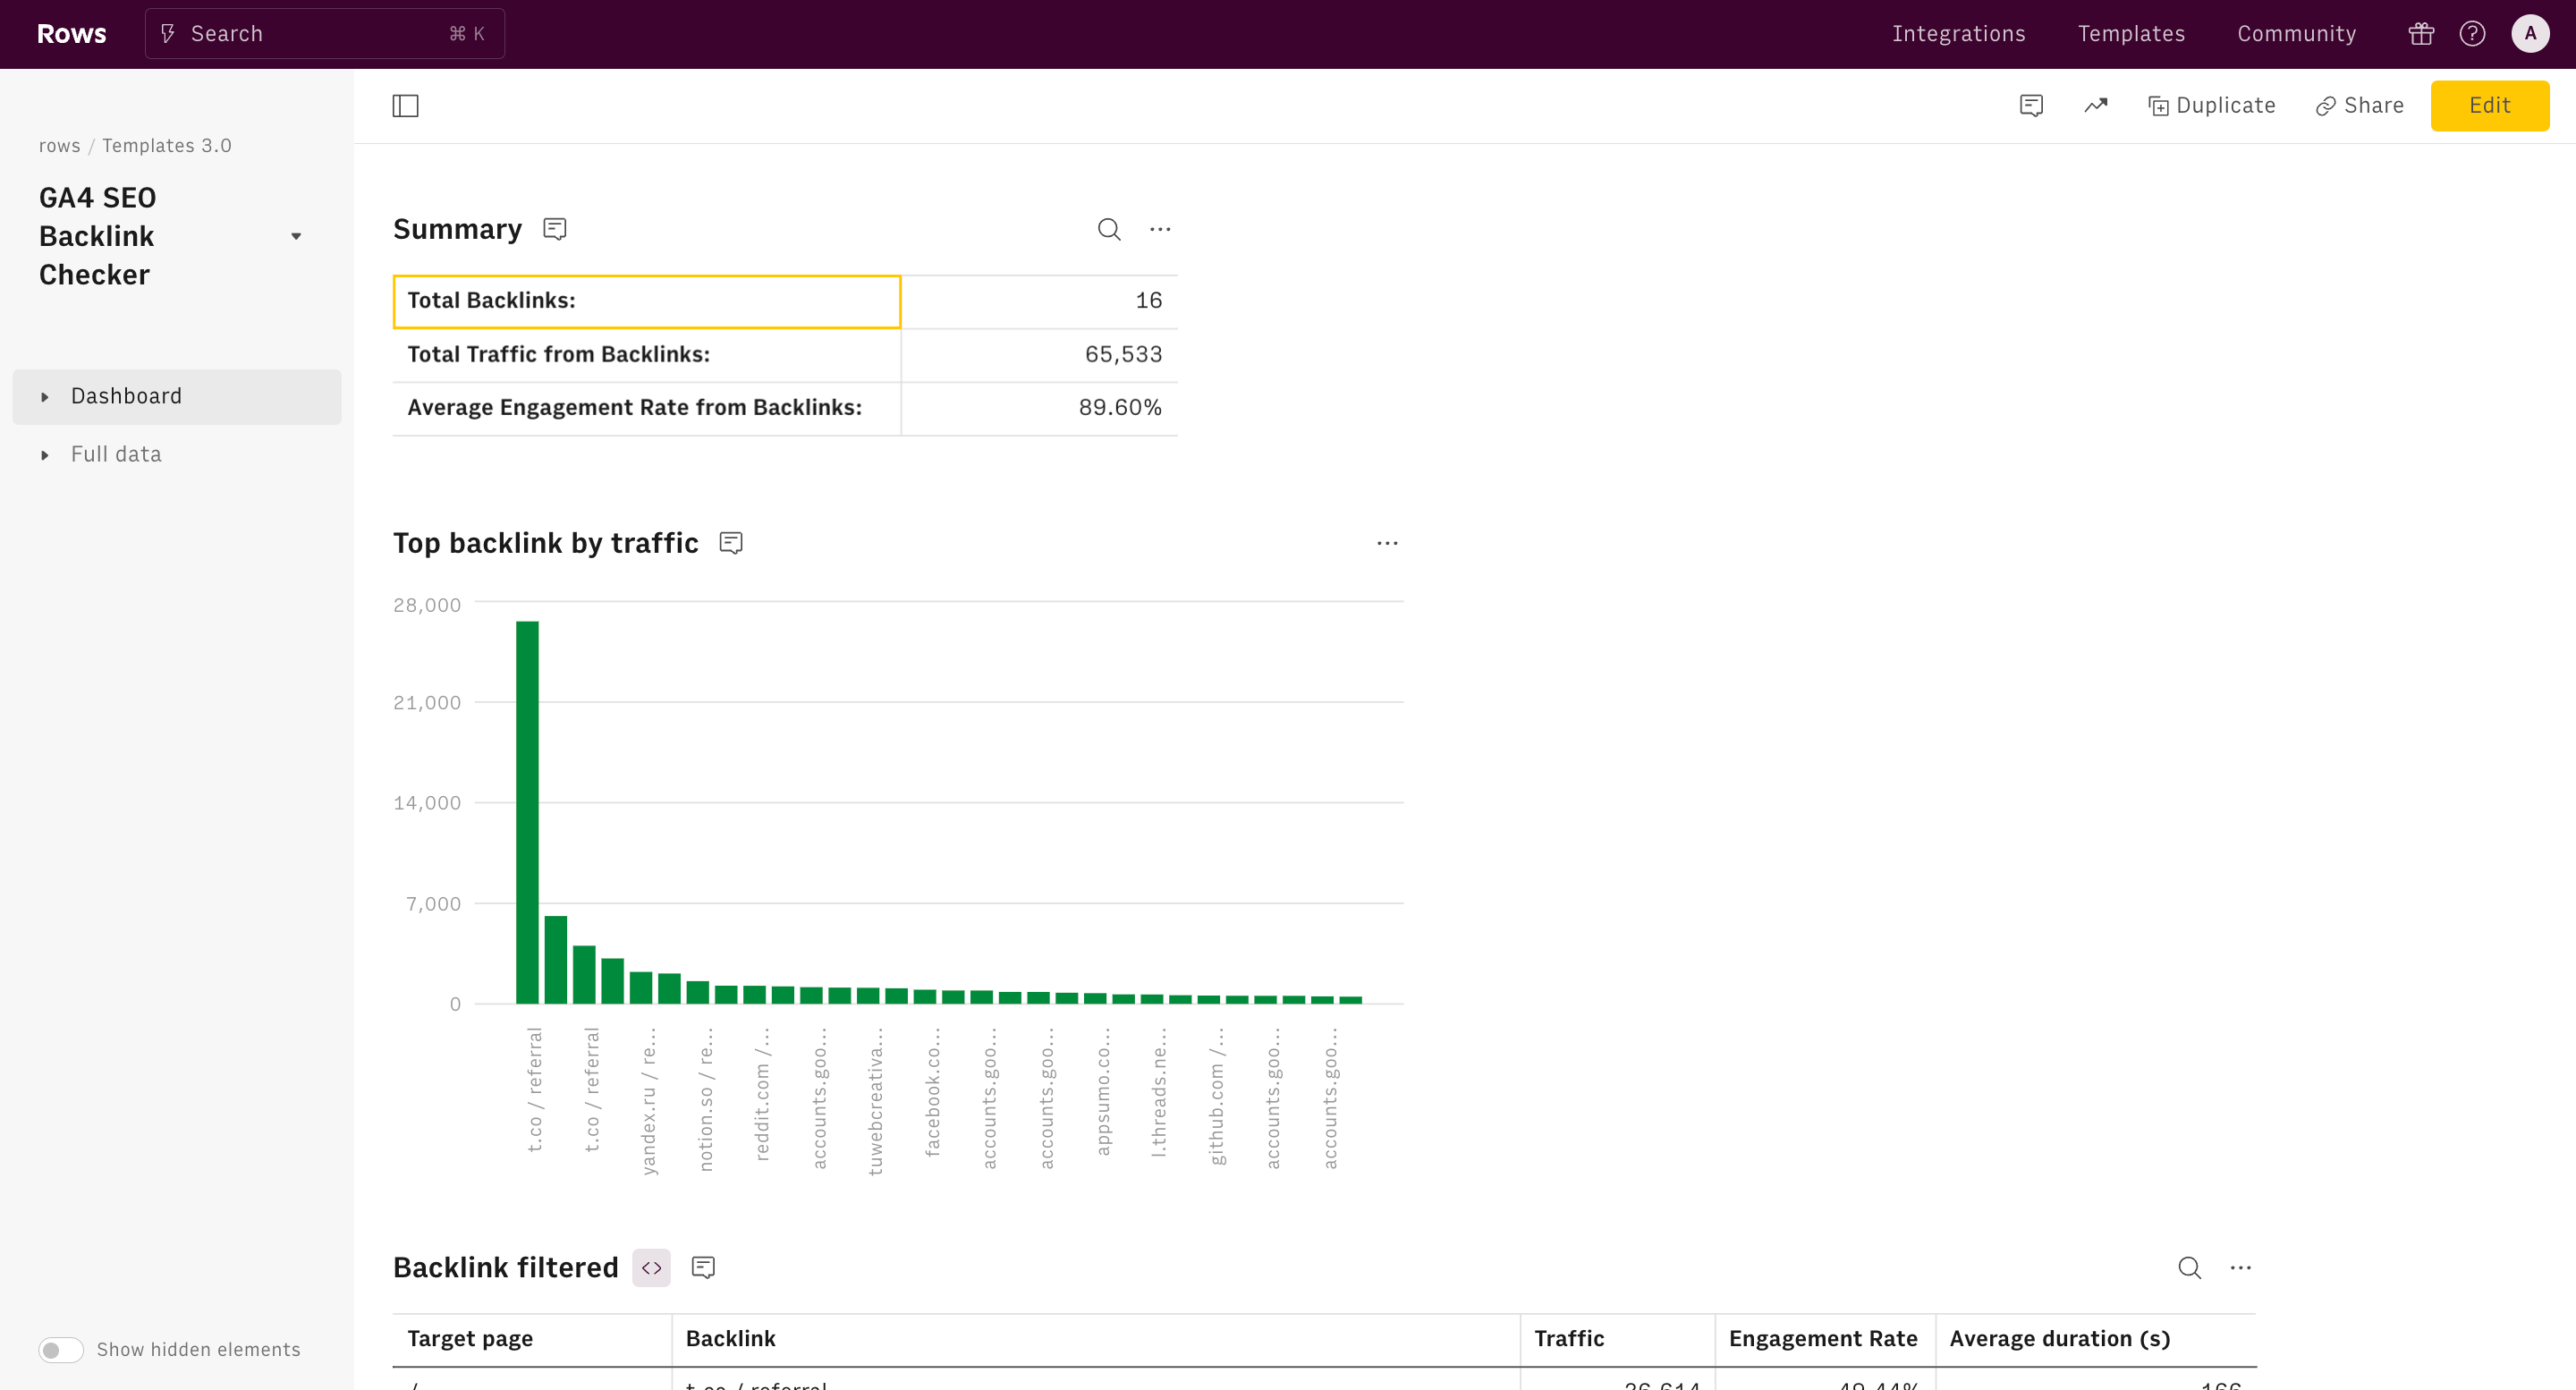
An analysis of your website's backlinks, focusing on quantity and quality. For example, at Rows, we have a Google Backlink checker that gives you a list of backlinks sending the most referral traffic to your website and analyzes which incoming links send the most active and engaged users.
- Competitor Analysis
A comparison of your SEO performance against key competitors to identify opportunities. For example, Say competitor X gained 30% more backlinks; we should explore similar outreach strategies.
7. Technical SEO
An overview of your website core loading performance, including FCP, LCP and CLS, both for mobile and desktop.
8. Customization options
An effective SEO report template must include customization options for logos, colors, and other branding elements. This way, you can present reports that match your client's brand style.
9. Visualization options
What is a report template without visualization elements like graphs, tables, and charts? Go for a template that has a tidy UI as well, so you can easily customize visualization options without hassle.
How to Create an SEO Report Template for Your Agency?
Step 1: Identify client needs and reporting objectives.
SEO isn't just about rankings. It's about solving business problems. Every client comes to us with a unique set of needs, challenges, and goals.
How do they make money? What are their profit margins? Who are their competitors?
What are they hoping to achieve with SEO? More leads? Increased brand awareness? Higher conversion rates?
Afterwards, write down your reporting objectives. Every reporting you make has a significance attached to it as tailored to your client’s needs.
For example, a reporting objective for Q4 of 2025 may be to clearly outline trends charts of branded vs non-branded keywords — which is directly tailored to your client's goal of ranking for specific keywords.
Step 2: Choose a specialized data reporting tool like Rows
The quality of your SEO report is hinged on the quality, capability and speciality of the tool. A good reporting tool automates tedious tasks, like data collection, report generation, and even client delivery. This frees you up to focus on what really matters: analyzing the data and crafting insightful narratives.
Remember, every client is unique. A cookie-cutter report just won't cut it. Look for tools that allow you to customize your reports with your own branding, select the metrics that matter most to each client, and even add personalized commentary.
Also, look out for tools that are able to aggregate live data from your SEO data sources. Additionally, go for a tool that transforms raw numbers into compelling visuals. Charts, graphs, and dashboards bring the data to life, making it easier for clients to understand the story you're telling.
Below are some of our SEO report templates — with short descriptions of how to use them, the key metrics they measure, and why we created them.
Rows SEO report template
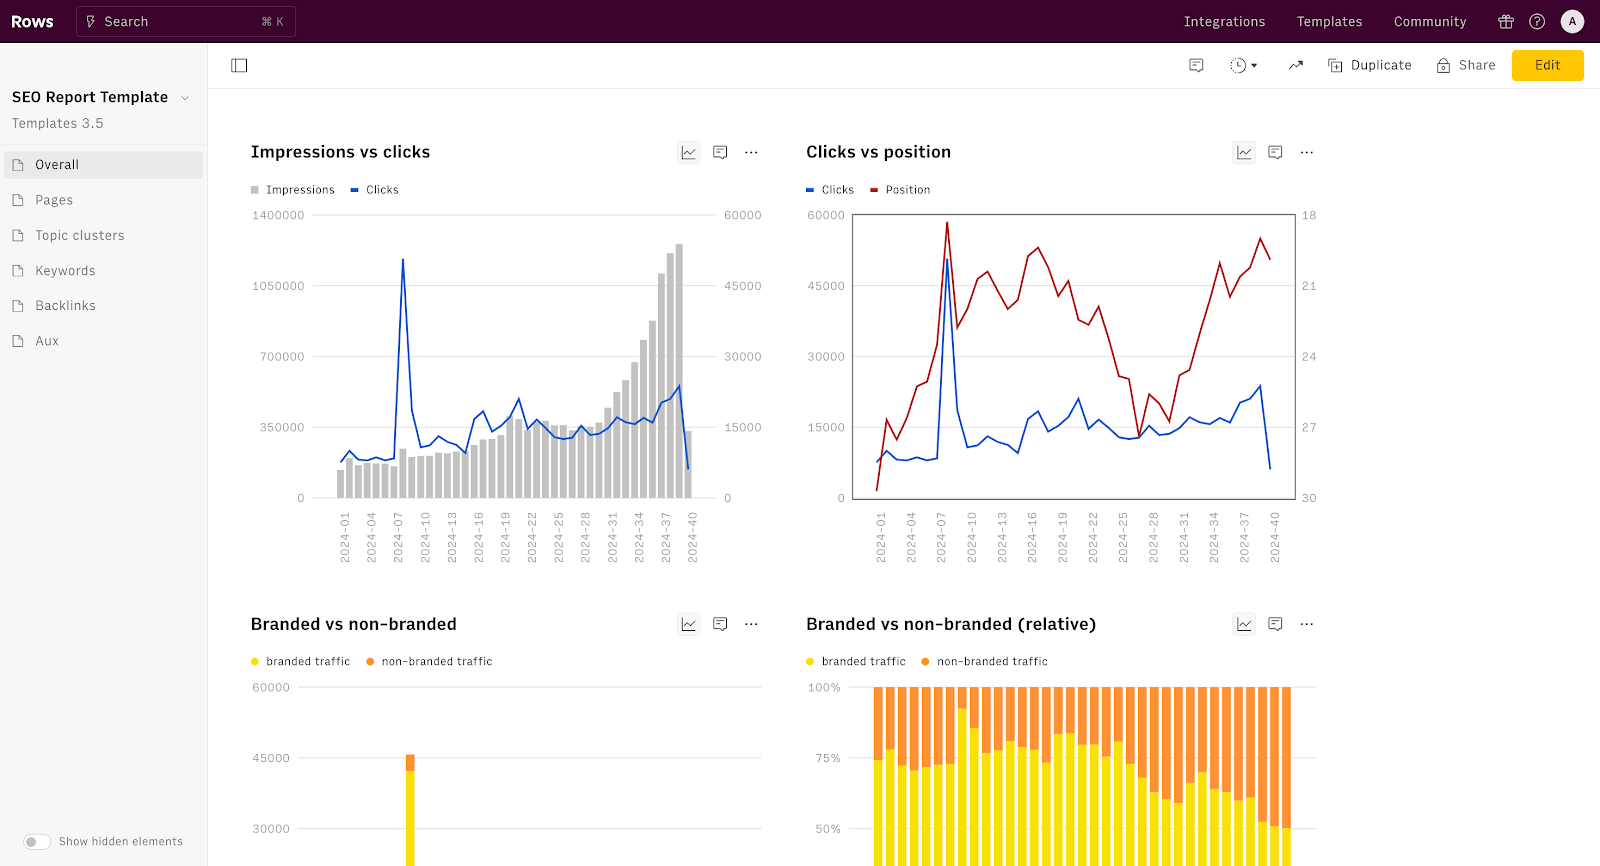
Our SEO Report template is a dashboard that consolidates all essential SEO metrics in one flexible and easy-to-manage spreadsheet interface. It is directly connected to your Google Analytics 4 and Google Search Console accounts and provides automated, real-time insights into your website's search performance, traffic patterns, content effectiveness, and backlink profile.
Step-by-step instructions on how to use our Rows SEO report templates
Step 1: To use this template, click “use template” on this page.
Step 2: Once you've completed this, click on “create a spreadsheet.” You'll then be taken to the dashboard page.
Step 3: You'll get a pop-up for configuration. You'll be asked to configure GSC and GA4 integrations to your Rows account. Without doing this, you'll be unable to pull out live data.
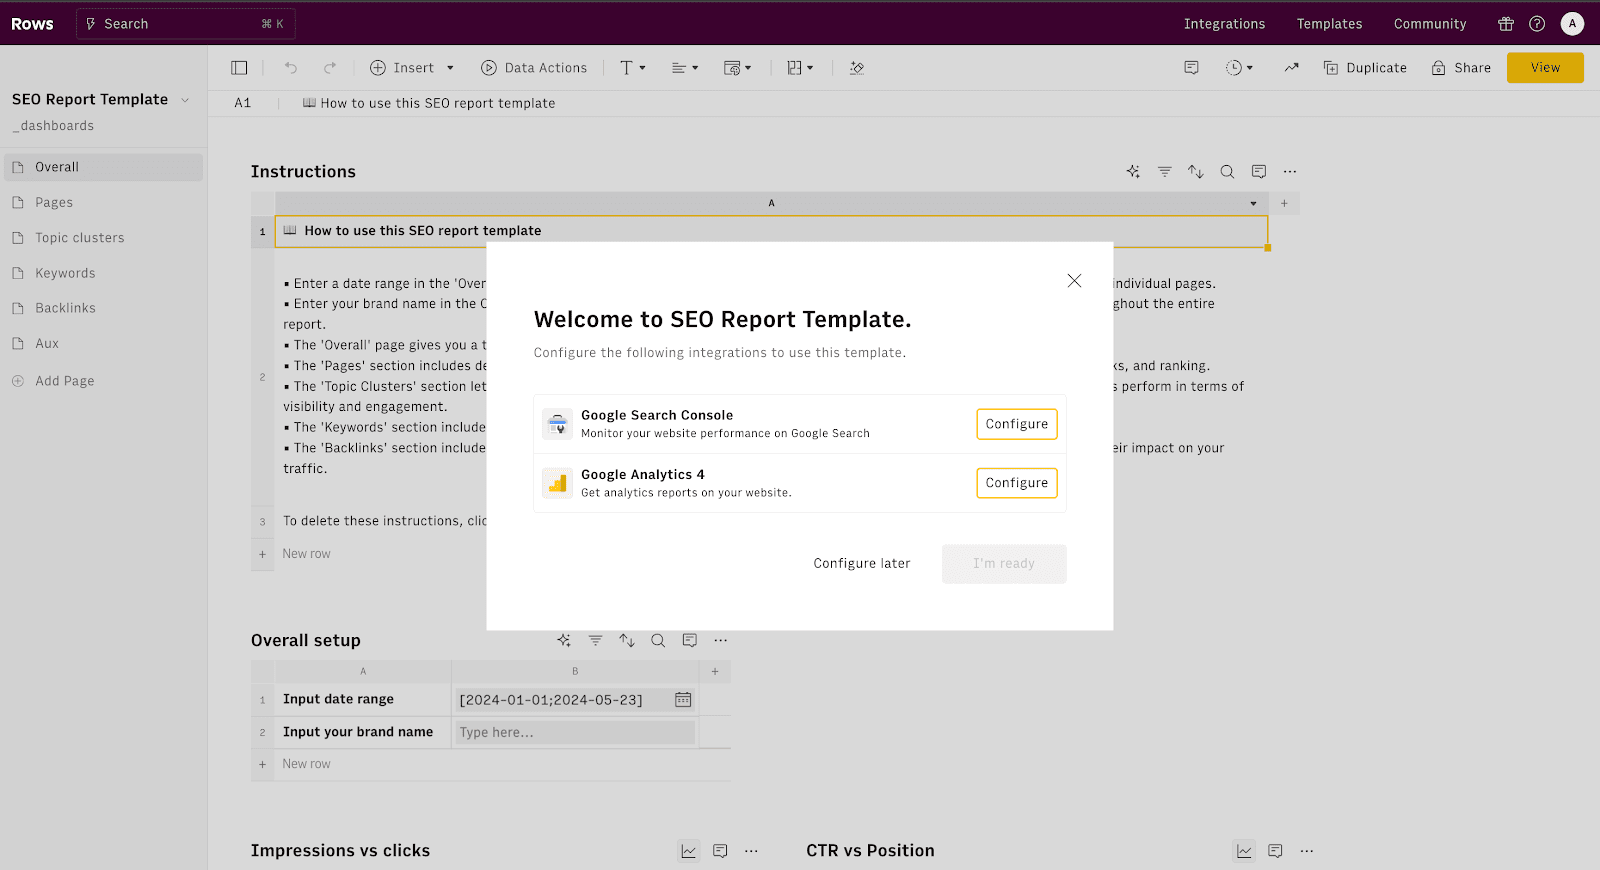
Step 4: Once you have confirmed integration, it's time to get to work. The next step is to enter a date range in the 'Overall' setup table. The date range will apply to the entire report, but you can overwrite it on individual pages.
Step 5: Enter your brand name in the Overall setup table. This will allow you to distinguish between branded and non-branded traffic throughout the report.
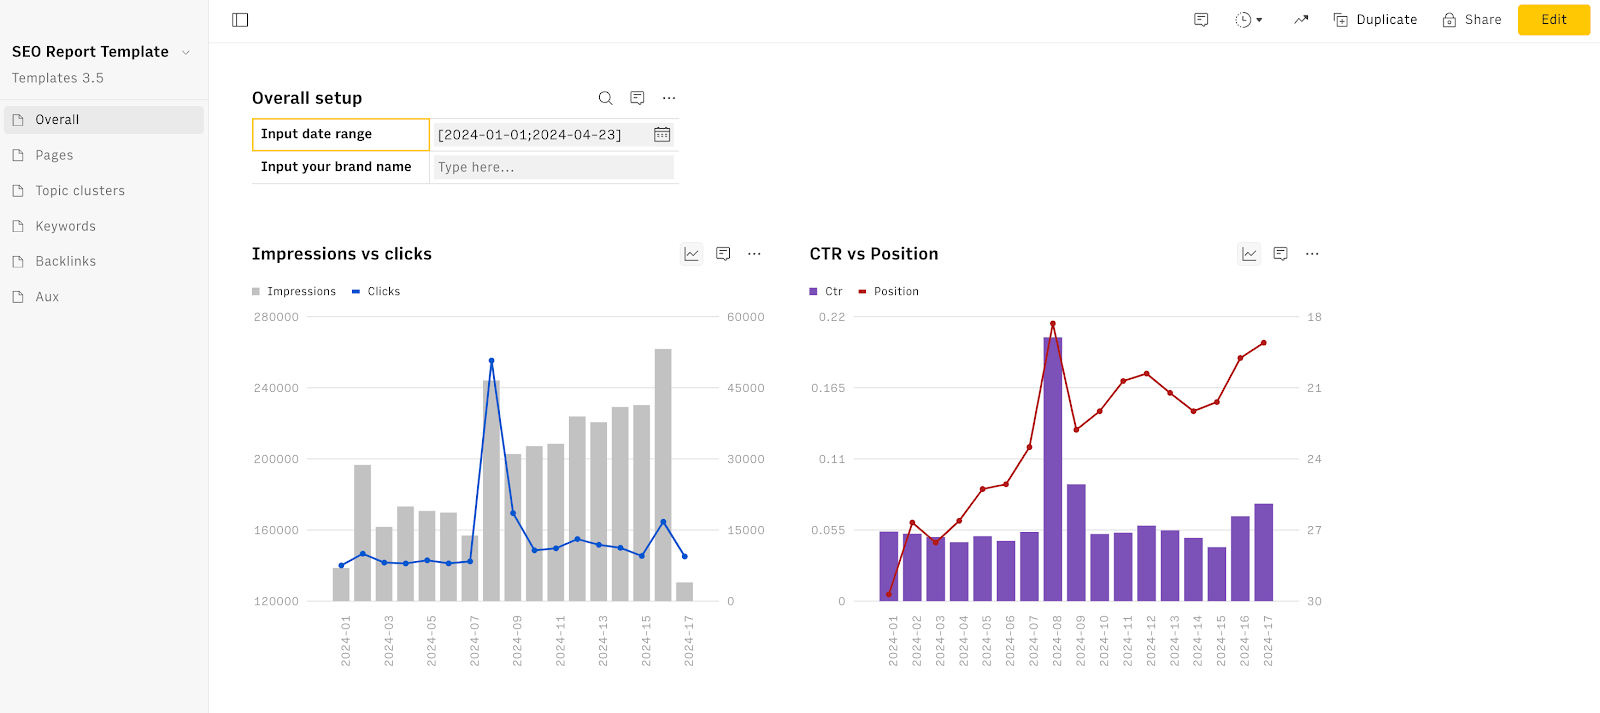
Look on the left side of your dashboard, and you'll see a pop-up of spreadsheets with different titles.
- The “Overall” page gives you a top-level view of your traffic metrics, such as clicks, impressions, and position.
- The “Pages” section includes detailed insights into the performance of individual pages, highlighting their traffic, impressions, clicks, and ranking.
- The “Topic Clusters” section lets you organize your website into four different content clusters, showing how well your grouped topics perform in terms of visibility and engagement.
- The “Keywords” section includes an analysis of your keywords
- The “Backlinks” section includes a review of your backlink profile, showing the number of referring domains, total backlinks, new backlinks per month and their impact on your traffic.
Step 3: Design a structure with metrics, insights, and recommendations sections.
Instead of overwhelming them with every conceivable metric, we cherry-pick the ones that align with their specific goals. Think:
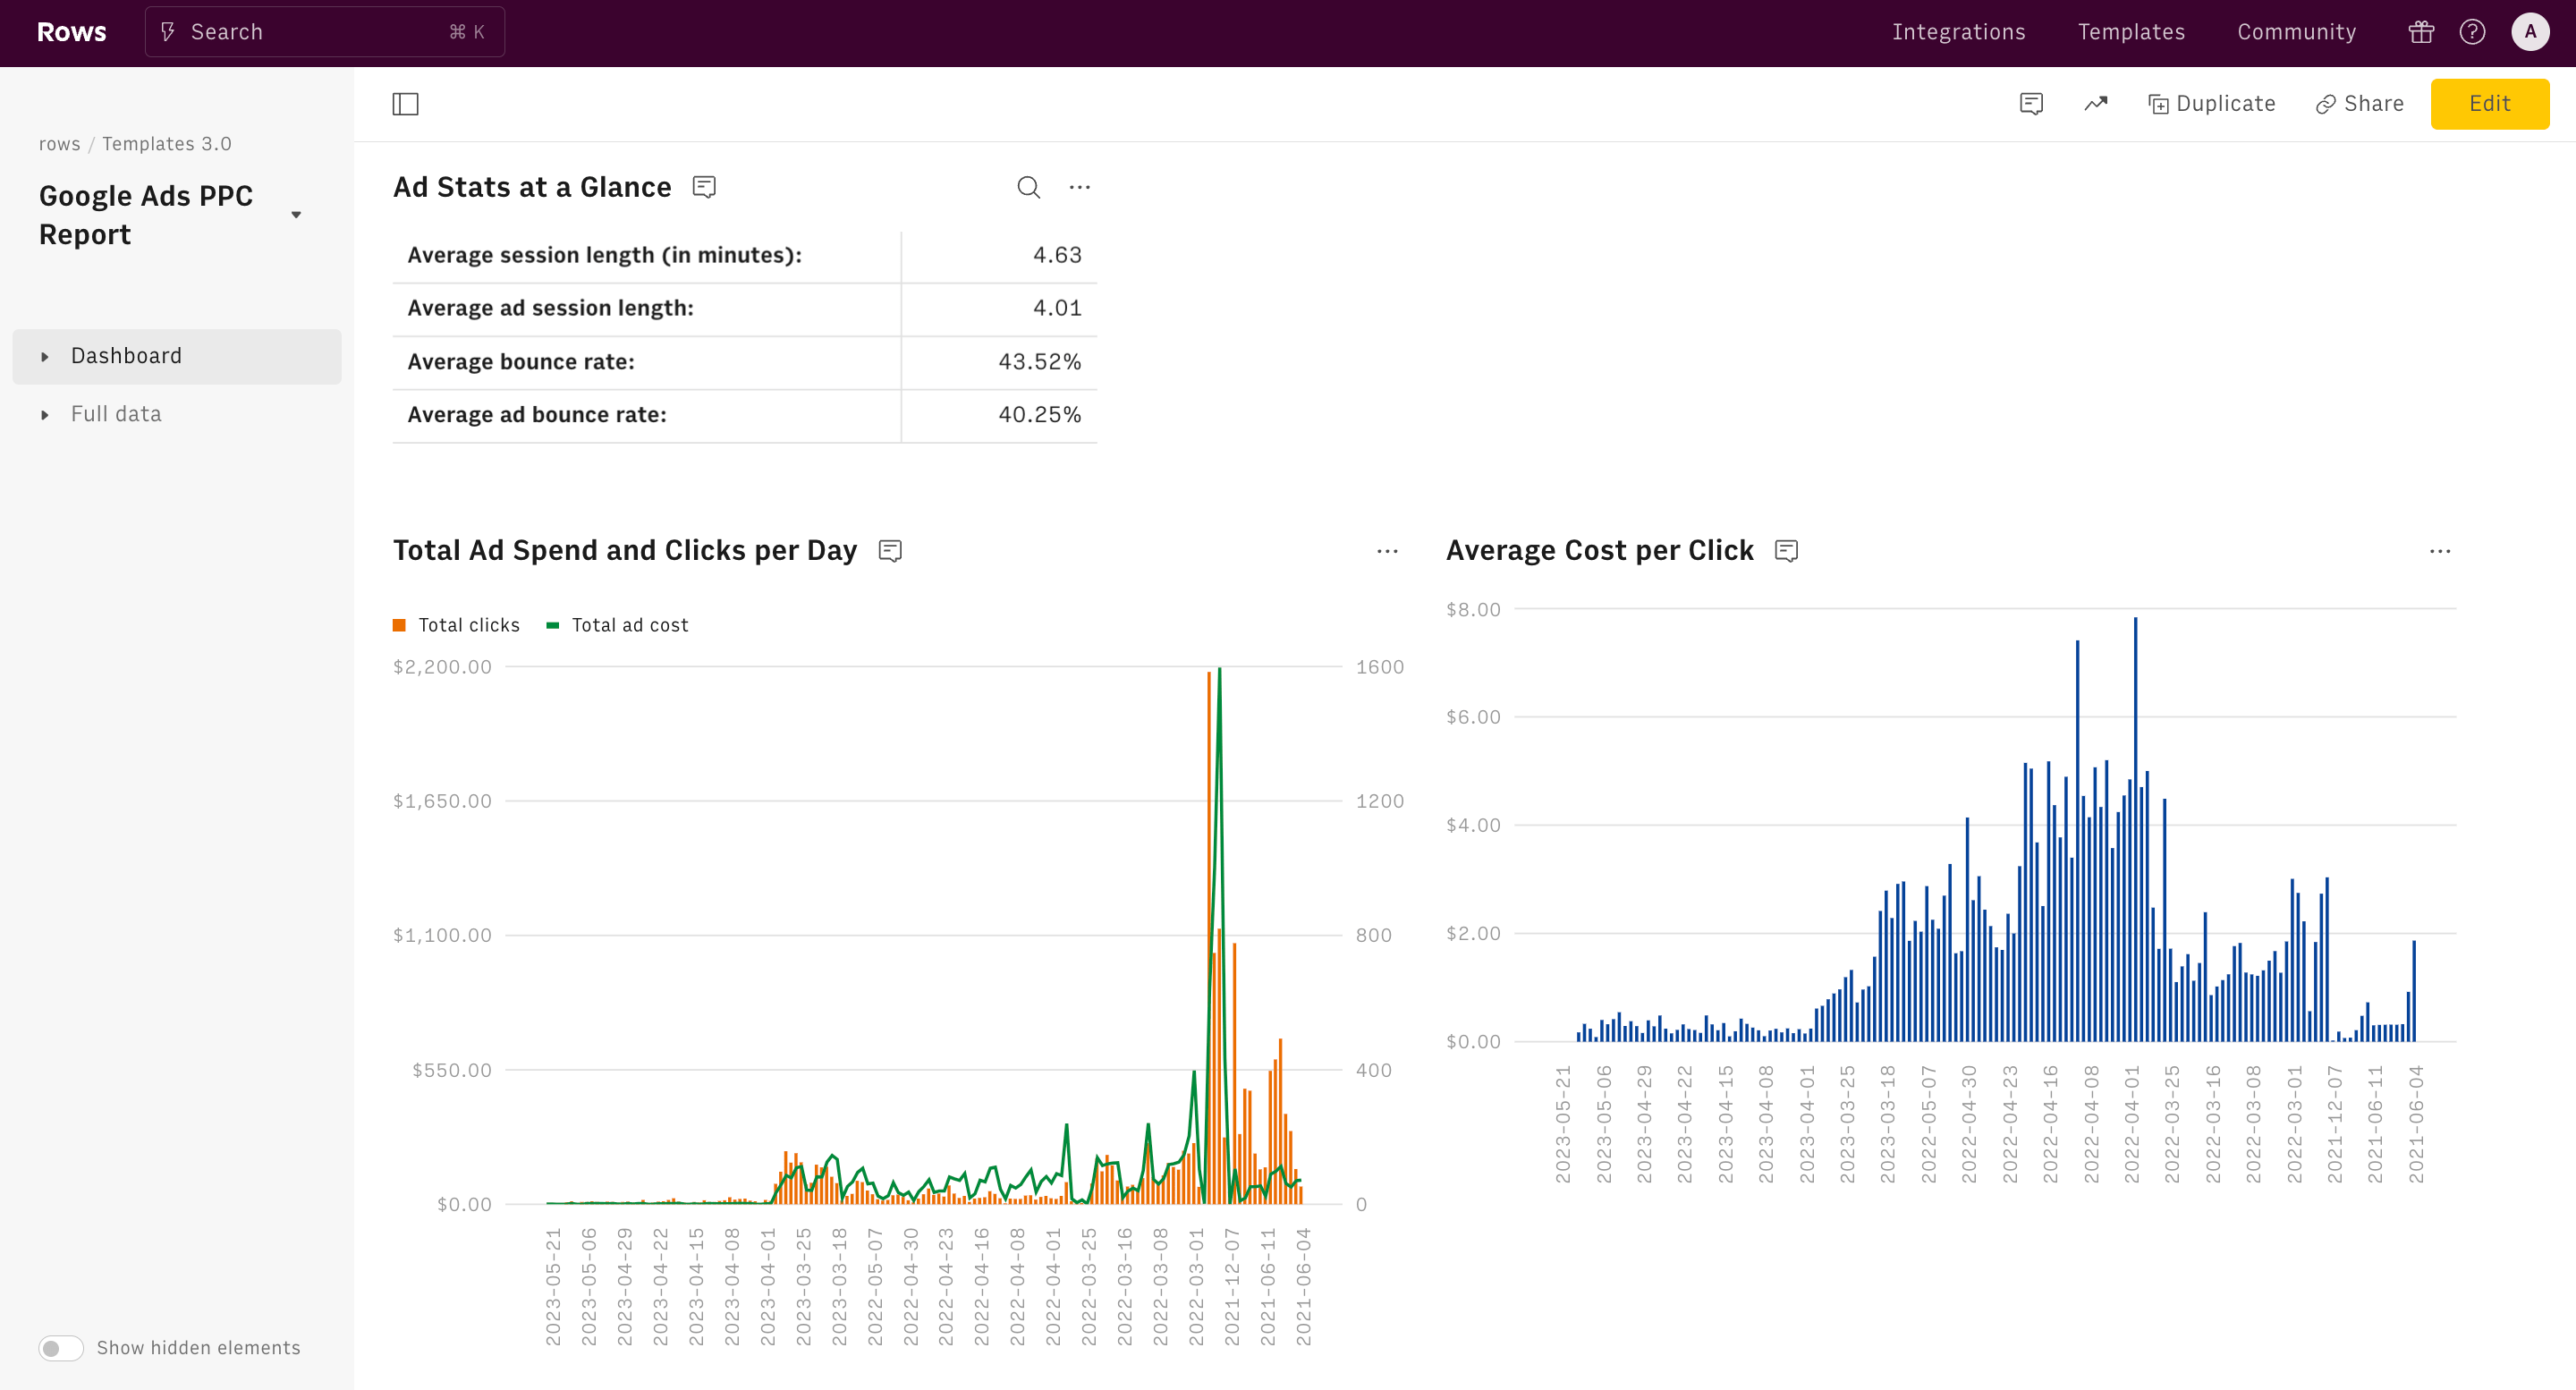
- Traffic: Organic sessions, top landing pages, user behavior (bounce rate, time on site)
- Rankings: Keyword positions, SERP features, visibility scores
- Conversions: Goal completions, conversion rates, assisted conversions
- Backlinks: New & lost links, referring domains, link quality
Crucially, we present this data visually. Charts, graphs, and tables make it digestible and highlight trends.
Step 4: Add customization options for branding (logo, colors, fonts).
You can edit our SEO report template to fit your client's taste.
First of all you can resize your chart (pixel-perfectly) by just dragging the small arrow icon in the bottom right corner. Then, click on any of the three dotted lines on each table or chart to kick off customization.
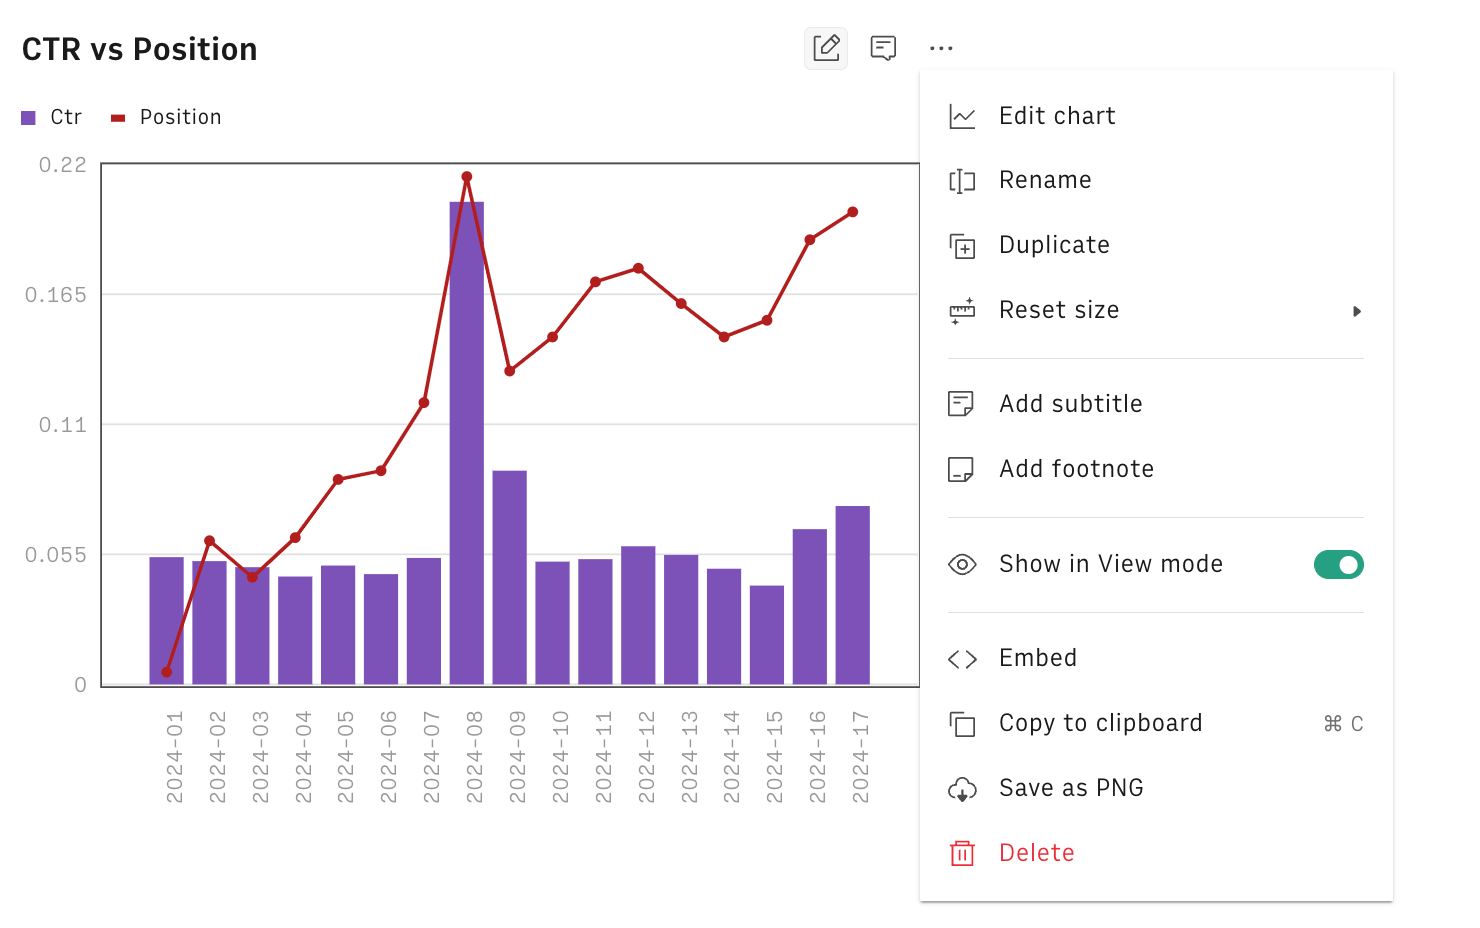
You'll see an array of options—you can edit the chart, rename it to fit any metric, and reset its size. But there's more: explore the Edit chart menu to:
- choose from 8 different chart types. - add you brand colors - you can add subtitle and footnote, to give better context to the reader - you can highlight some data point with different color and add a custom annotation, to make your narrative more effective
When it comes to tables, click on the Source icon (e.g. Google Search Console) to:

- Customize metrics and dimensions: change the metrics retrieved from the data source (e.g. Google Search Console), or the dimension used to break down data (e.g. Page, or Date)
- Set up automation: Schedule automatic data updates every hour, day, week, ... for seamless recurring reporting.
- Apply permanent Sort and Filter: define criteria to filter or sort your data, then click Apply.
- Use the Limit feature to display only the first X results in your table—perfect for focused reporting
To add a column to the table, go to the + icon to the right border of the table and click on:
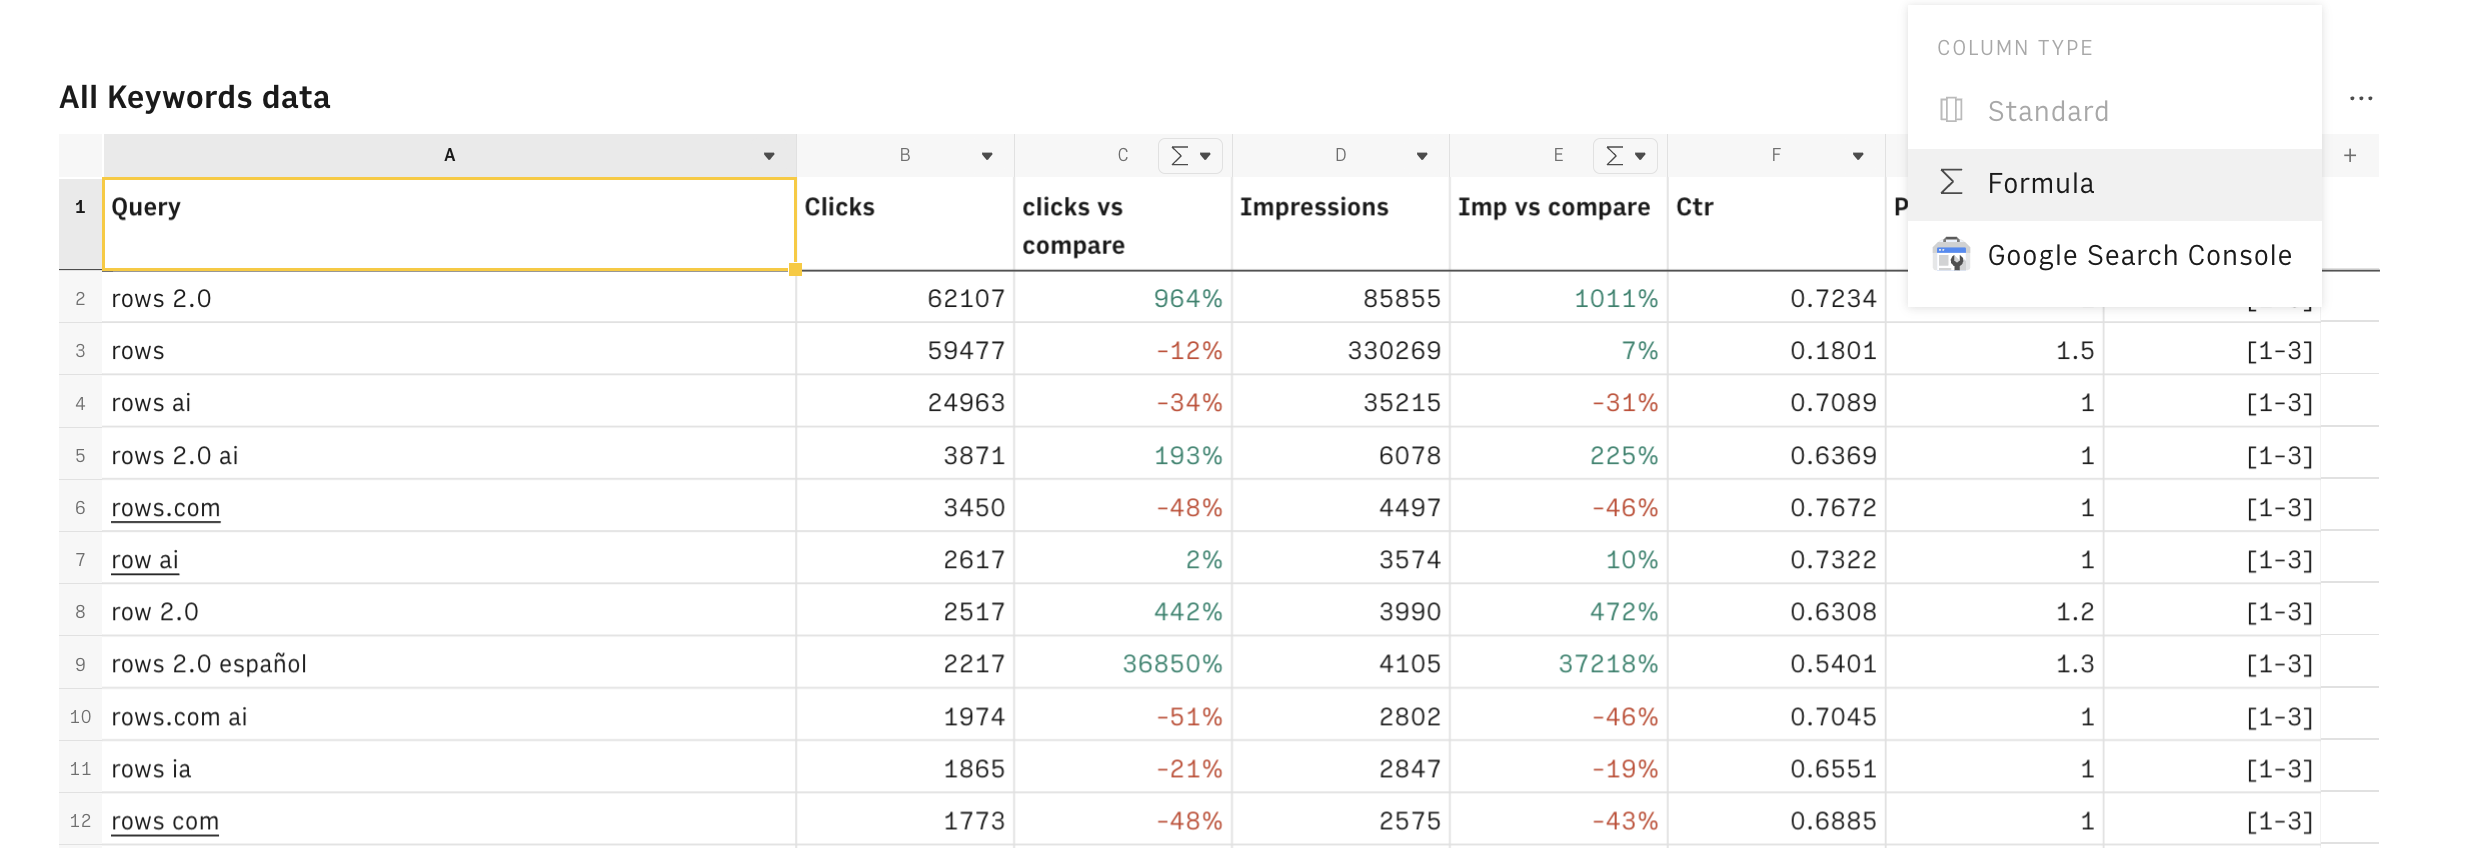
- Add column (with formula): Create a calculated column using a custom formula.
- Add column from source: Bring in additional metrics from the original data source for enhanced analysis.
So, feel free to tailor the charts to suit your client’s needs and service offerings. As a rule of thumb, remember to title your template.
One of the best features you've got in your hands is our AI Analyst. With this feature, you can do any task from asking questions — Rows has an OPENAI integration, which means you can use AI to analyze data. In addition to that, you can summarize tables and create more charts if you want.
Note💡: In addition to our SEO report template, we have some other templates for SEO reporting — this time around, we are looking at templates that are created for specific use cases ranging from keyword research, cannibalization, keywords clustering to CTR — Check out the 15 Best SEO Dashboards in 2024 from Rows.
Step 5: Test the template for usability and clarity.
The last step is to test the template for usability — is it easy to use? And clarity — does it showcase data in an easy to understand manner? Also check how easy it is to aggregate a d manipulate data.
If it matches your taste on usability and clarity, then you can go ahead and continue using the template.
Best Practices for Using an SEO Report Template
You’ll want to start creating reports for your client right away - but don’t jump the gun.
Understanding and implementing best practices will improve the quality of the reports your clients receive.
Here are a few best practices to apply:
1. Schedule regular updates to maintain accuracy.
To get the best results out of reporting, you must ensure that there's regular refresh of live data. Schedule regular data updates to maintain accuracy of metrics. When there's fresh data, there's new insights.
2. Use simple language to explain technical metrics.
Don't make your reports overwhelming for clients to understand. Use simple language while sticking to popular jargons native to your client's industry. For the complex metrics, add extra notes and insights.
3. Incorporate storytelling to provide context for data trends.
When presenting reports, you need to care about how your audience feels. So, when using an SEO report template, use storytelling to add context to data trends. The emphasis is to answer the question “why”.
4. Include a summary section with key takeaways and next steps.
Add summaries and key takeaways when using report templates. In essence, infuse actionable steps that can be taken to avert decrease in performance. In summary, the goal is to make sense of data with the basic things — simplicity, clarity and relevance.
Eli Schwartz mirrors these practices perfectly in this post
Conclusions
A structured SEO report template can transform your client reporting process, providing consistency, clarity, and value. With Rows' free SEO reporting template, life becomes easier. It's free to use; all you have to do is sign up to get a Rows, and viola! You are on the way to creating your best SEO reports yet.
How it works
How it works
Get started
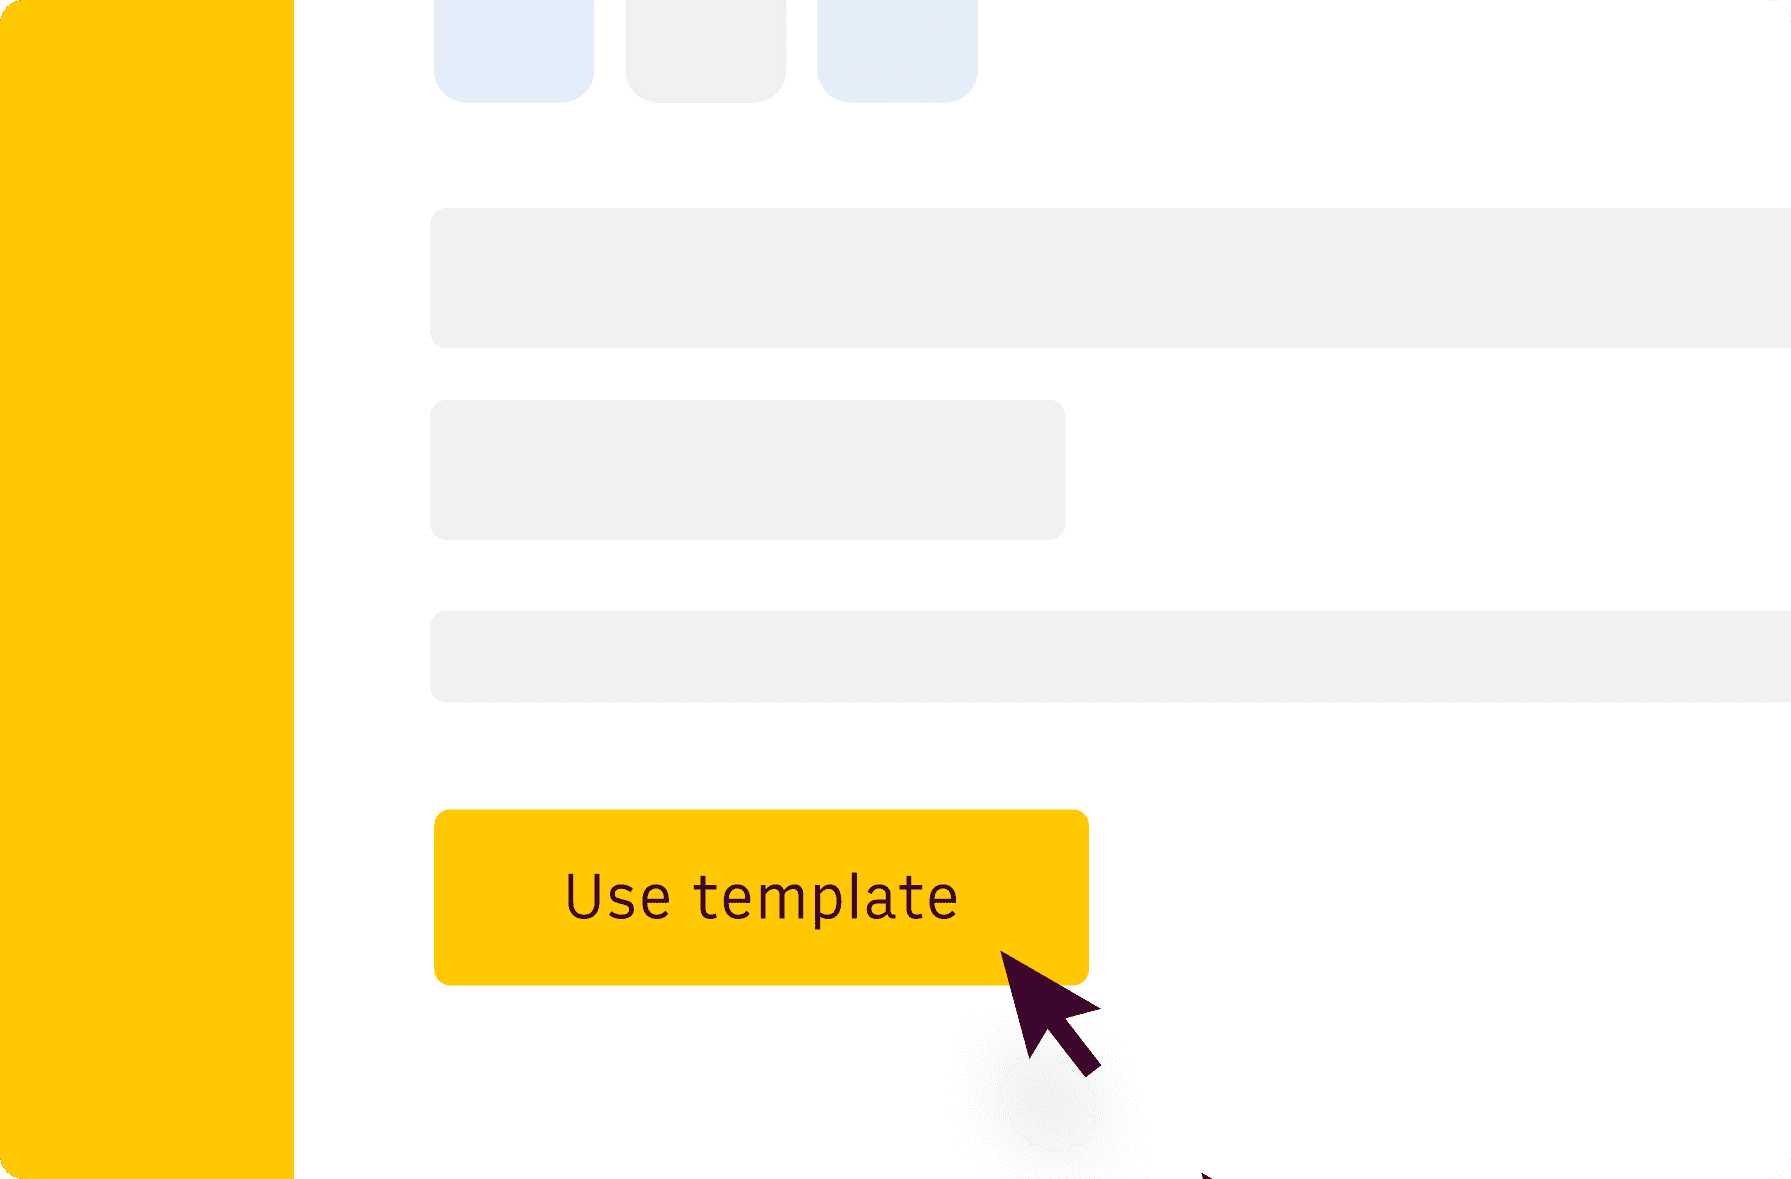
Click on 'Use template' and start using it right away. No forms, no signup. Your data first.
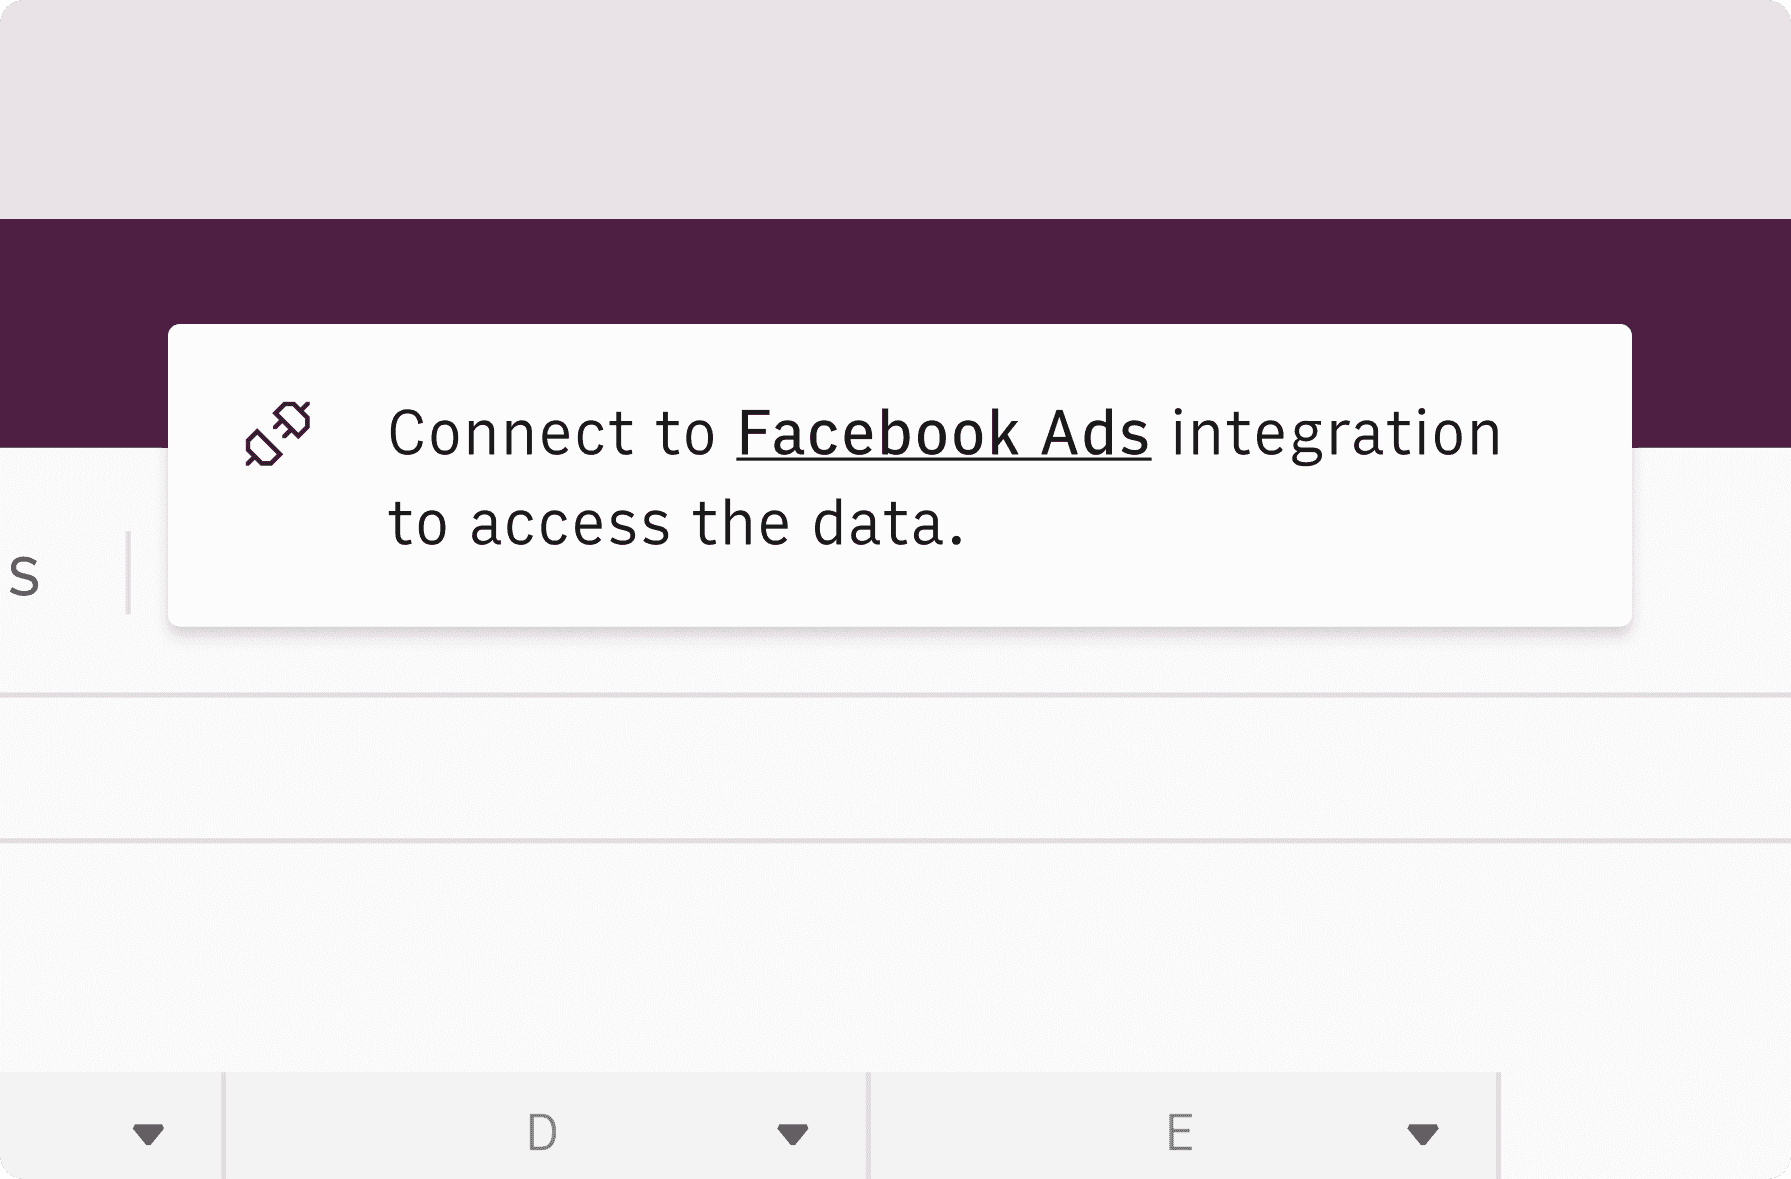
Connect your Search Console and GA4 accounts
Once landed on the spreadsheet, follow the instructions to connect the required integration and pick your account.
Customize the template and schedule refresh
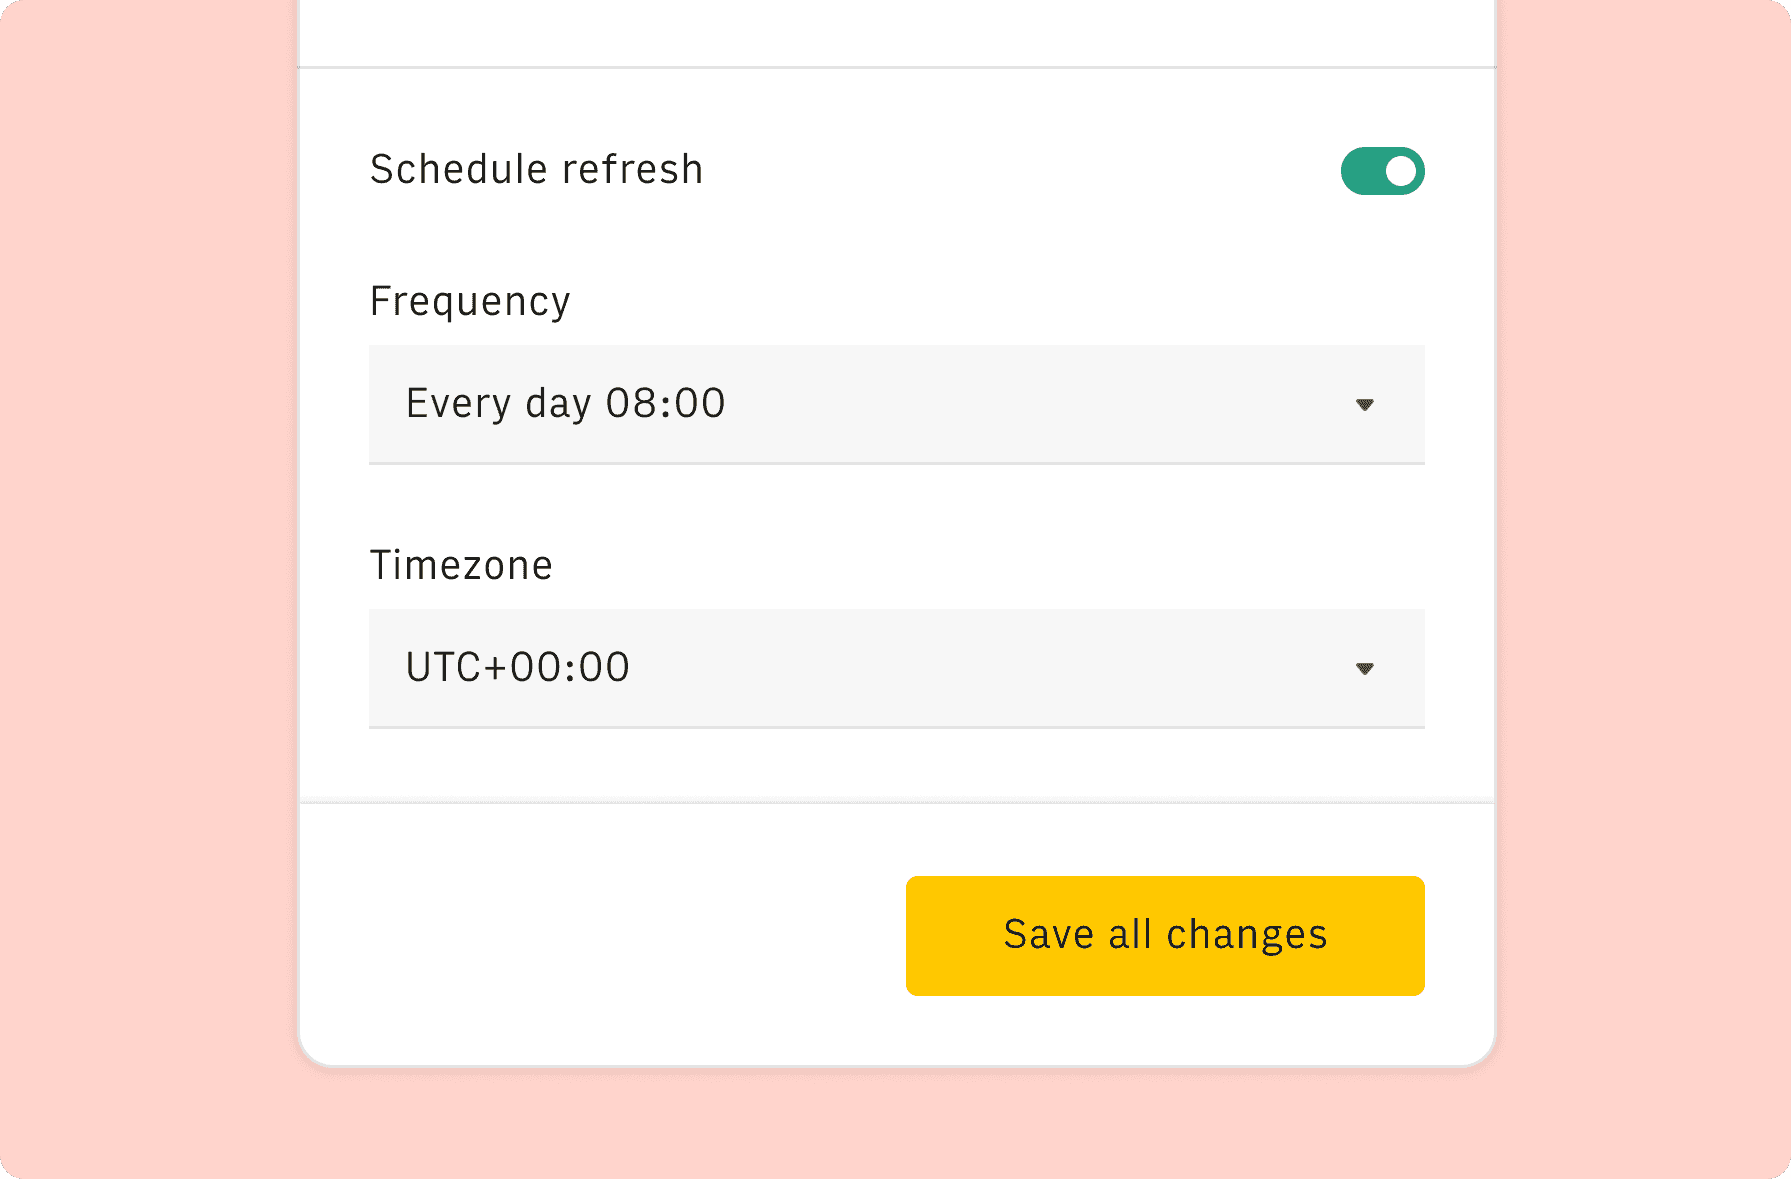
Once the integration has been connected, all tables will update automatically with your own data. Click on 'Edit Source' to change the retrieved data and automate the data refresh. You can then insert a chart or a pivot table, add a column or personalize formats, using all the regular functions and shortcuts that make spreadsheets great.
Embed tables and charts
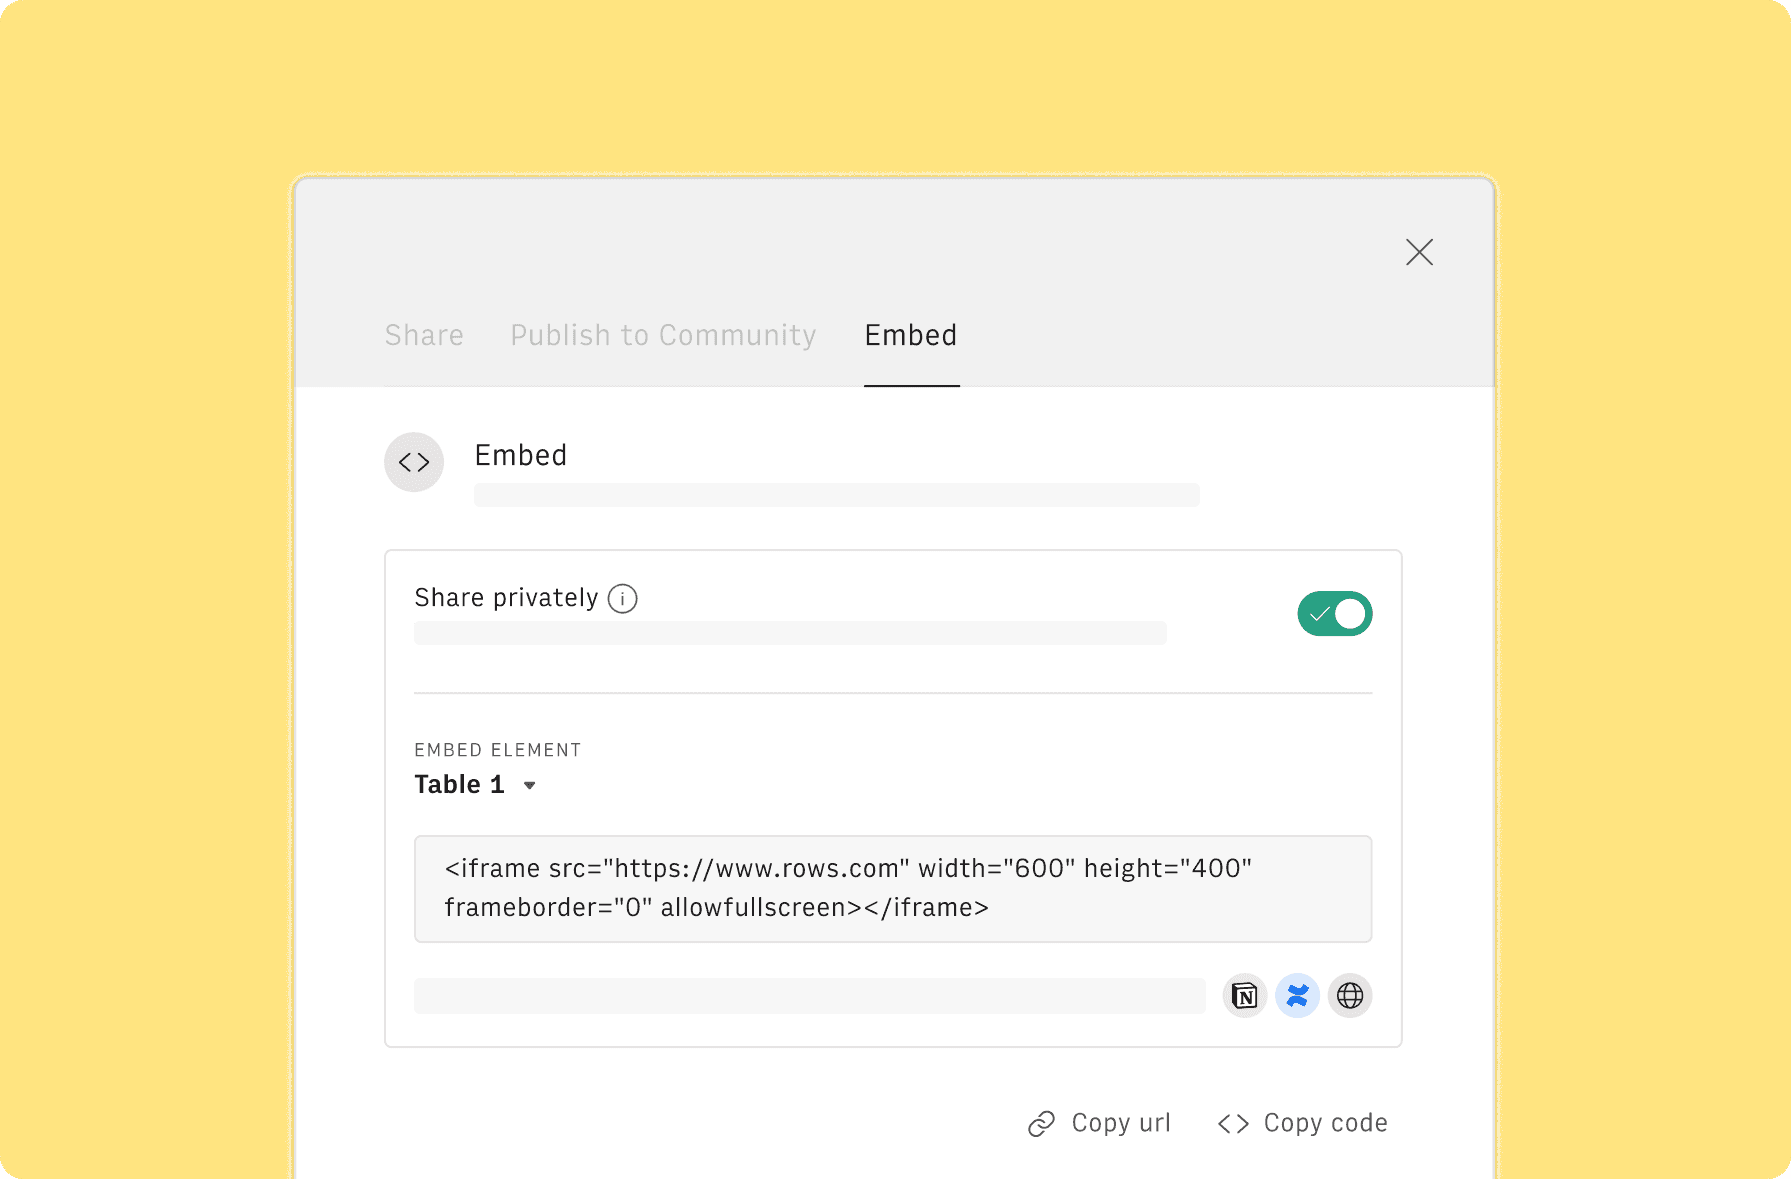
Click on the option menu to embed tables and chart on your Notion, Confluence or any other iframe-ready documents.
Questions and answers
Can I use Rows for free?
More than a Free SEO Report Template for Agencies
Rows is your new AI Data Analyst. It lets you extract from PDFs, import your business data, and analyze it using plain language.
Signup for free
Import your business data
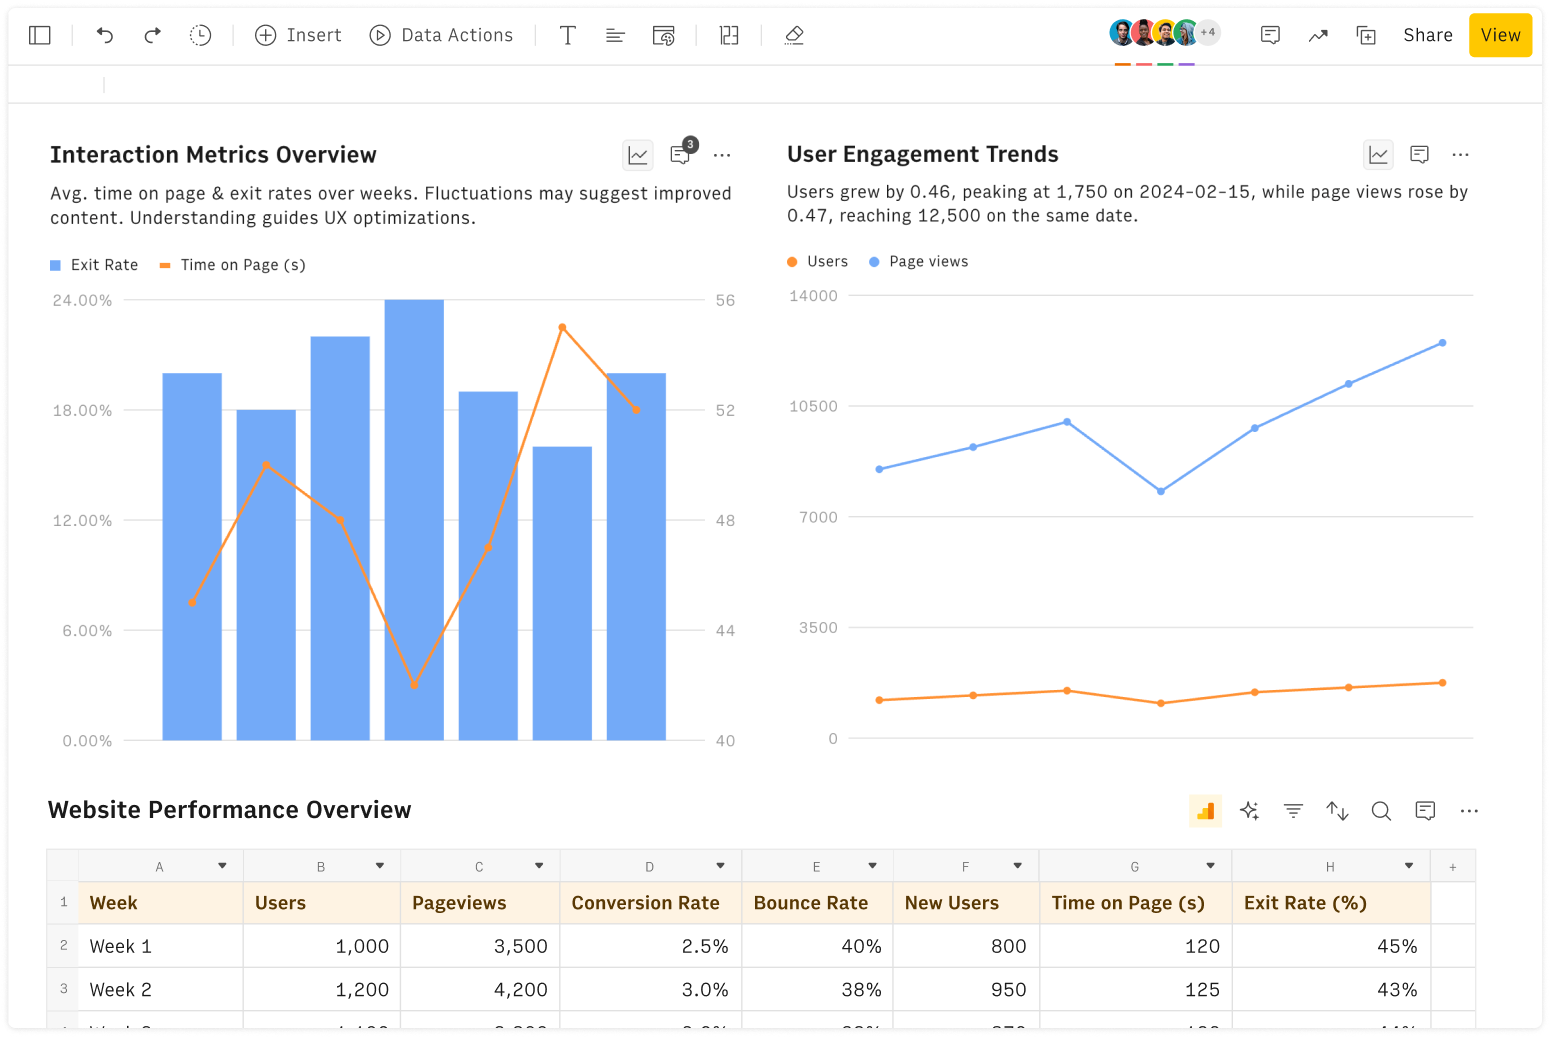
Extract from PDFs and images, import from files, marketing tools, databases, APIs, and other 3rd-party connectors.
Know moreAnalyze it with AI
Ask AI✨ any question about your dataset - from VLOOKUPs to forecasting models - and surface key insights, trends, and patterns.
Know moreCollaborate and Share
Seamlessly collaborate and share stunning reports with dynamic charts, embed options, and easy export features.
Know more
