
Content Grouping Tool
Check the search performance of your website's subfolders using page grouping.
 100% spreadsheet
 Connected to your data
 Daily+ refresh
 Embed everywhere
About Content Grouping Tool
What is Content Grouping?
Content grouping is defined as categorizing and grouping pages and screens into custom buckets. The custom buckets allow you to see metrics for related groups of information. For \example, an e-commerce site that sells fashion accessories might create groups like "children's Clothing" and "Women's Clothing." This allows the site owner to track metrics such as user engagement and conversion rates for each category, providing insights that inform marketing strategies and content optimization efforts. Note that content grouping is not keyword clustering. In essence, content grouping focuses on page organization for analytics, while keyword clustering targets keyword optimization for SEO.
When to use content grouping?
Content grouping allows businesses to assess the performance of various content types more effectively.
But it's one thing to understand its benefits, it's another thing to know when exactly to use it.
Want to know when best to execute content grouping? Check the below use cases:
1. User behavior analysis
Do you want to know how users interact with your pages and what they feel after leaving them? Then, do content grouping. If you want to understand how different site sections perform, content grouping allows you to aggregate data for related pages. This can help you identify which categories engage users most effectively. Accessing multiple pages at once without grouping them will be hectic — because of a large data pool.
2. Marketing ROI measurement
Want to know the return on investment from a marketing campaign or SEO strategy? Then, execute content grouping. By grouping the content of landing pages and sponsored posts, you can view performance analytics and find top-performing and high-yielding pages.
3. Content strategy planning
Before you plan your content strategy for a new quarter or year, analyze your existing content. Group them and find out how they performed on the search. With this action, you can work on optimizing future content by finding loopholes in your previous content. Additionally, you can focus on high-potential topics and create clusters that can increase organic traffic.
How to do content grouping with the Rows content grouper tool
Want to know if our content grouping tool is worth a try? Here are 3 stand out features of this tool:
Data ingestion ability — deals with importing or processing data from multiple sources into a spreadsheet. On this template, you can easily pull live data from GSC into a spreadsheet and group content easily.
Integration with AI — With the AI Analyst, you ask AI to analyze, summarize, transform, and enrich your analysis. A chat interface will open on the right: you can ask a broad range of questions, from basic spreadsheet commands - plotting a chart or adding or formatting columns - to more complex tasks, such as slicing, pivoting, or computing metrics about your data. For example, given a dataset, you can ask the Analyst to add a column
In addition, our AI Analyst is instructed to use our native OPENAI functions to perform data enrichment or extraction tasks. For example, you can ask the AI analyst to run a sentiment analysis on a list of product reviews.
- Data handling and visualization capabilities: Without proper management, grouped data can become overwhelming, making it difficult to draw actionable insights. But with Rows, WYSIWYG with Rows — with a tidy UI, you can have a perfect view of the charts when comparing various content pages.
Below are steps on how to use Rows’ content grouping tool:
Step 1: On this page, click on "Use Template".
Once done, you'll see a pop-up that shows — “Select spreadsheet destination” — click on “Create a spreadsheet.”
Step 2 : Connect Google Search Console integration to Rows.
Without connecting your accounts, you'll be unable to access insights and analytics about your page.

Step 3: Pick a “days” range.
You can observe how your keyword rankings change over time by specifying a specific number of days. This allows you to identify and map out content over that specific time.

In summary:
- Connect your Google Search Console property
- Enter the period of analysis (e.g. last 90 days)
- Choose between two different comparison methods: Previous Period vs Year on Year
- Input the conditions to create the page clusters (e.g., for group 1, the page contains '/templates/,’ for group 2, the page contains '/tools/,’ etc.)
Top metrics at a glance in Rows Content Grouper tool
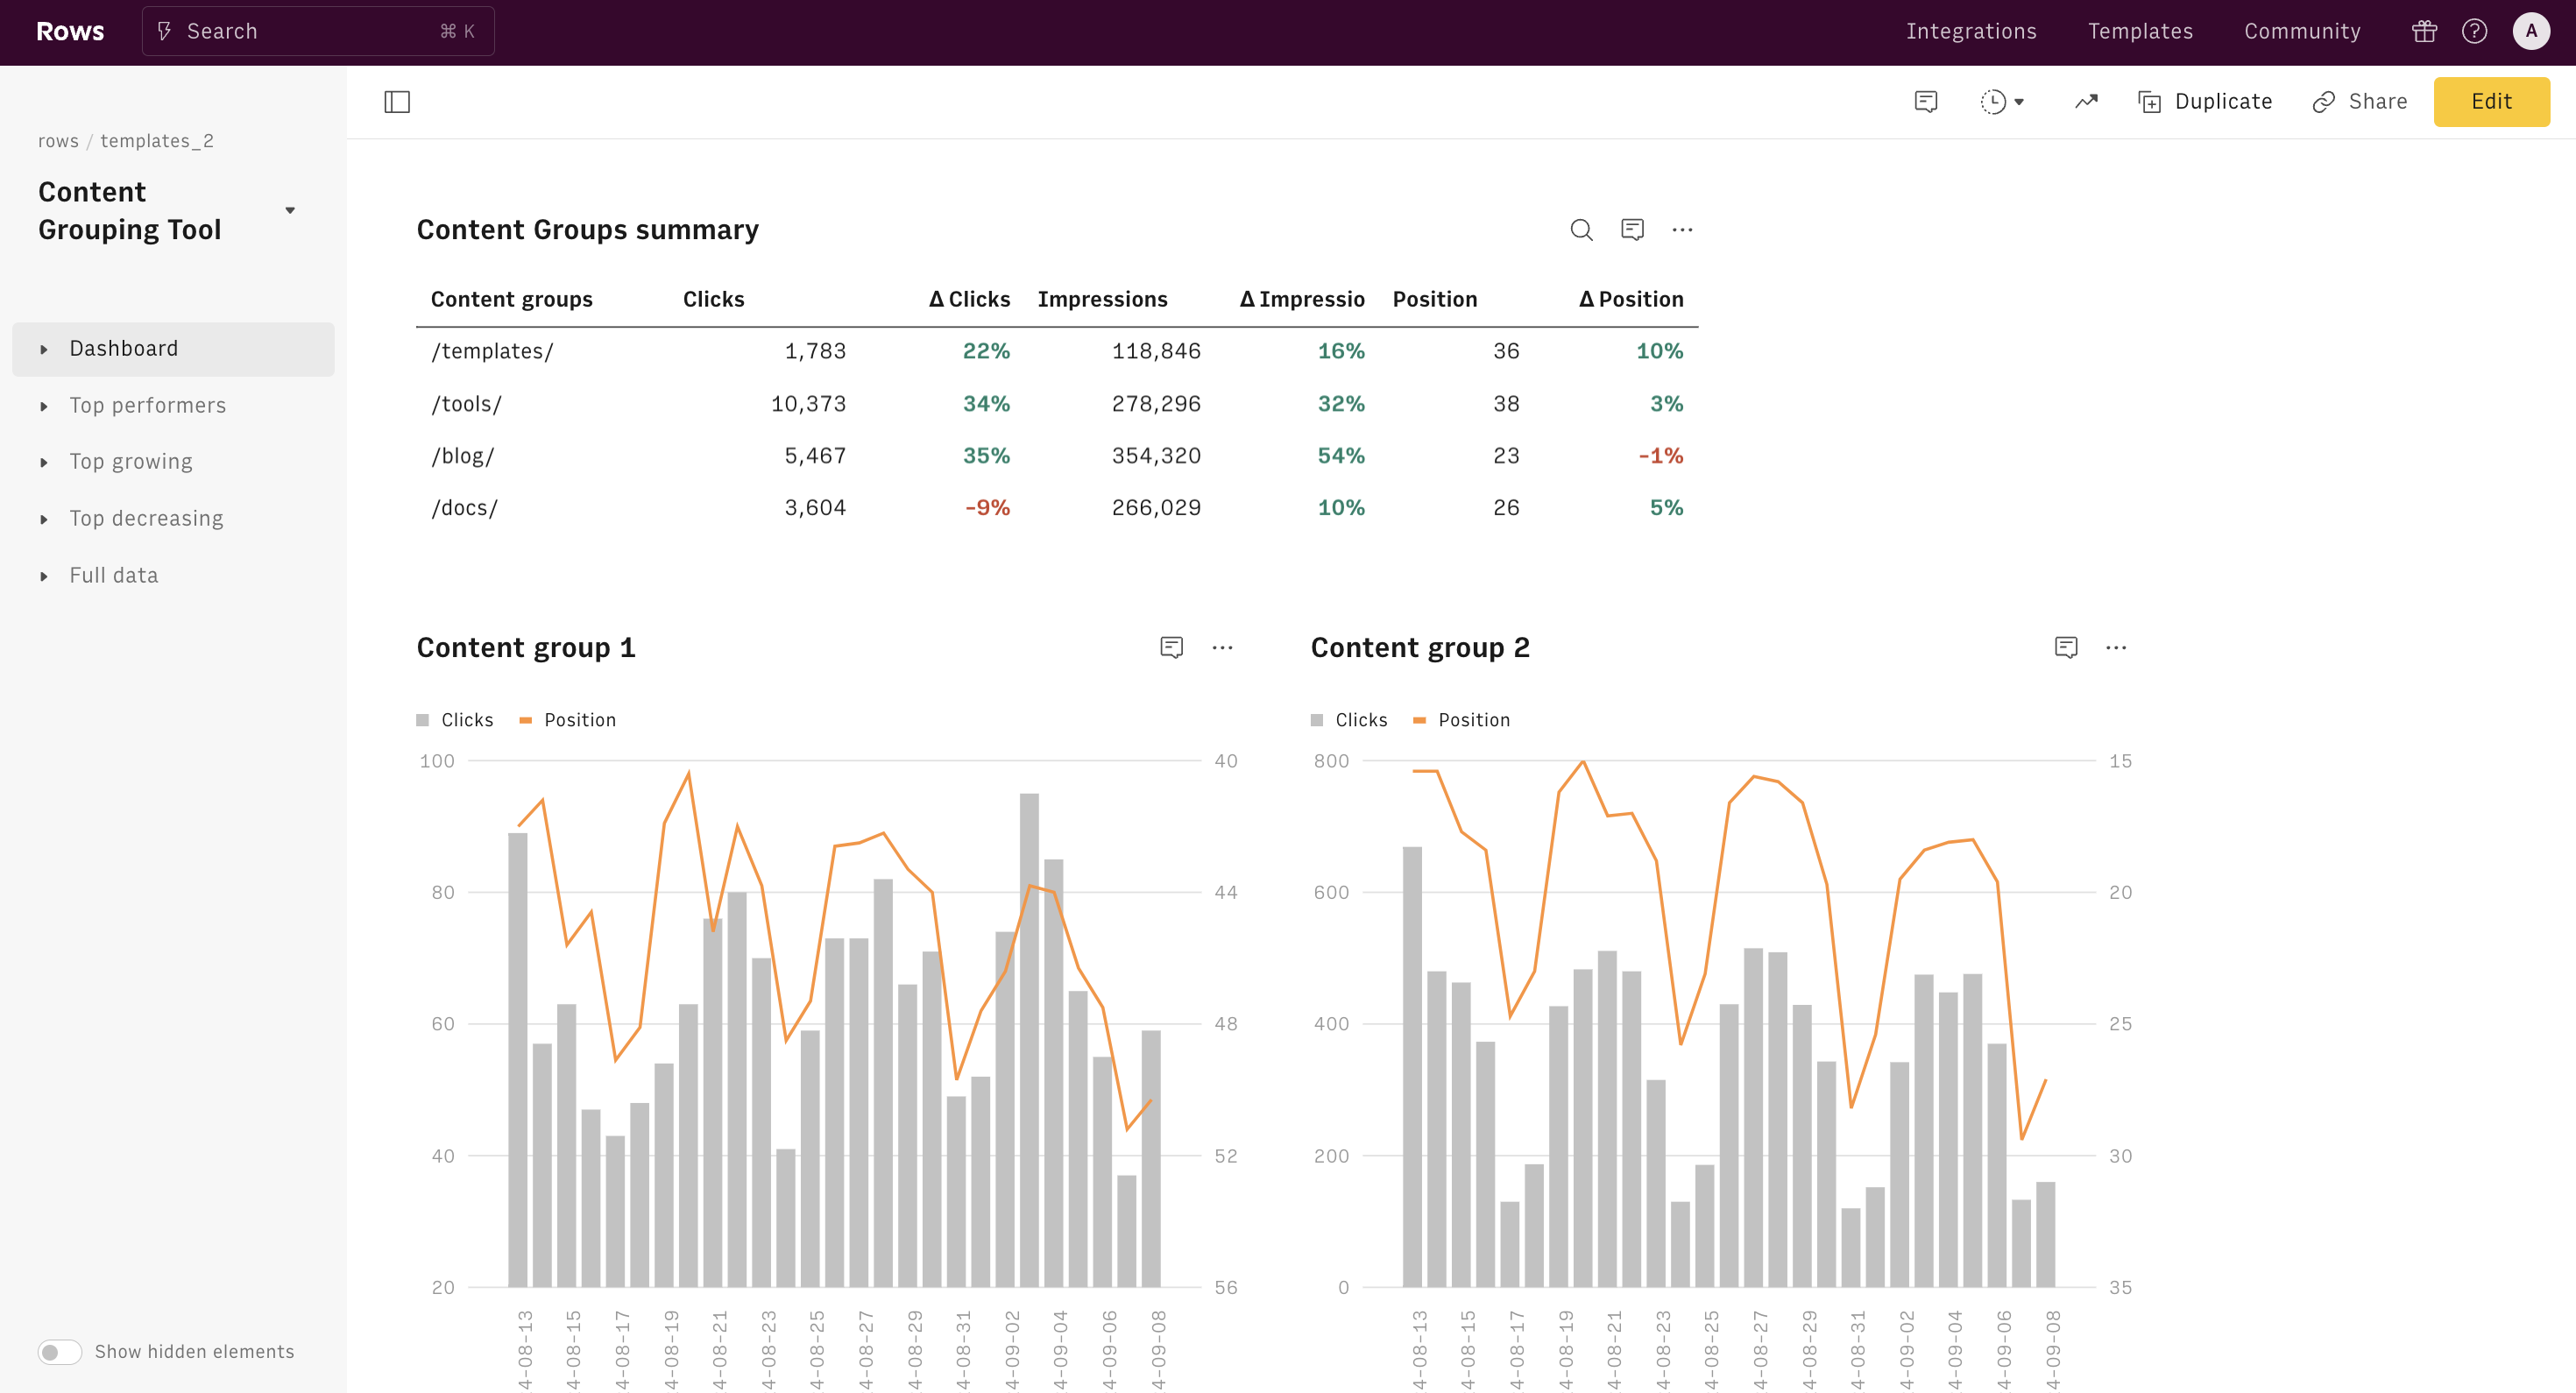
In the content grouping dashboard are various spreadsheet tables and charts to show you key summaries of figures about your content pages.
- There's a Summary table with aggregated performance in the period for all 4 groups, and % change vs the comparison period. It provides a quick overview of how content groups perform across important SEO metrics. Users can easily identify which groups are getting more engagement and visibility.

Four charts that plot the data over the considered period for each content group, showing: clicks (blue line) and position (orange line)
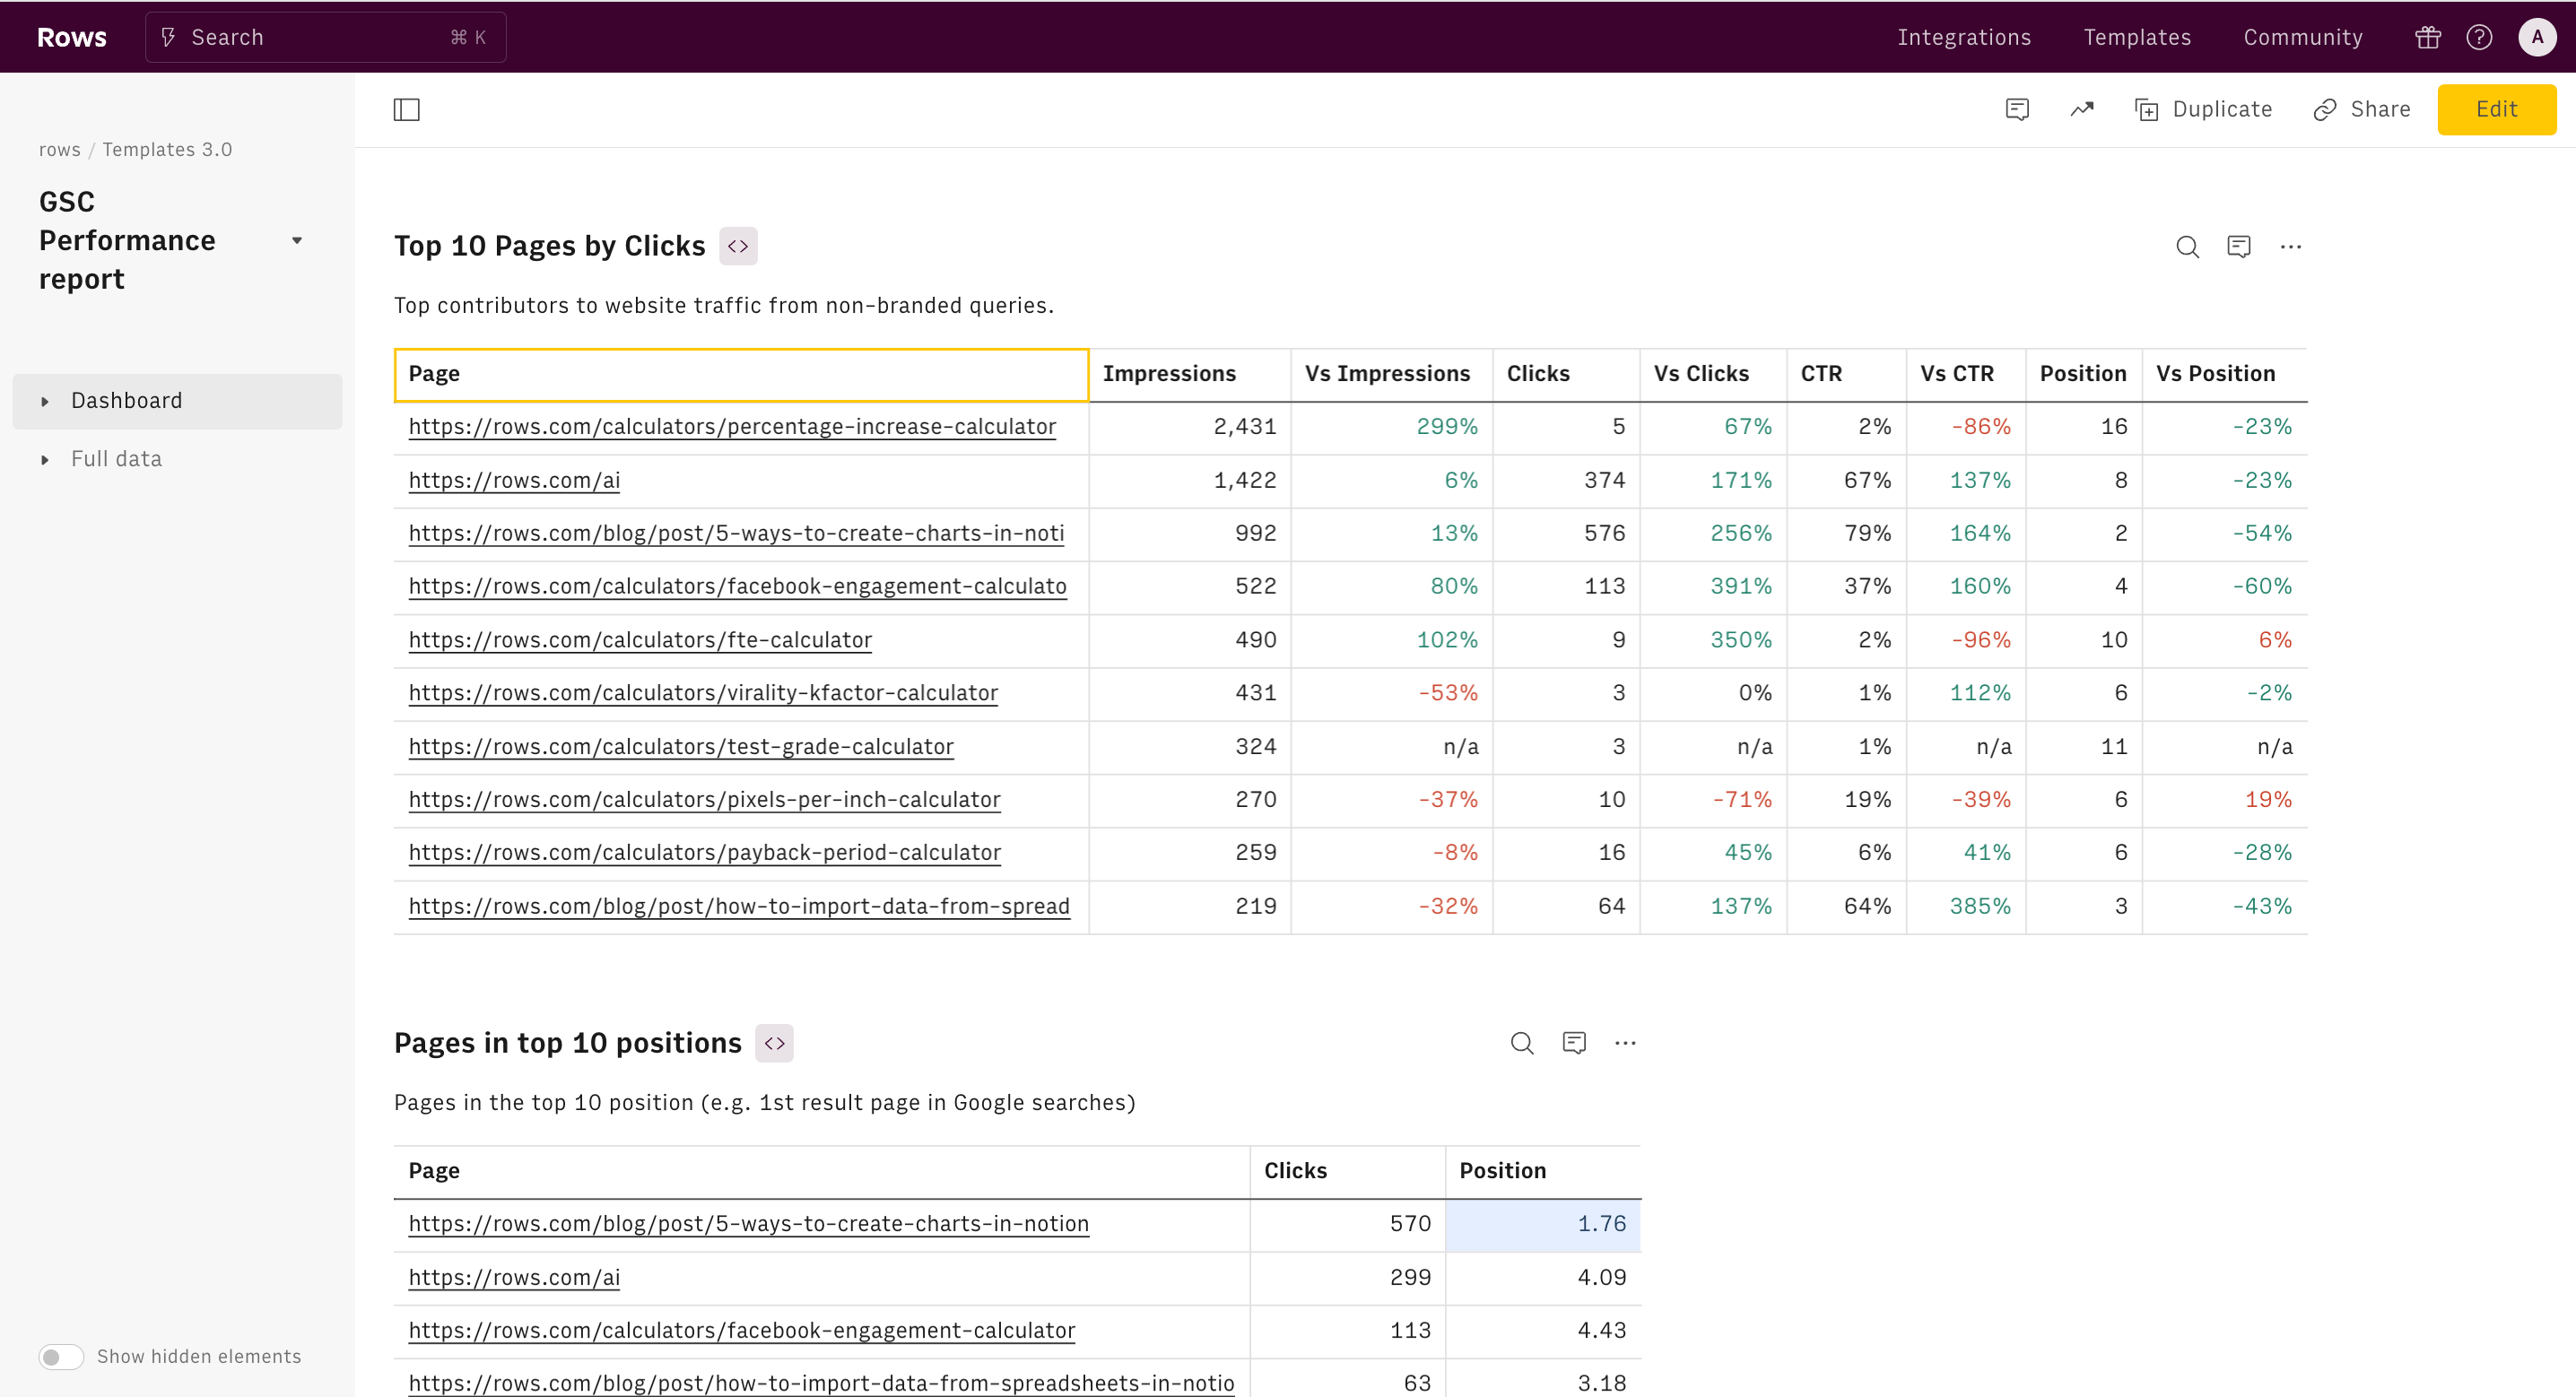
For pages dedicated to extracting top performers and movers among your groups:
Top performers: four extracts that show the top 10 pages in each group that contribute more to your website traffic in terms of clicks Top growing: four extracts that show the 10 most growing groups Top decreasing: four extracts that show the 10 most decreasing groups

The beauty of these charts is that they give you a visual representation of performance over time. Additionally, you can easily spot trends and patterns — and compare clicks and positions simultaneously.
How it works


How it works
Get started
Click on 'Use template' and start using it right away. No forms, no signup. Your data first.
Connect your Google Search Console account
Once landed on the spreadsheet, follow the instructions to connect the required integration and pick your account.
Customize the template and schedule refresh
Once the integration has been connected, all tables will update automatically with your own data. Click on 'Edit Source' to change the retrieved data and automate the data refresh. You can then insert a chart or a pivot table, add a column or personalize formats, using all the regular functions and shortcuts that make spreadsheets great.
Embed tables and charts
Click on the option menu to embed tables and chart on your Notion, Confluence or any other iframe-ready documents.


Questions and answers
Can I use Rows for free?
More than a Content Grouping Tool
Rows is your new AI Data Analyst. It lets you extract from PDFs, import your business data, and analyze it using plain language.
Signup for free

Import your business data
Extract from PDFs and images, import from files, marketing tools, databases, APIs, and other 3rd-party connectors.
Know moreAnalyze it with AI
Ask AI✨ any question about your dataset - from VLOOKUPs to forecasting models - and surface key insights, trends, and patterns.
Know moreCollaborate and Share
Seamlessly collaborate and share stunning reports with dynamic charts, embed options, and easy export features.
Know more