
Keyword Clustering Tool
Use data from Google Search Console to cluster the keywords you are ranking and measure topical performance.

 100% spreadsheet
 Connected to your data
 Daily+ refresh
 Embed everywhere
About Keyword Clustering Tool
What is a Keyword Clustering Tool?
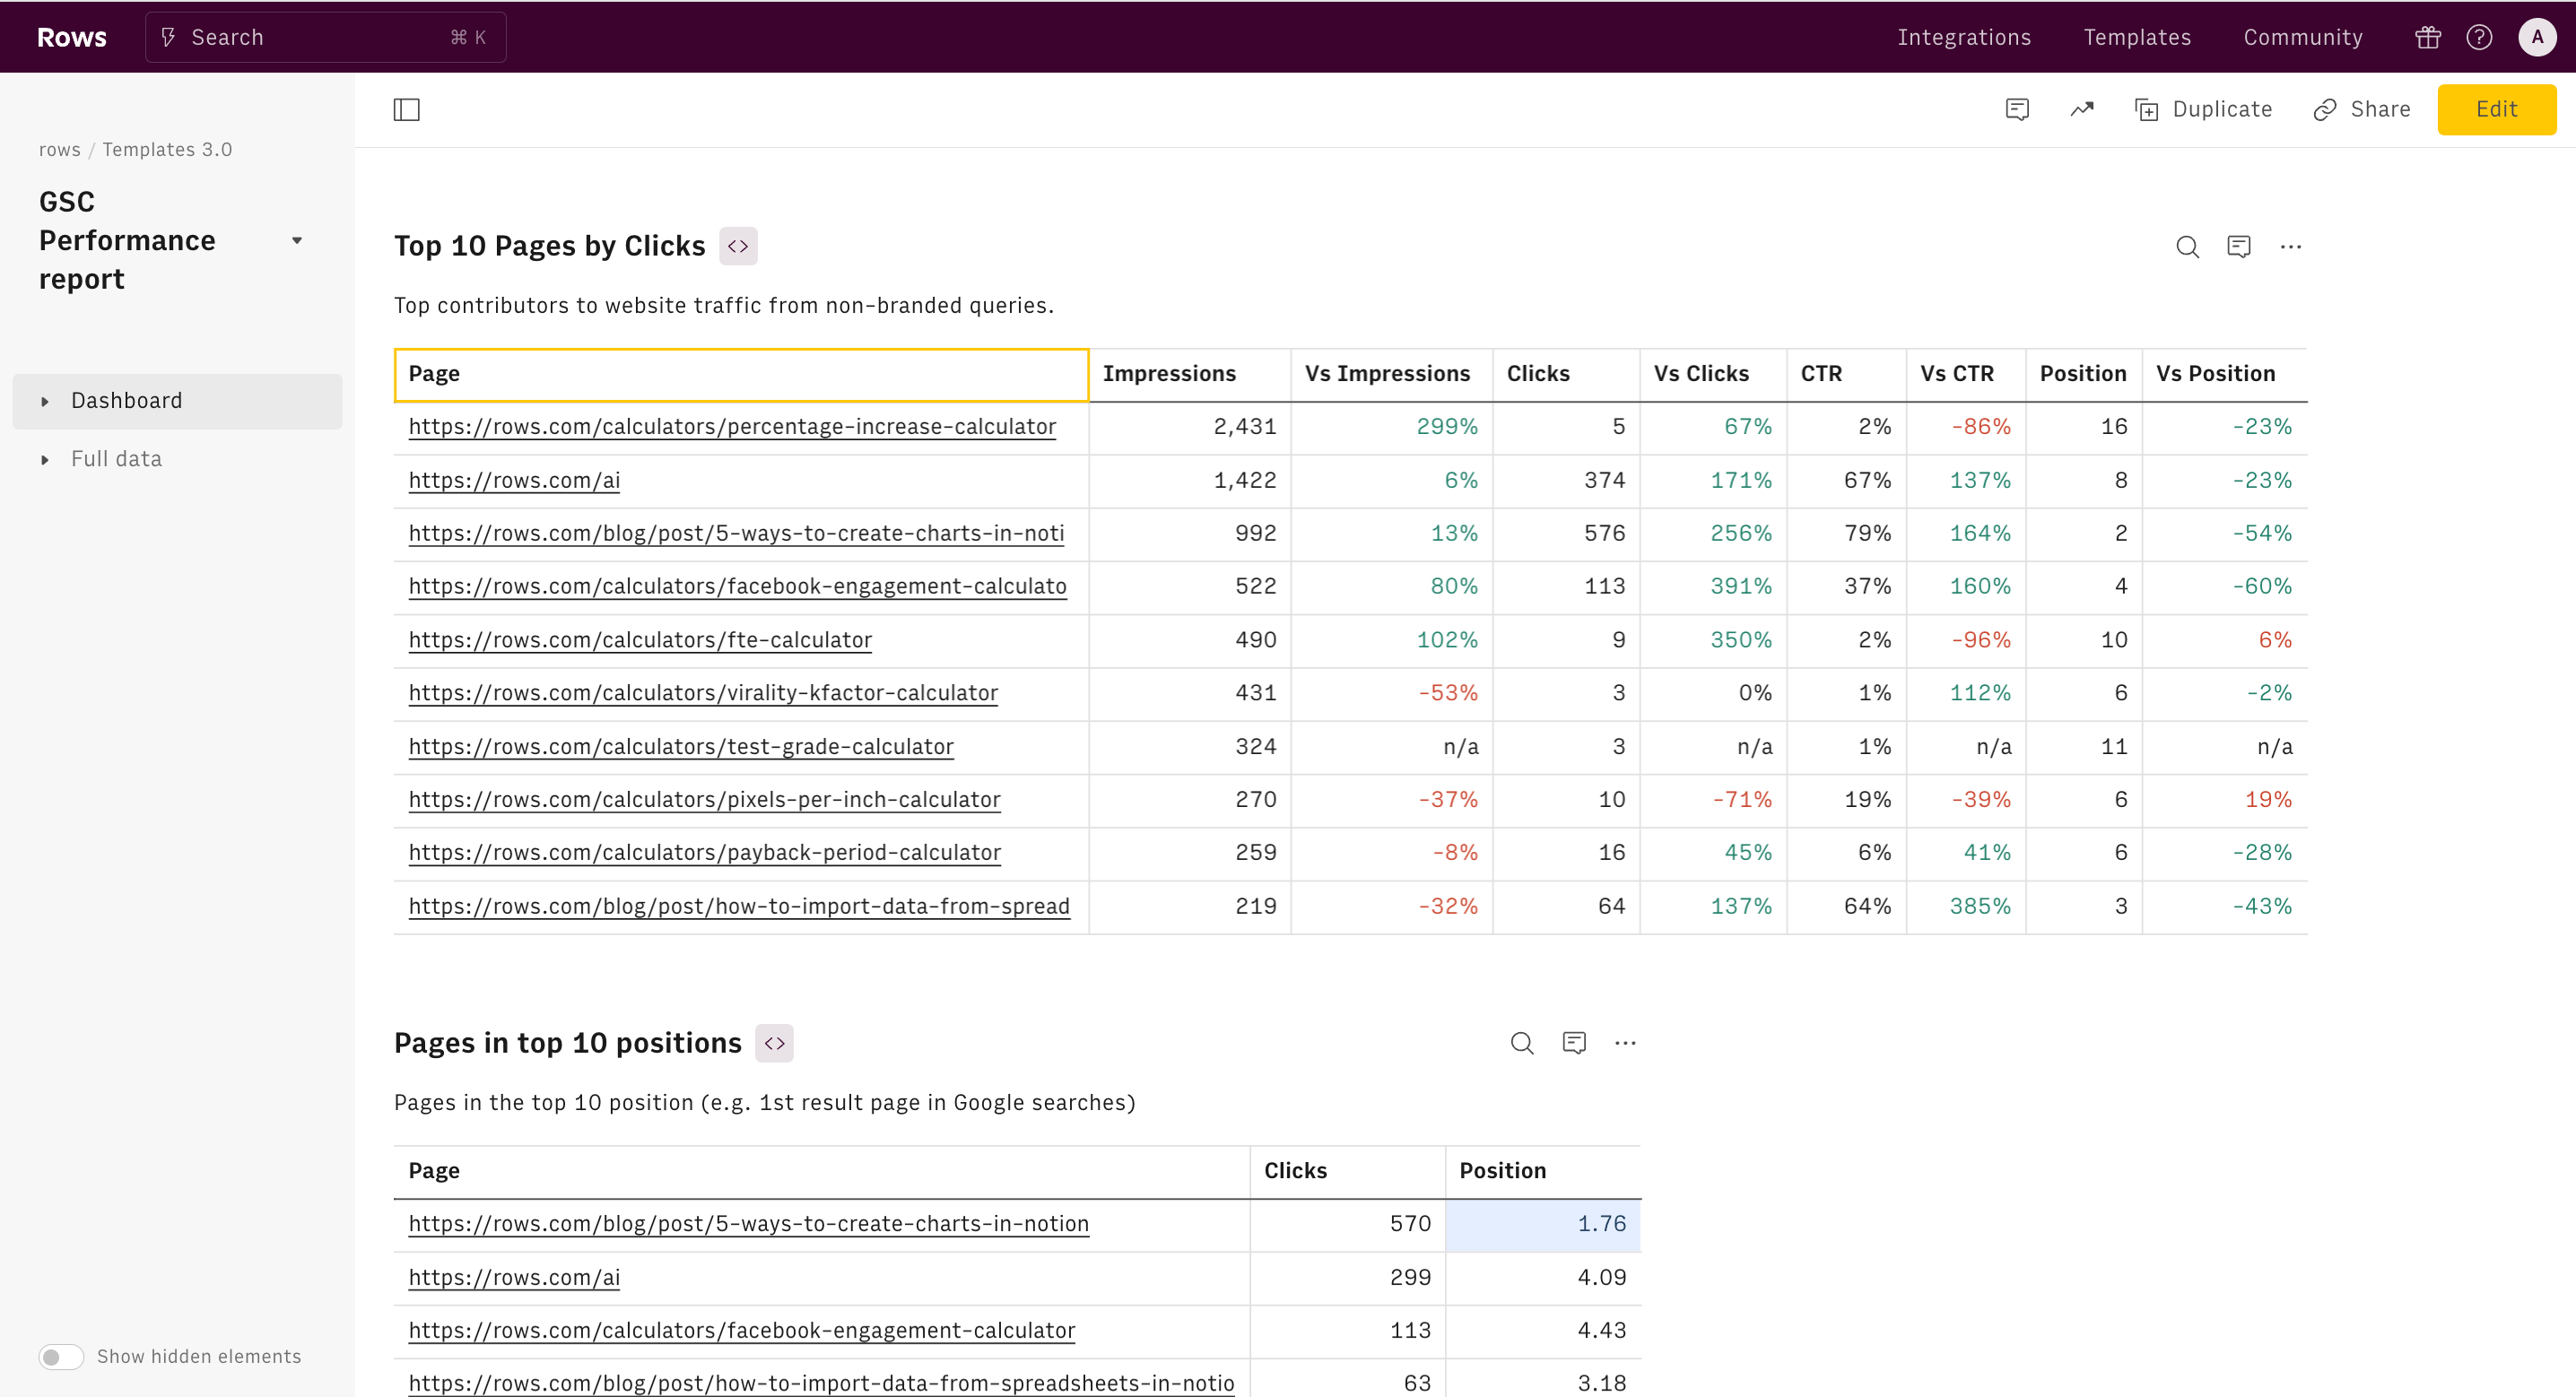
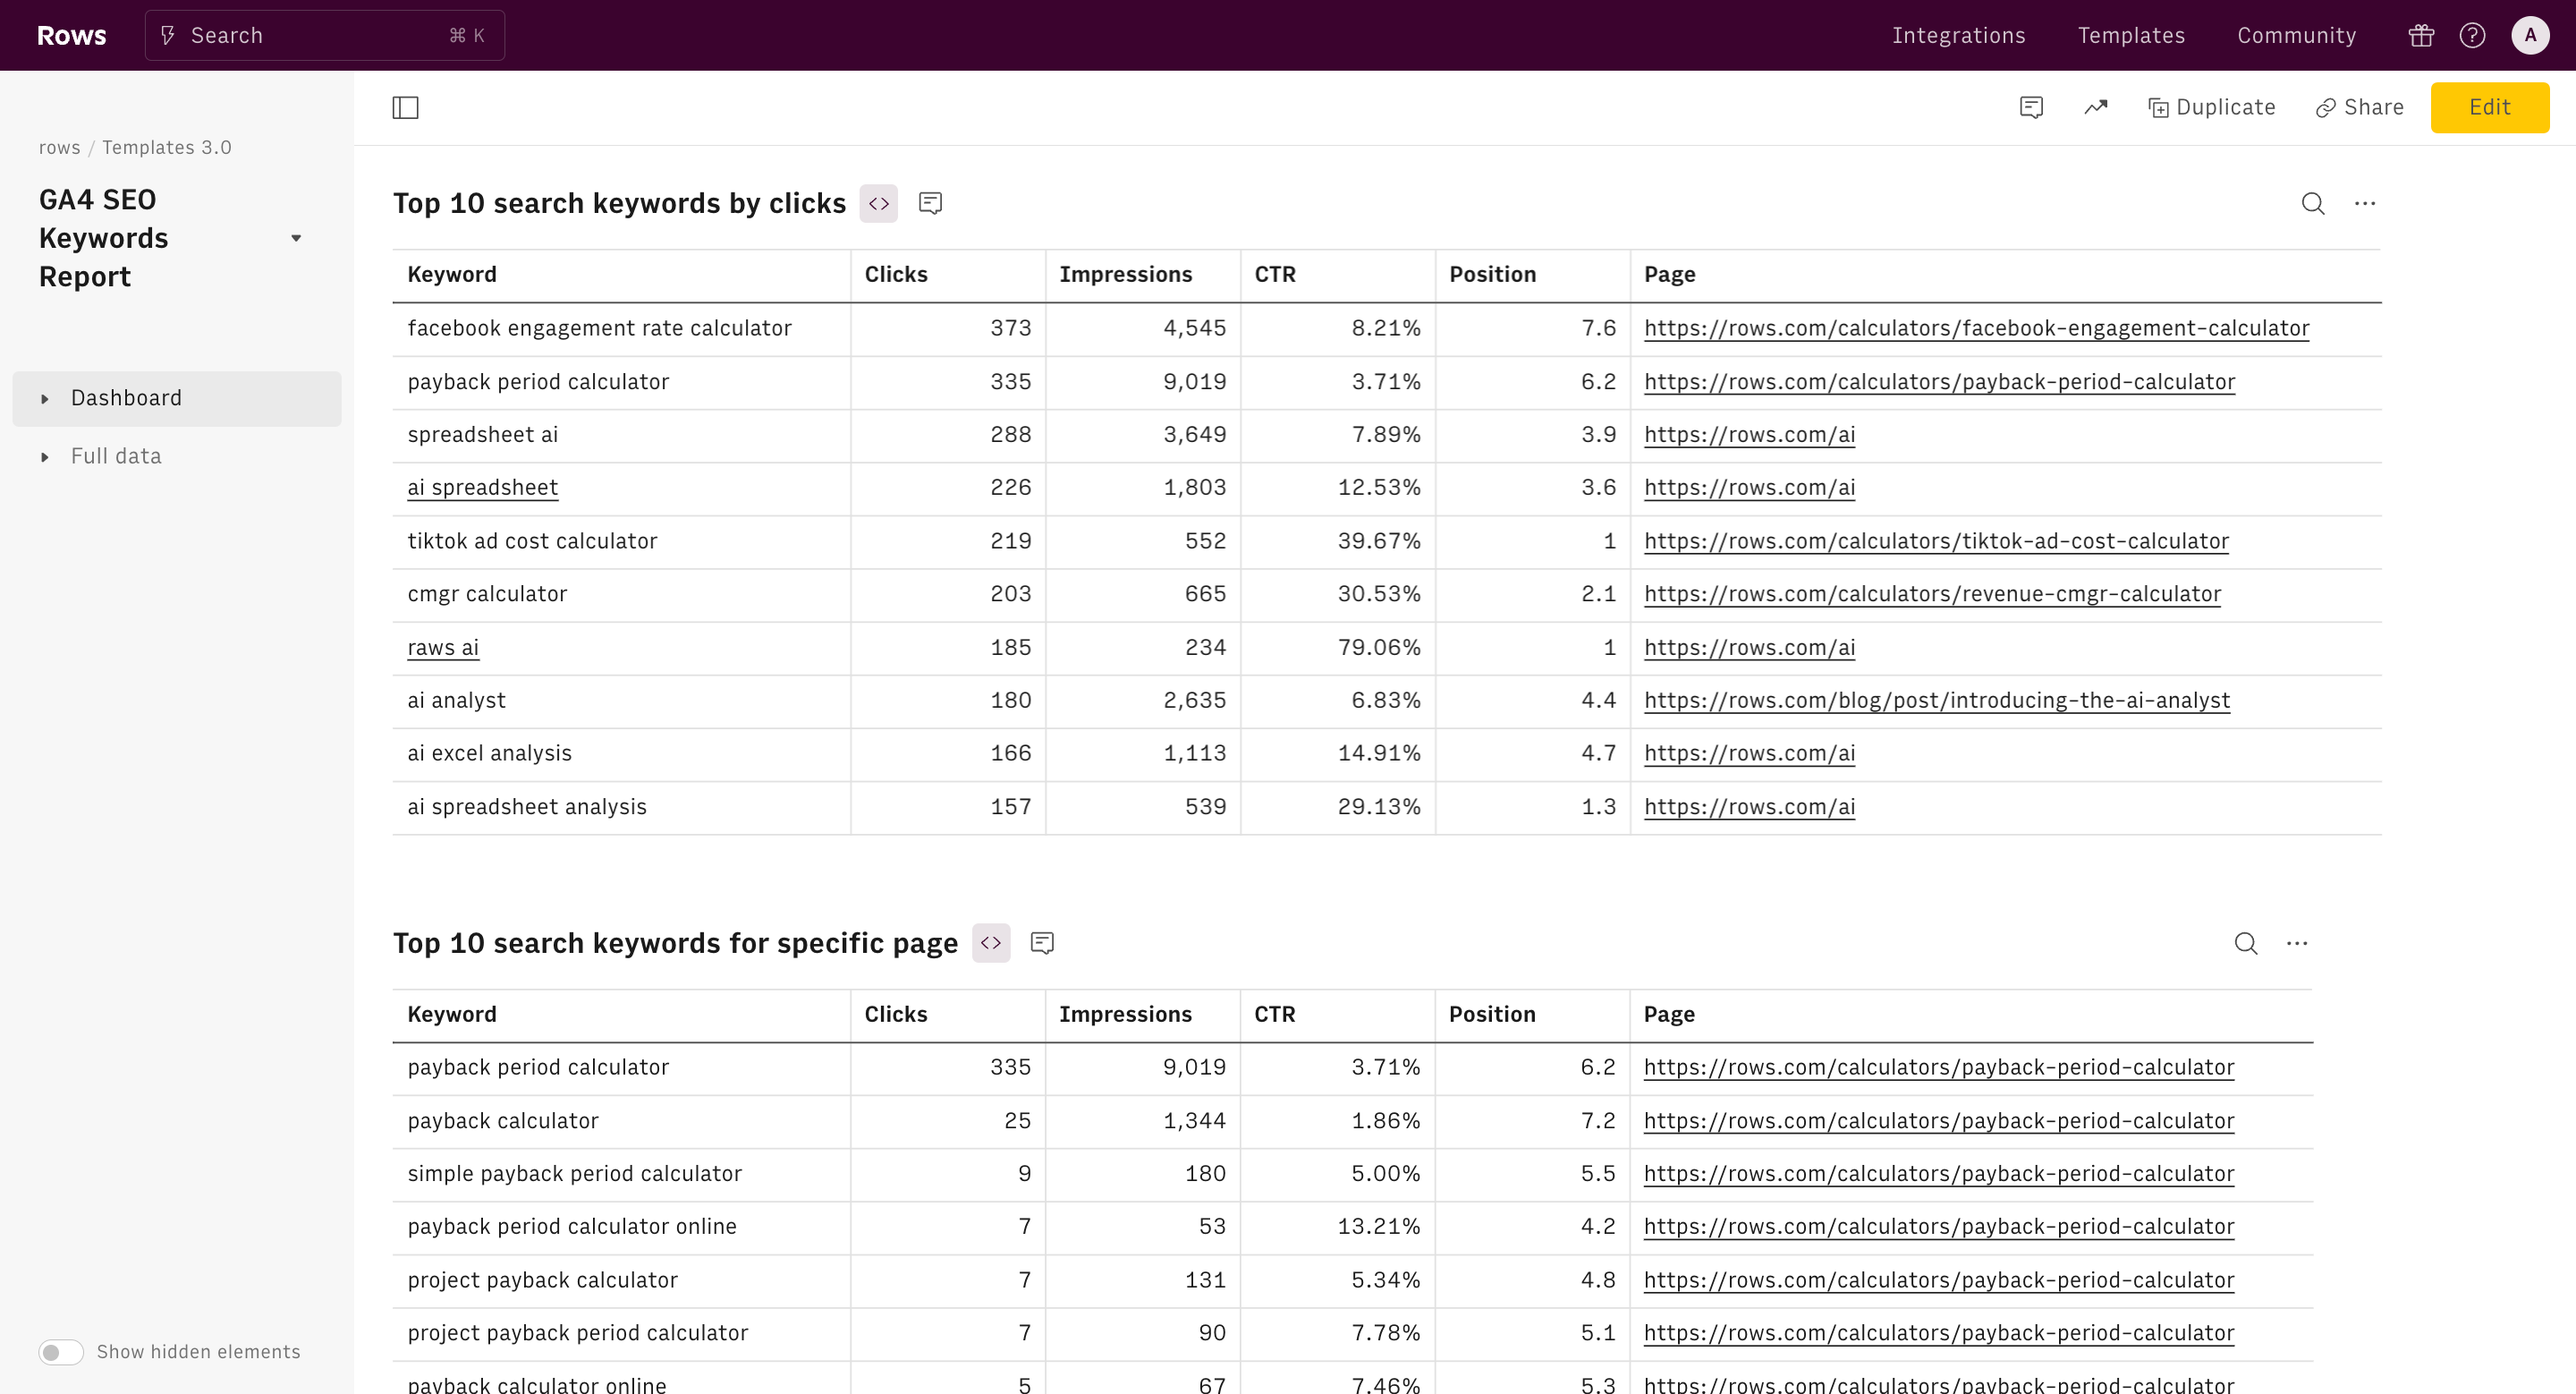
The Keyword Clustering Tool helps you group and categorize keywords based on common themes or patterns, making it easier to track and optimize your SEO performance on different topics. By clustering keywords, you can understand how your content is targeting and matching your visitor search intent and uncover gaps and new content opportunities to improve your website’s visibility on Google SERP.
This tool is ideal for marketers, content creators, and SEO experts who want to better evaluate the effectiveness of their content marketing efforts.
Why using our Keyword Grouping Tool
Our keyword grouping tool is based on a spreadsheet and designed to offer the flexibility and ease of use typical of a spreadsheet editor. Its top features include:
- Easy to customize: Easily customizable, our tool is built into a spreadsheet format, offering the freedom to adjust it to your specific needs without the limitations of rigid software.
- Live Data from Google Search Console: Connect your Google Search Console account to automatically import live keyword data, allowing for accurate and up-to-date insights.
- Simple Grouping Mechanism: Define up to four keyword groups based on specific criteria like “contains” a particular word or phrase, giving you a tailored clustering experience.
- Efficient Data Filtering: Quickly sort and filter keywords to identify patterns, trends, and opportunities in your SEO strategy.
How to Set Up the Template
Step 1: use the template
On this page, click on the "Use Template" button and save the template in one of your folders.
Step 2: Connect Google Search Console

Follow the instructions to connect your Google Search Console accounts. The template integrates directly with GSC, allowing you to import live data from your account automatically.
Step 3: Setup

Pick a date range that aligns with your SEO goals, and define four groups of keywords. The criterion for clustering is based on whether the keyword "contains" a specific word or phrase of your choice.
What Are the Key Insights You Should Be Looking at With Our Keyword Clustering Tool?
Our keyword clustering tool helps you uncover essential insights to guide your SEO strategy, including:
- Search Intent Patterns: Understand the different intents behind the search queries and group keywords accordingly to create more targeted content.
- Content Gaps: Identify keywords that aren’t performing as well as expected or reveal content opportunities where you can create new assets.
- Trend Analysis: Track shifts in keyword popularity over time and adjust your strategy to align with current search behaviors.
- Competitive Edge: By analyzing keyword clusters, you can refine your content to stay ahead of competitors and improve rankings across key terms.
With our keyword clustering tool, you'll gain clarity, control, and insights into how your keywords perform, empowering you to make more informed decisions about your SEO strategy.
Practical Use Case: E-commerce Product Page Optimization
Imagine you're an SEO specialist working for an online electronics store. You've noticed that the product pages for smartphones aren't performing as well as expected in search results. Here's how you might use a keyword clustering tool to optimize these pages:
Data Collection: Export all keywords related to smartphones from your Google Search Console, including their search volume, click-through rates, and current rankings.
Clustering Setup: In the keyword clustering tool, set up four groups:
- Group 1: Contains "iPhone"
- Group 2: Contains "Samsung Galaxy"
- Group 3: Contains "review" or "vs"
- Group 4: Contains "price" or "deal"
Analysis: After running the clustering tool, you discover:
- The "iPhone" cluster shows high search volume but low click-through rates.
- The "Samsung Galaxy" cluster has lower volume but higher engagement.
- The "review/vs" cluster reveals many long-tail keywords you weren't targeting.
- The "price/deal" cluster shows high commercial intent but poor rankings.
Insights and Action Plan:
- For iPhones: Create more compelling meta descriptions to improve click-through rates.
- For Samsung: Expand content to capture more search volume while maintaining high engagement.
- For reviews: Develop comparison pages and in-depth reviews to target long-tail keywords.
- For pricing: Optimize product pages with clear pricing information and create dedicated deal pages.
By using the keyword clustering tool in this way, you've transformed raw keyword data into actionable insights, allowing you to make targeted improvements to your product pages and overall content strategy.
How to Integrate Keyword Clustering into Your Content Strategy
Incorporating a keyword clustering tool into your content strategy can revolutionize your approach to SEO and content creation. Here's how to leverage its insights effectively:
Topic Identification: Use clusters to identify broader topics and subtopics within your niche. This can help you create a more structured content calendar and ensure comprehensive coverage of your industry.
Content Gaps Analysis: Identify clusters where you have little or no content. These represent opportunities to expand your website's topical authority and attract new audience segments.
Content Optimization: For existing content, use keyword clusters to enhance on-page SEO. Incorporate related keywords from the same cluster to improve the depth and relevance of your content.
Pillar Content Planning: Identify large, diverse clusters that can form the basis of pillar pages. Use smaller, related clusters to plan supporting content that links back to these pillar pages.
User Intent Mapping: Analyze the types of keywords in each cluster to understand user intent. Use this insight to tailor your content format and style accordingly (e.g., informational blog posts vs. product comparisons).
Content Performance Tracking: Monitor how content performs for different keyword clusters over time. Use this data to refine your content strategy and focus on high-performing topics.
By integrating keyword clustering into your content strategy, you create a data-driven approach that aligns closely with user needs and search behavior, ultimately leading to more effective and impactful content marketing efforts.
How it works


How it works
Get started
Click on 'Use template' and start using it right away. No forms, no signup. Your data first.
Connect your Google Search Console account
Once landed on the spreadsheet, follow the instructions to connect the required integration and pick your account.
Customize the template and schedule refresh
Once the integration has been connected, all tables will update automatically with your own data. Click on 'Edit Source' to change the retrieved data and automate the data refresh. You can then insert a chart or a pivot table, add a column or personalize formats, using all the regular functions and shortcuts that make spreadsheets great.
Embed tables and charts
Click on the option menu to embed tables and chart on your Notion, Confluence or any other iframe-ready documents.


Questions and answers
Can I use Rows for free?
More than a Keyword Clustering Tool
Rows is your new AI Data Analyst. It lets you extract from PDFs, import your business data, and analyze it using plain language.
Signup for free

Import your business data
Extract from PDFs and images, import from files, marketing tools, databases, APIs, and other 3rd-party connectors.
Know moreAnalyze it with AI
Ask AI✨ any question about your dataset - from VLOOKUPs to forecasting models - and surface key insights, trends, and patterns.
Know moreCollaborate and Share
Seamlessly collaborate and share stunning reports with dynamic charts, embed options, and easy export features.
Know more