Google Search Console Keyword Research Report
Focus on non-branded keywords that generate traffic to your website in three steps: identify high-value queries to keep in your SEO strategy, find high-potential queries to work on and spot SEO easy wins.
About Google Search Console Keyword Research Report
What is Google Search Console Keyword Research Report Template?
A Google Search Console (GSC) keyword research report template analyzes and categorizes keywords, equipping you with insights on how to optimize your website's visibility and inform your content strategy.
How to use Google Search Console for keyword research?
GSC is a free Google tool for SEO data analysis purposes. It provides you with insights about your website performance on search engines, and monitors your organic traffic.
Keyword research involves looking at what terms and queries people perform on search engines to create relevant content to help them sort their needs out while promoting your products. Google Search Console (GSC) is a popular tool that tracks, maintains, and optimizes your website’s visibility in Google search results.
To effectively use GSC for keyword research, start by navigating to the "Performance" report in your Search Console dashboard.

This report provides a wealth of data on your site's search performance, including queries that triggered your pages to appear in search results. Filter this data to focus on a specific time period, country, or type of search (web, image, video) to refine your analysis.
Additionally, pay close attention to metrics like impressions, clicks, click-through rate (CTR), and average position for each query. Queries with high impressions but low CTR may represent opportunities to optimize your title tags and meta descriptions to improve click-through rates.
With GSC you can learn which pages receive the most impressions and clicks, and which queries drive them. There are different types of queries, namely:
(i) Informational: queries whose intent is to find information about something (e.g. France population)
(ii) Navigational: queries used to find a specific website or page (e.g. Rows templates)
(iii) Commercial: queries used to investigate a product or a brand (e.g. Best spreadsheet tools)
(iv) Transactional: queries whose intent is to act (e.g. signup to Rows).
How to use the GSC keyword research template?
By using this report template, you will identify high-value queries to leverage on in your SEO strategy, find high-potential queries to work on and spot SEO easy wins. Below are a few steps on how to use this template:
Step 1: On this page, click on "Use Template".
Once done, you'll see a pop-up that shows — “Select spreadsheet destination” — click on “Create a spreadsheet.”
Step 2: Connect your Google Search Console account to Rows.
Without connecting your account, you'll be unable to access insights and analytics about your page.

Step 3: Set a date range.
You can observe how your keyword rankings change over time by specifying a date range. This allows you to identify trends, whether your rankings are improving, declining, or remaining stable

Step 4: Enter your brand name to filter out branded keywords.
By filtering out these terms, you can focus on how easily people find your website when searching for solutions you offer, rather than when they're already looking for your brand.
For example, ours is "Rows" and when filling this space in our report template, we might ignore keywords like "rows". This helps us concentrate on how well we rank for searches like "best data aggregation software 2024" or “ai on spreadsheet’ which potential new customers are more likely to use.
Step 5: Enter keywords to follow.
If left blank, the chart will display the trend of all keywords.
Key metrics at a glance in the Google Search Console Keyword Research Report Template
Followed keyword over time This chart is a powerful visualization tool within the GSC keyword research report template.
It's designed to track and display the performance of a specific keyword over time, focusing on two important metrics: clicks and position.
The "Clicks" represented by a small sky blue square on the chart, indicates the number of times users have clicked on your webpage in the search results for the tracked keyword. Fluctuations in the clicks line can reveal changes in user behavior, the effectiveness of your title tags and meta descriptions, or shifts in overall search volume for the keyword.
The "Position" shown by a blue rectangular box, represents your website's average ranking position in the search engine results pages (SERPs) for the given keyword. For instance, a position of 1 would be at the top of the chart, while a position of 100 would be at the bottom. This inverse relationship allows you to easily visualize improvements in ranking as upward movements on the chart.

By displaying both clicks and position on the same graph, the chart enables you to quickly identify correlations between your ranking and the traffic you're receiving. For example, you might notice that as your position improves (moves upward on the chart), your clicks tend to increase as well. Conversely, you might spot instances where your position remains stable, but clicks fluctuate, which could indicate changes in search volume or click-through rate.
Top 10 non-brandes high-value keywords
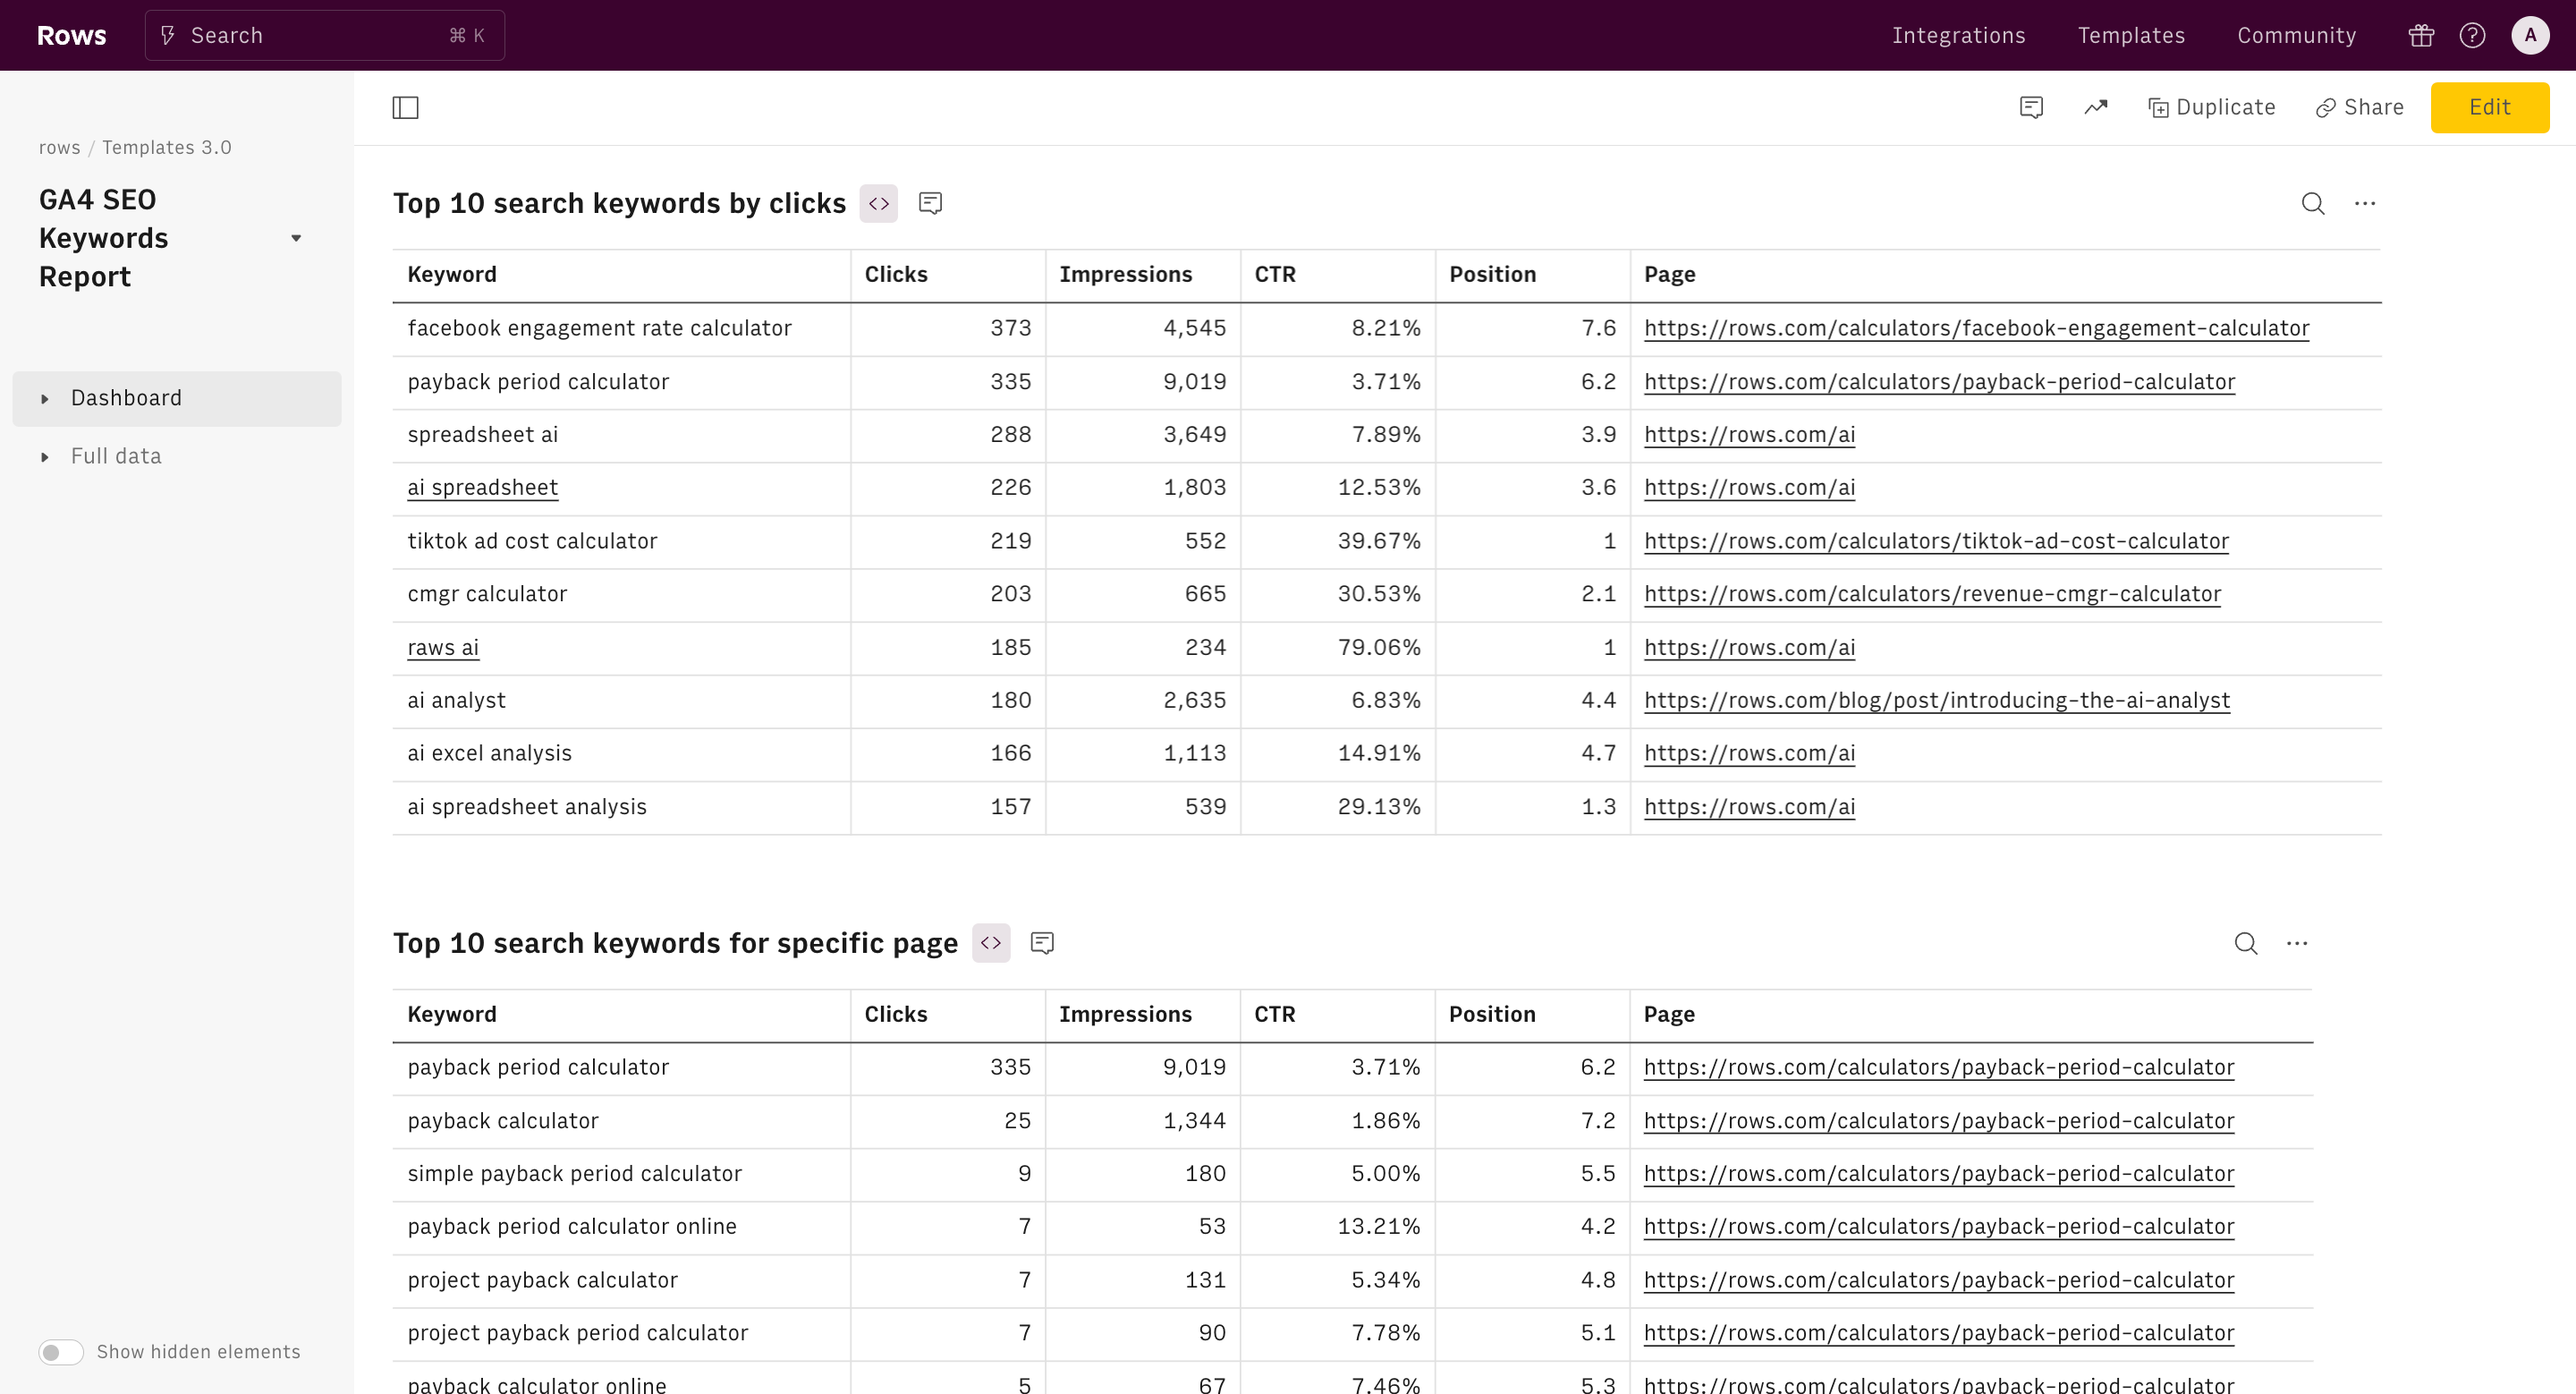
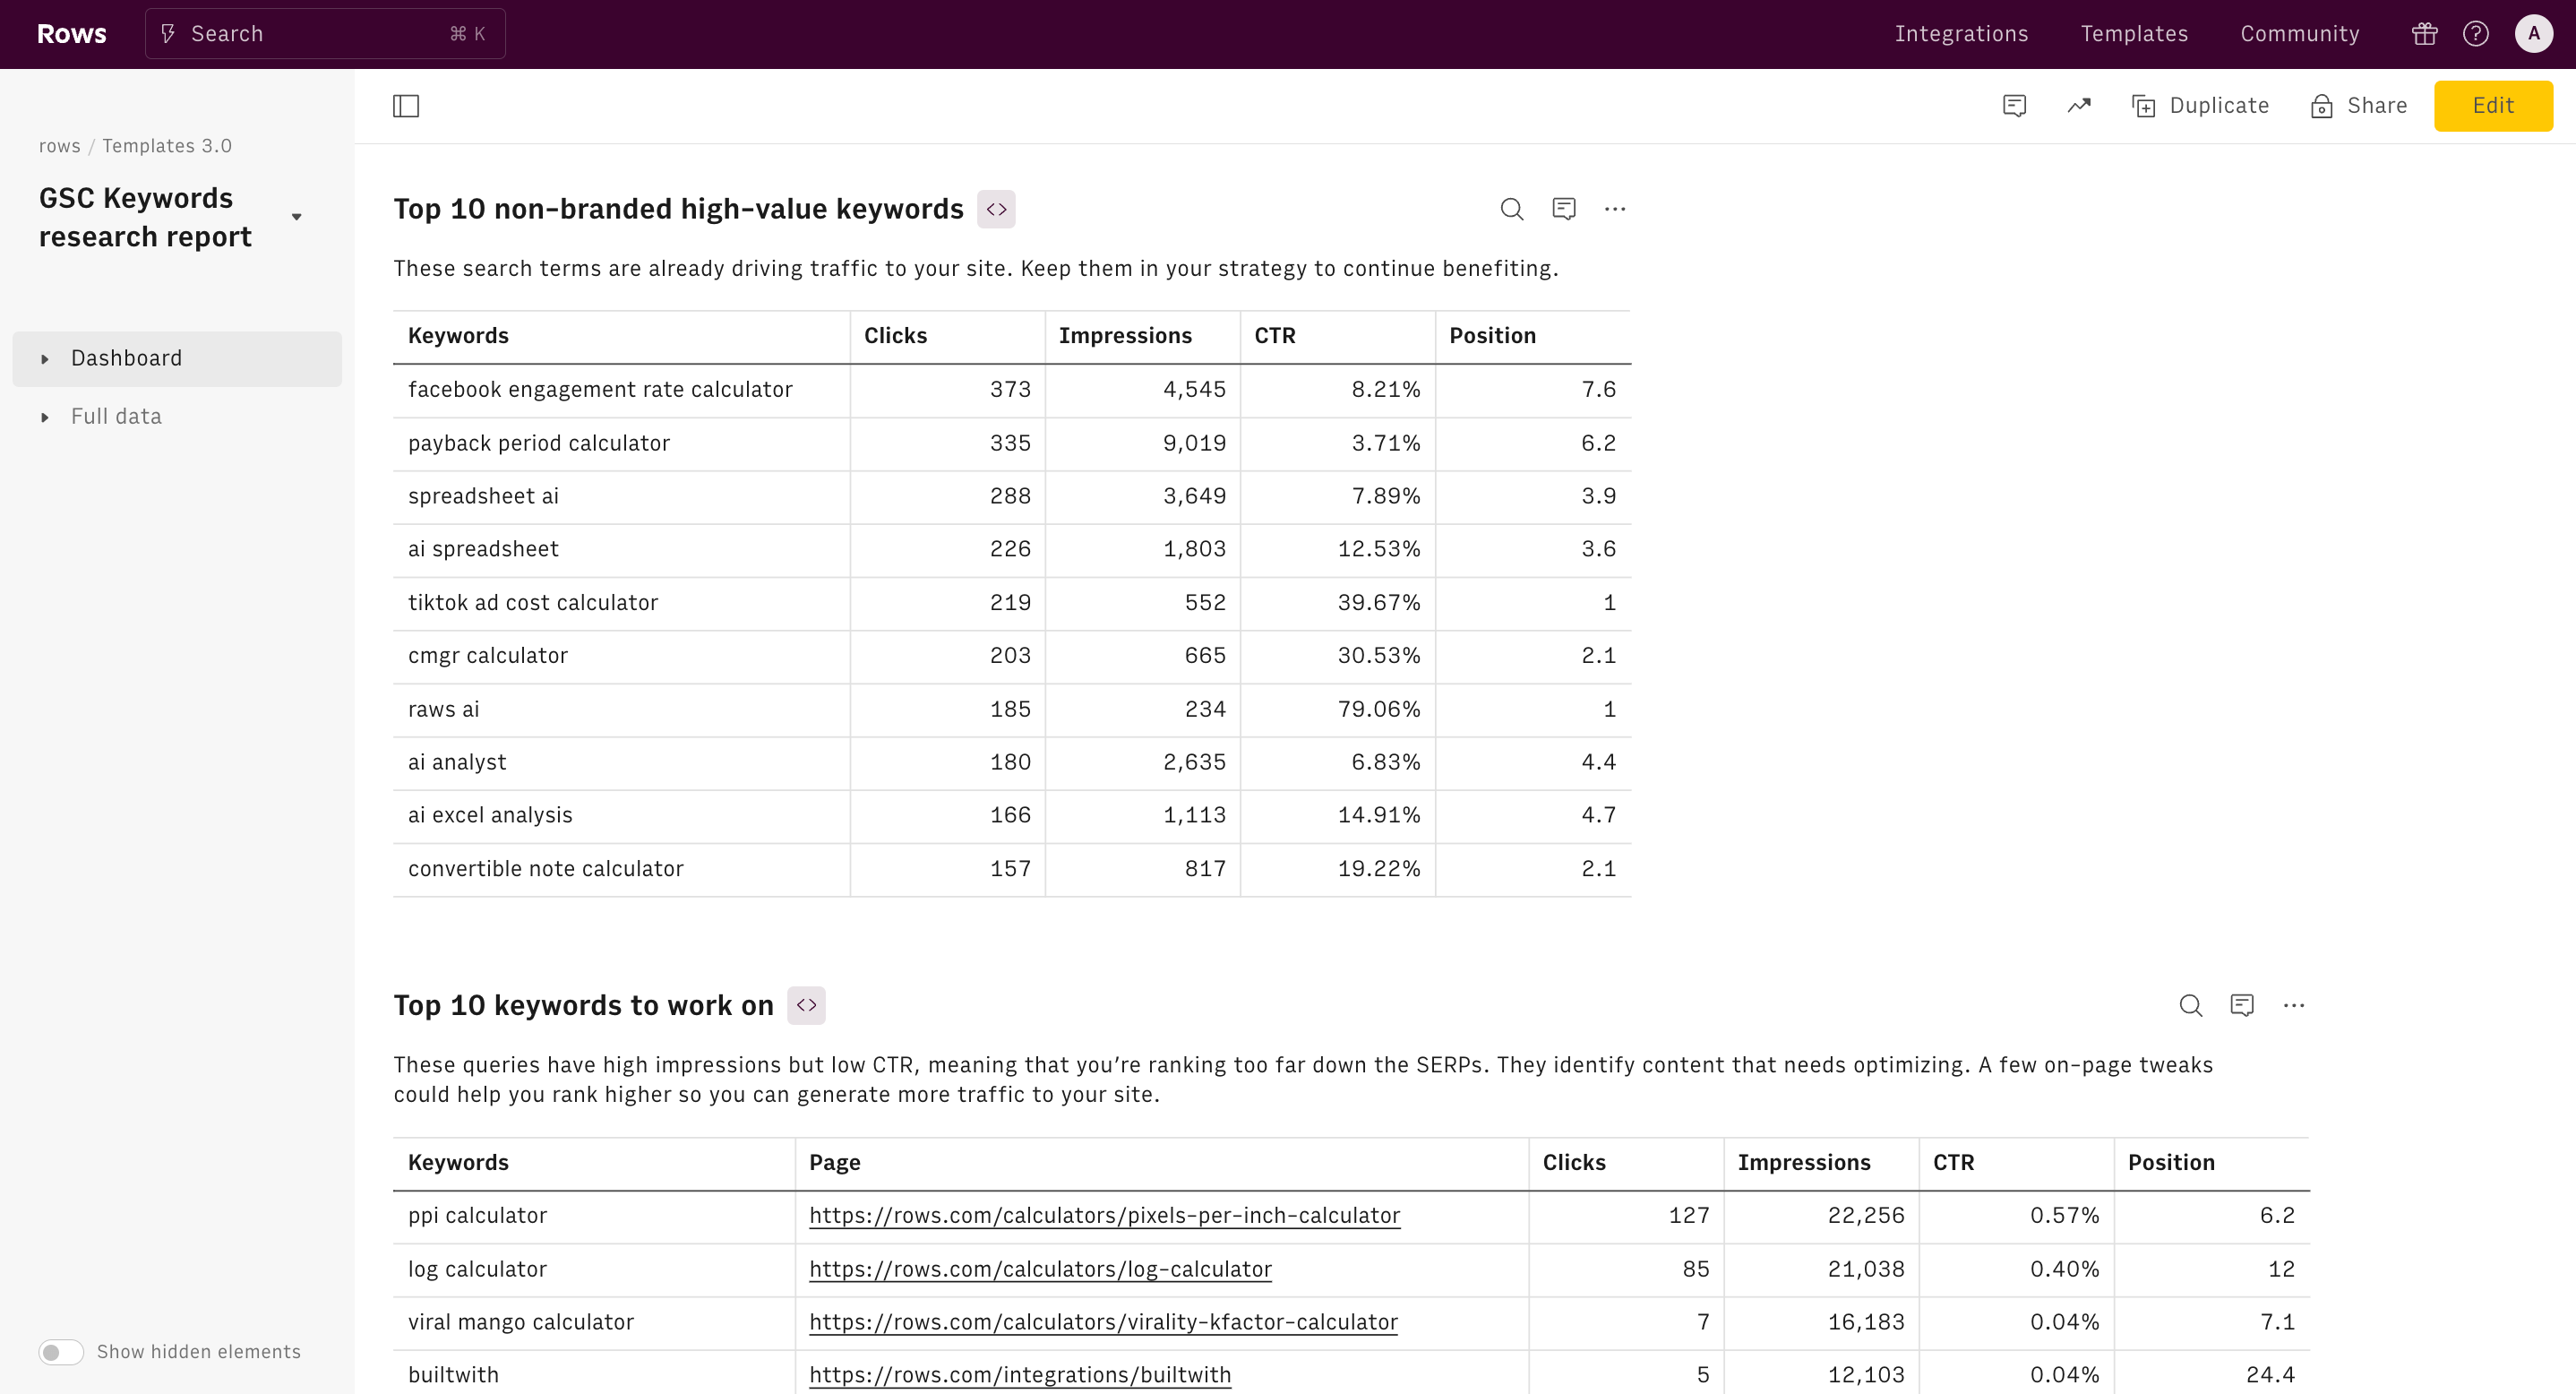
The "Top 10 non-branded high-value keywords" section is a crucial part of this Google Search Console (GSC) keyword research report template. It displays the most important non-branded search terms driving traffic to your site. The table includes key metrics for each keyword: Clicks, Impressions, CTR (Click-Through Rate), Average Position, and the corresponding Page.
This data helps SEO professionals identify which non-branded keywords are performing well and contributing significantly to the site's organic traffic. The note "Keep them in your strategy to continue benefiting" suggests that these keywords are already successful and should remain a focus in ongoing SEO efforts.
Top keywords ranking in position 1-3
This table titled is a crucial part of the Google Search Console (GSC) keyword research report template. It focuses on the keywords that are performing exceptionally well for your website in search engine results pages (SERPs). It lists keywords that rank on average between the 1st and 3rd position in Google search results. These are your top-performing keywords, indicating strong relevance and authority for these search terms.
Top 50 keywords to work on
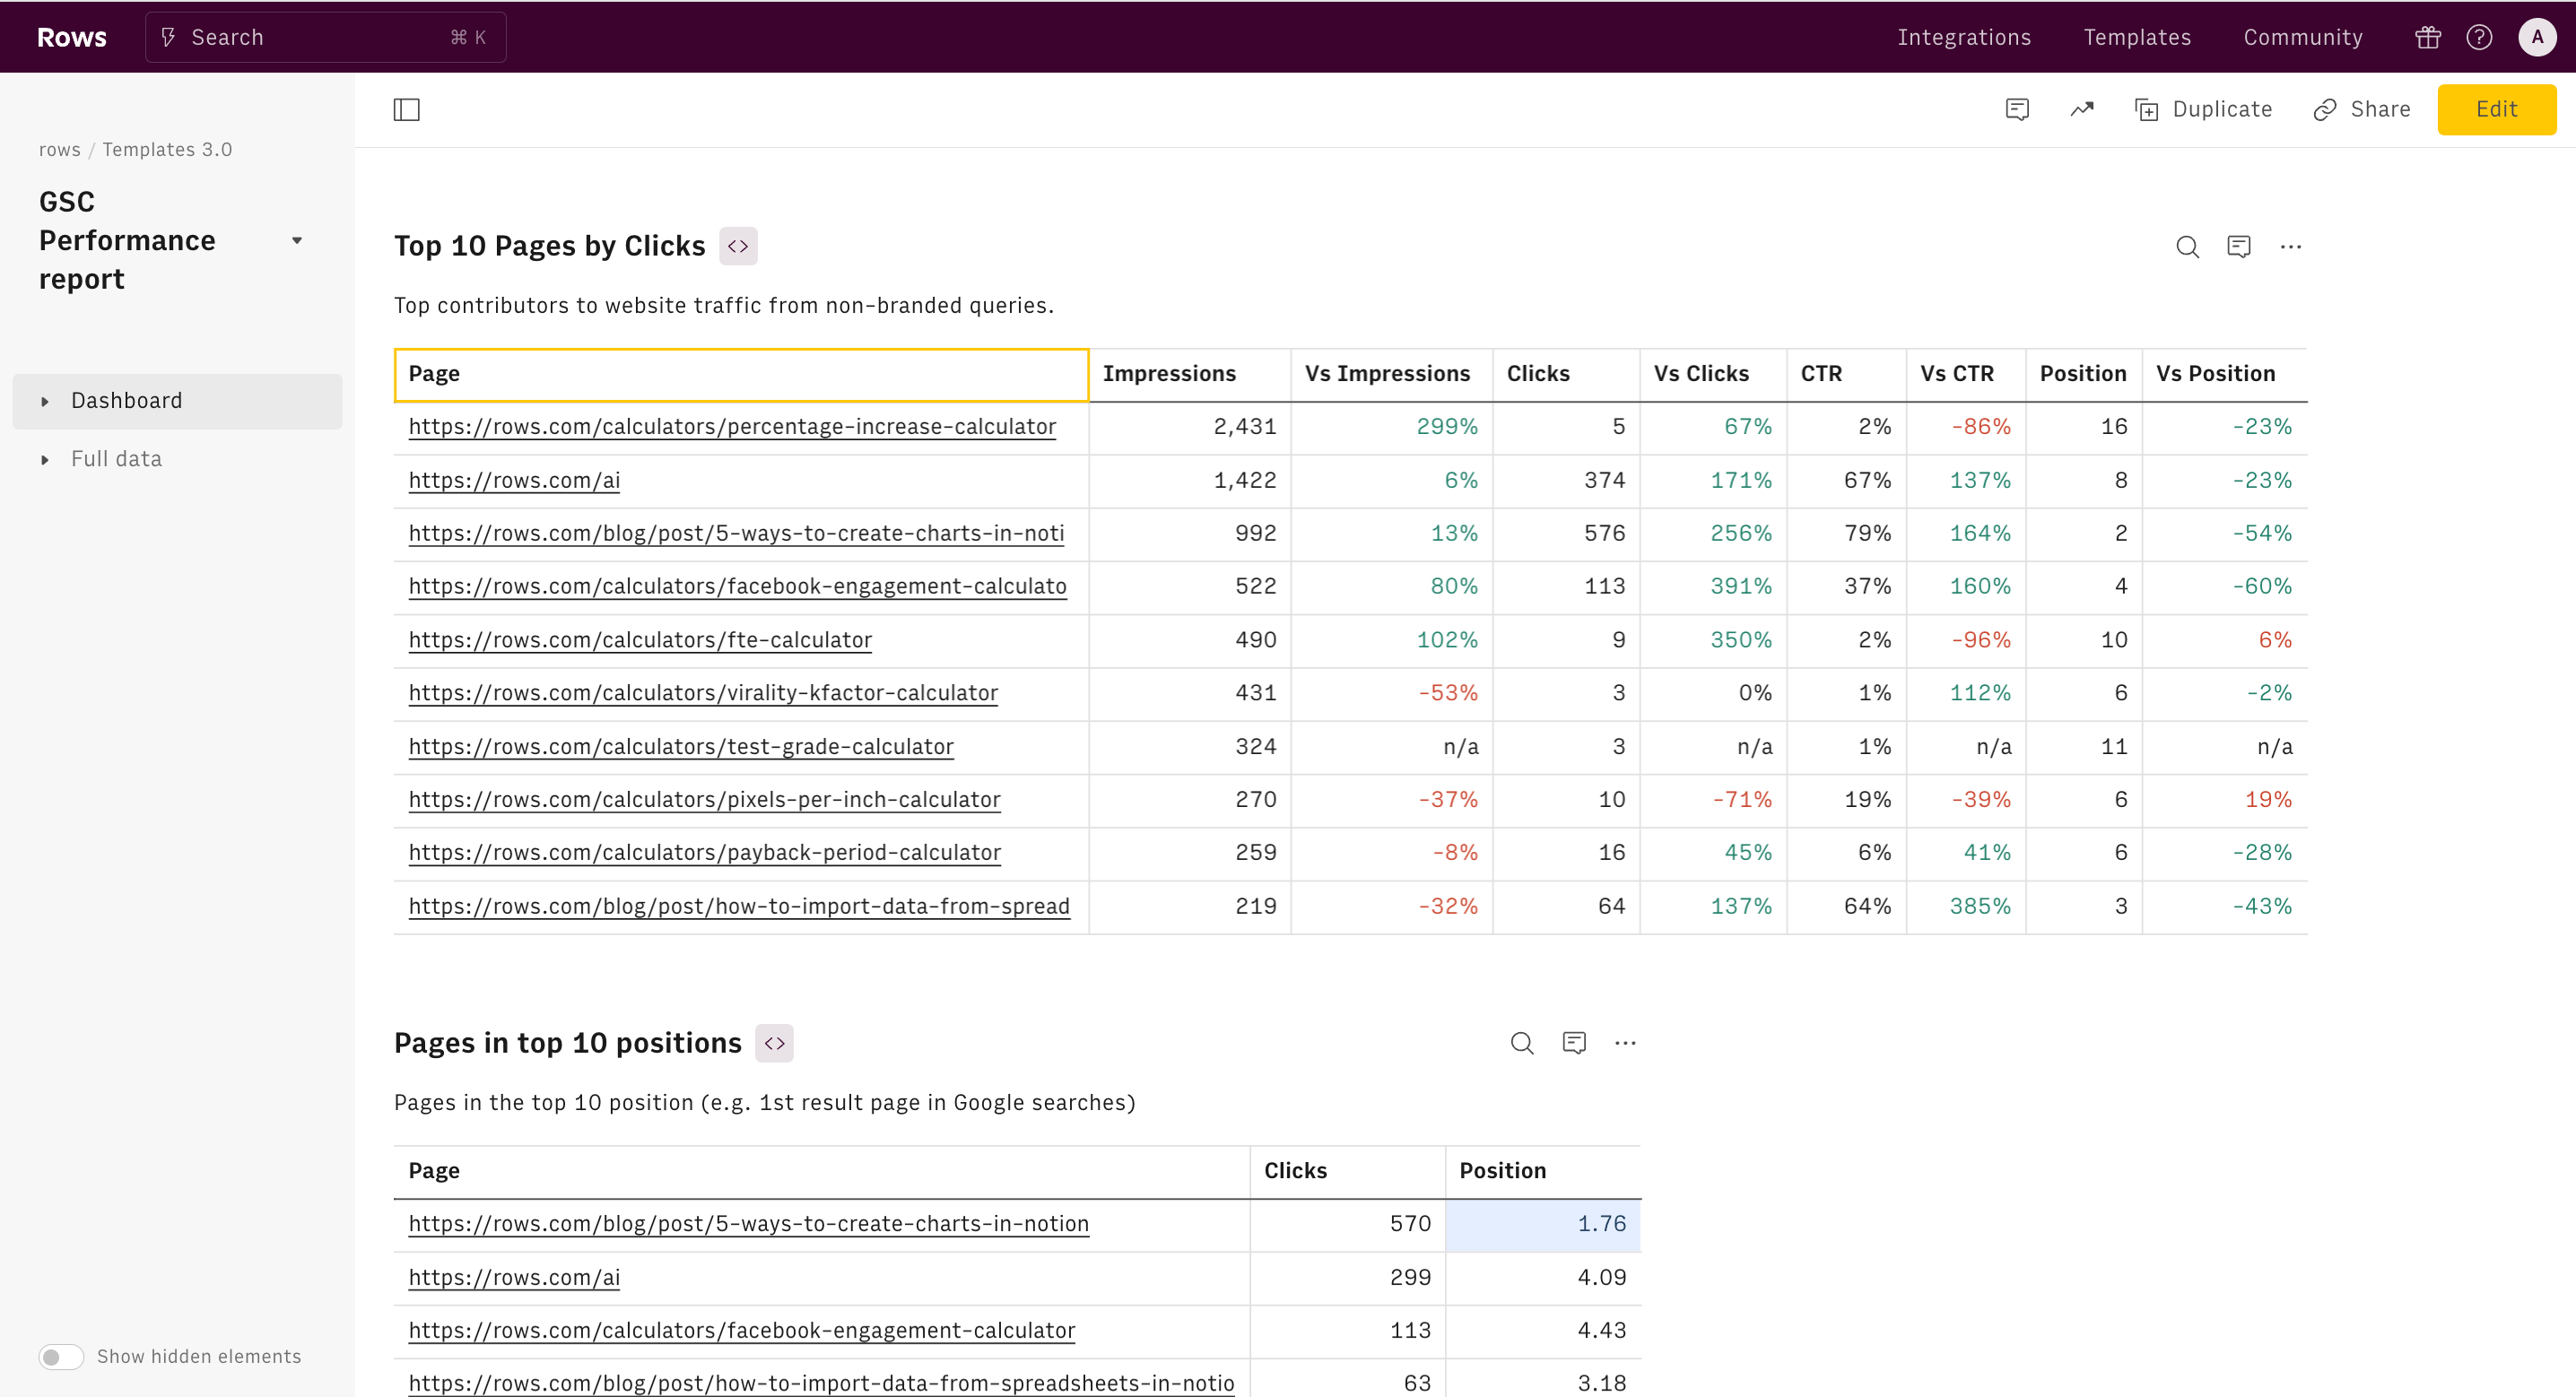
This table identifies keywords with high impressions but low click-through rates (CTR below 1%). These represent opportunities for improvement. The low CTR suggests either poor SERP ranking or misalignment between user intent and your meta title/description. Optimizing these pages could significantly increase traffic by improving rankings or better matching user expectations.
Top keywords ranking in position 4-10
This table shows keywords ranking on the first page of Google SERPs, but not in the top 3 positions. These are prime targets for optimization efforts. They are ranked between 4th and 10th position. While they are on the first page, there's still room for improvement. These keywords represent "low-hanging fruit" for quick SEO wins.
What are the benefits of using the Google Search Console keyword research report template?
1. Comprehensive Keyword Performance Insight
This template provides a holistic view of your keyword performance across various metrics. It allows you to quickly identify top performers, underperforming keywords, and untapped opportunities. With this information at your fingertips, you can make data-driven decisions to optimize your SEO strategy effectively.
2. Easy Identification of High-Impact Opportunities
The template clearly highlights keywords ranking in positions 4-10, which are prime for optimization. By focusing on these "low-hanging fruit" keywords, you can achieve significant traffic gains with minimal effort.
3. Clear Prioritization of Optimization Efforts
With sections like "Top 50 keywords to work on," the template helps you prioritize your SEO tasks. It pinpoints exactly which keywords need attention due to high impressions but low CTR. This clarity allows you to focus your efforts where they'll have the most impact, saving time and resources.
4. Actionable Insights for Content Improvement
The template doesn't just show data; it provides context and suggestions. For instance, it explains why certain keywords might have low CTR and suggests on-page tweaks that could help. This actionable guidance empowers you to make informed improvements to your content and meta information.
5. Tracking of SEO Success and Progress
By regularly using this template, you can track your SEO progress over time. You'll see how your efforts move keywords up the rankings and improve CTR. This ongoing monitoring allows you to demonstrate the value of your SEO work, refine your strategies, and continually improve your organic search performance.
How it works
How it works
Get started
Click on 'Use template' and start using it right away. No forms, no signup. Your data first.
Connect your Google Search Console account
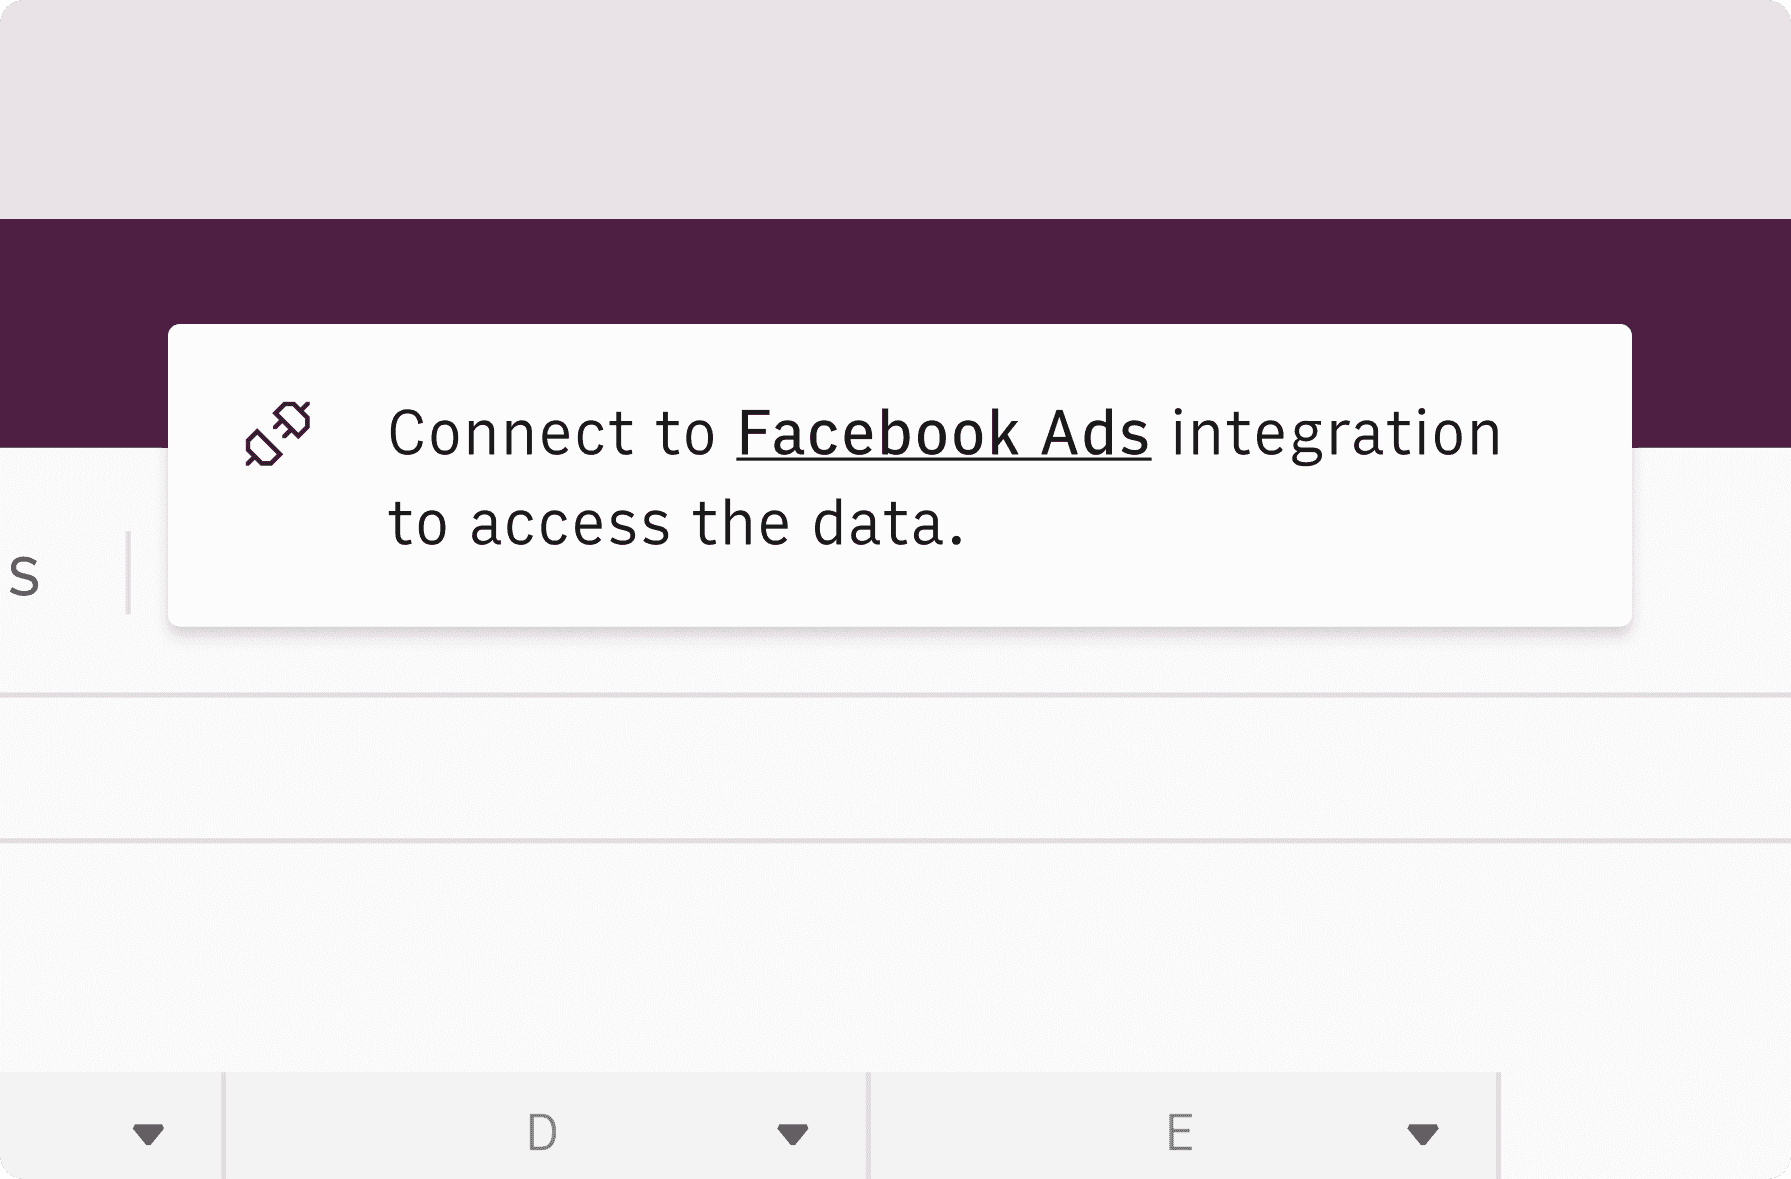
Once landed on the spreadsheet, follow the instructions to connect the integration and pick your account.
Customize the template and schedule refresh
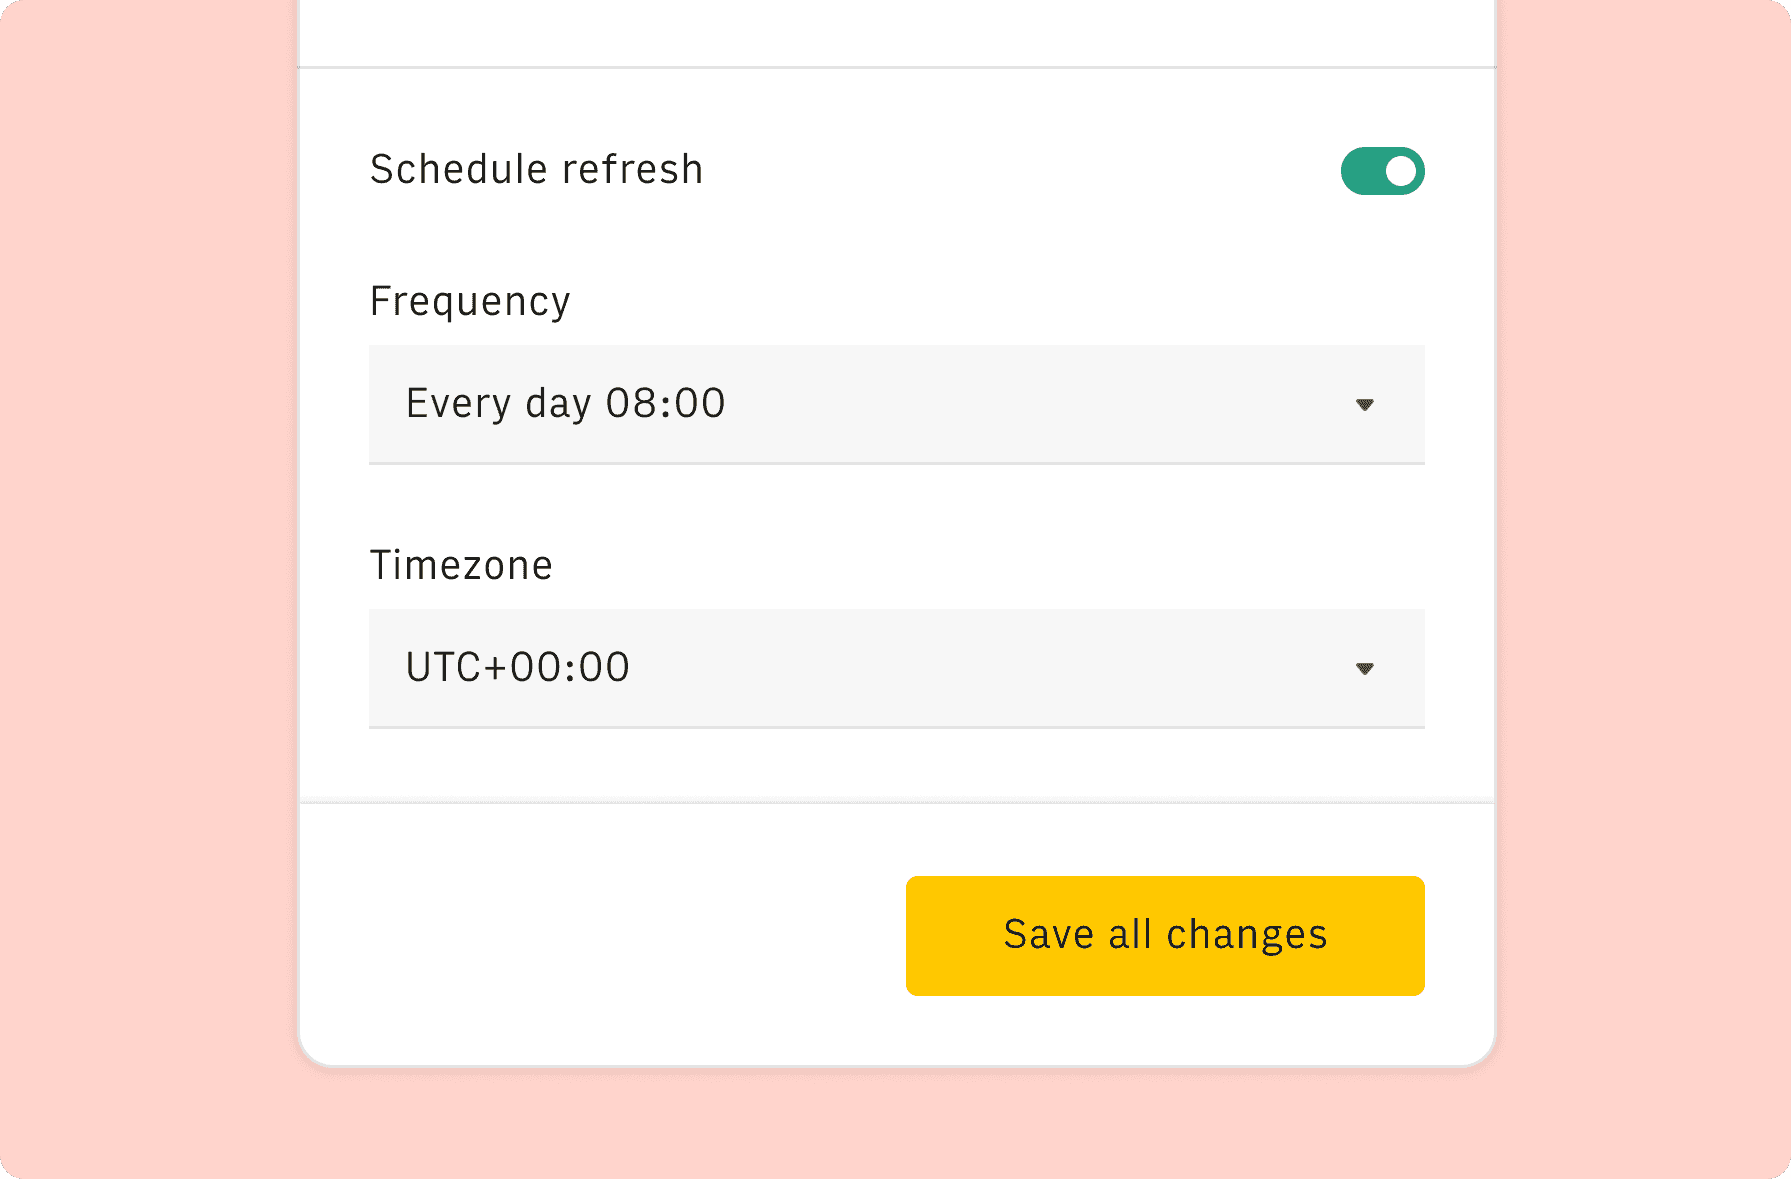
Once the integration has been connected, all tables will update automatically with your own data. Click on 'Edit Source' to change the retrieved data and automate the data refresh. You can then insert a chart or a pivot table, add a column or personalize formats, using all the regular functions and shortcuts that make spreadsheets great.
Embed tables and charts
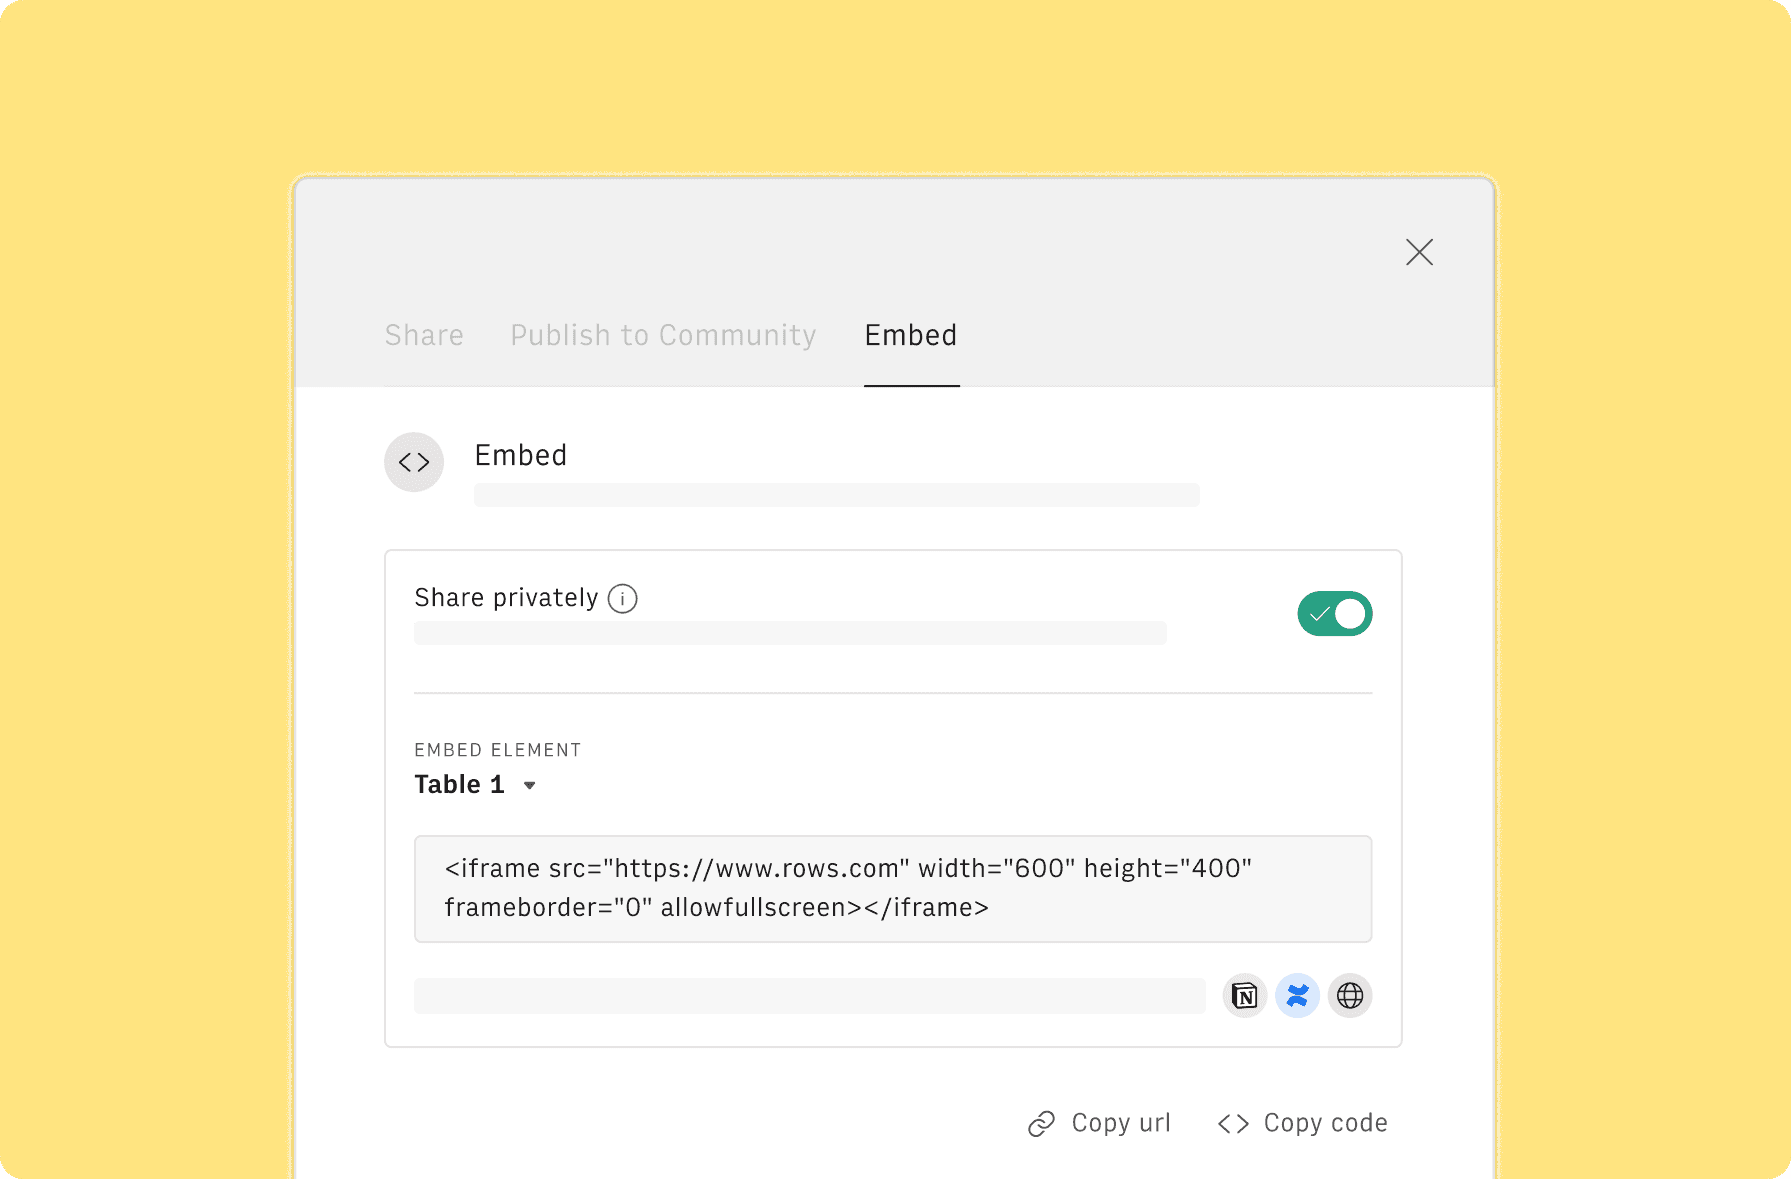
Click on the option menu to embed tables and chart on your Notion, Confluence or any other iframe-ready documents.
Questions and answers
Can I use Rows for free?
More than a Google Search Console Keyword Research Report
Rows is your new AI Data Analyst. It lets you extract from PDFs, import your business data, and analyze it using plain language.
Signup for free
Import your business data
Extract from PDFs and images, import from files, marketing tools, databases, APIs, and other 3rd-party connectors.
Know moreAnalyze it with AI
Ask AI✨ any question about your dataset - from VLOOKUPs to forecasting models - and surface key insights, trends, and patterns.
Know moreCollaborate and Share
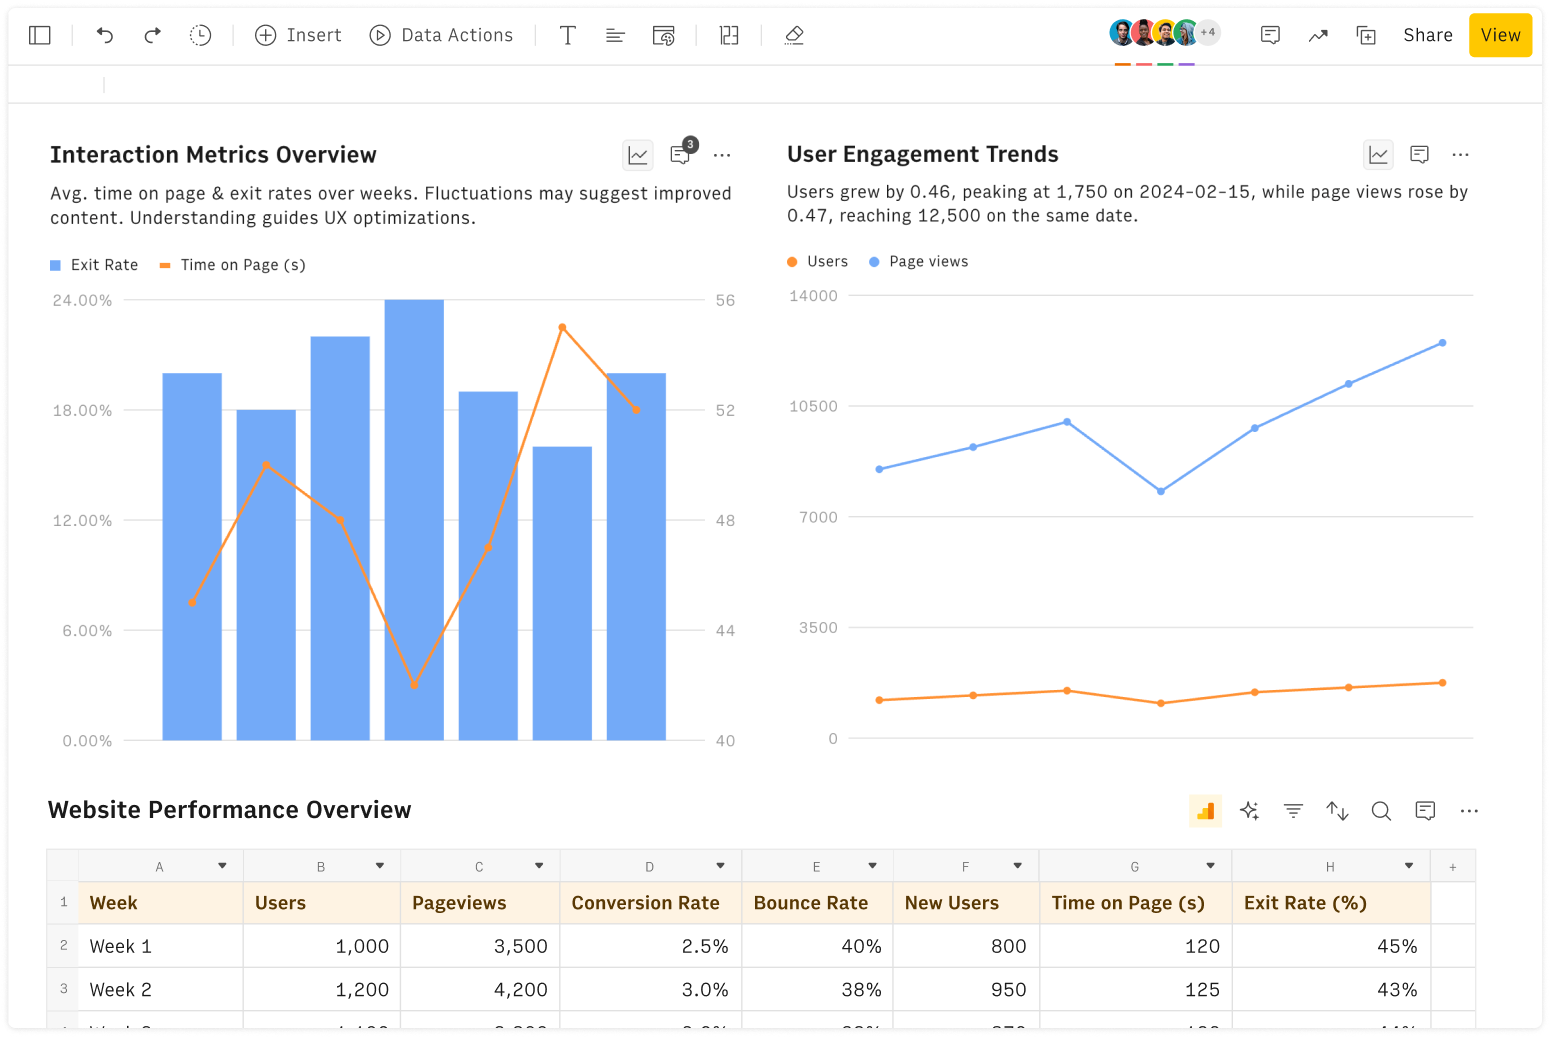
Seamlessly collaborate and share stunning reports with dynamic charts, embed options, and easy export features.
Know more

