Google Ads Report Template
Find your website’s Google Ads and Google Analytics paid search analytics with your total ad spend, average CPC, top ads and search keywords, and a comparison of your average site users versus those that came in from ads.
About Google Ads Report Template
What is Google Ads Report Template and what does it measure?
This Google Ads report template delivers a comprehensive overview of the outcomes of your Google Ads campaigns, providing you both a top-level and detailed focus on your pay-per-click marketing efforts.
Google Ads Report Template breakdown: How can you use this dashboard?
Google Ads data is included in Google Analytics 4. First thing first, link your Google Ads account to Analytics.
Once you link your Google Ads account to Analytics, GA4 will add a new Advertising tab to your account with details about your paid traffic. You’ll also find a breakdown of how people come to your site—directly, through organic search, and through paid search among other channels—in your GA4 Traffic acquisition report. Google Analytics’ Explore dashboards lets you dig deeper into your ad spend, as does your Google Ads account.
But then there's a better option, you could pull everything together into a unique spreadsheet-based dashboard with Rows.
With this template, you’ll get a detailed breakdown of your paid Google Ads campaigns and keywords, the search terms that led visitors to click on your ads, and your total ad spend and average cost per click over the most recent time period you want to check. It’s the quickest way to keep track of everything about your site’s paid search.
Below are some steps to help you get started:
Step 1: On this page, click on "Use Template". Once done, you'll see a pop-up that shows — “Select spreadsheet destination” — click on “Create a spreadsheet.”
Step 2: Connect Google Analytics 4 (GA4)integration to Rows. Without connecting your account, you'll be unable to access insights and analytics about your page

Step 3: Set a date range. You can observe ad campaign performance for a particular period of time by specifying a date range. This allows you to identify trends, whether your rankings are improving, declining, or remaining stable.
Key components the Google Ads Report Template
By using this spreadsheet, you can access the following data points:
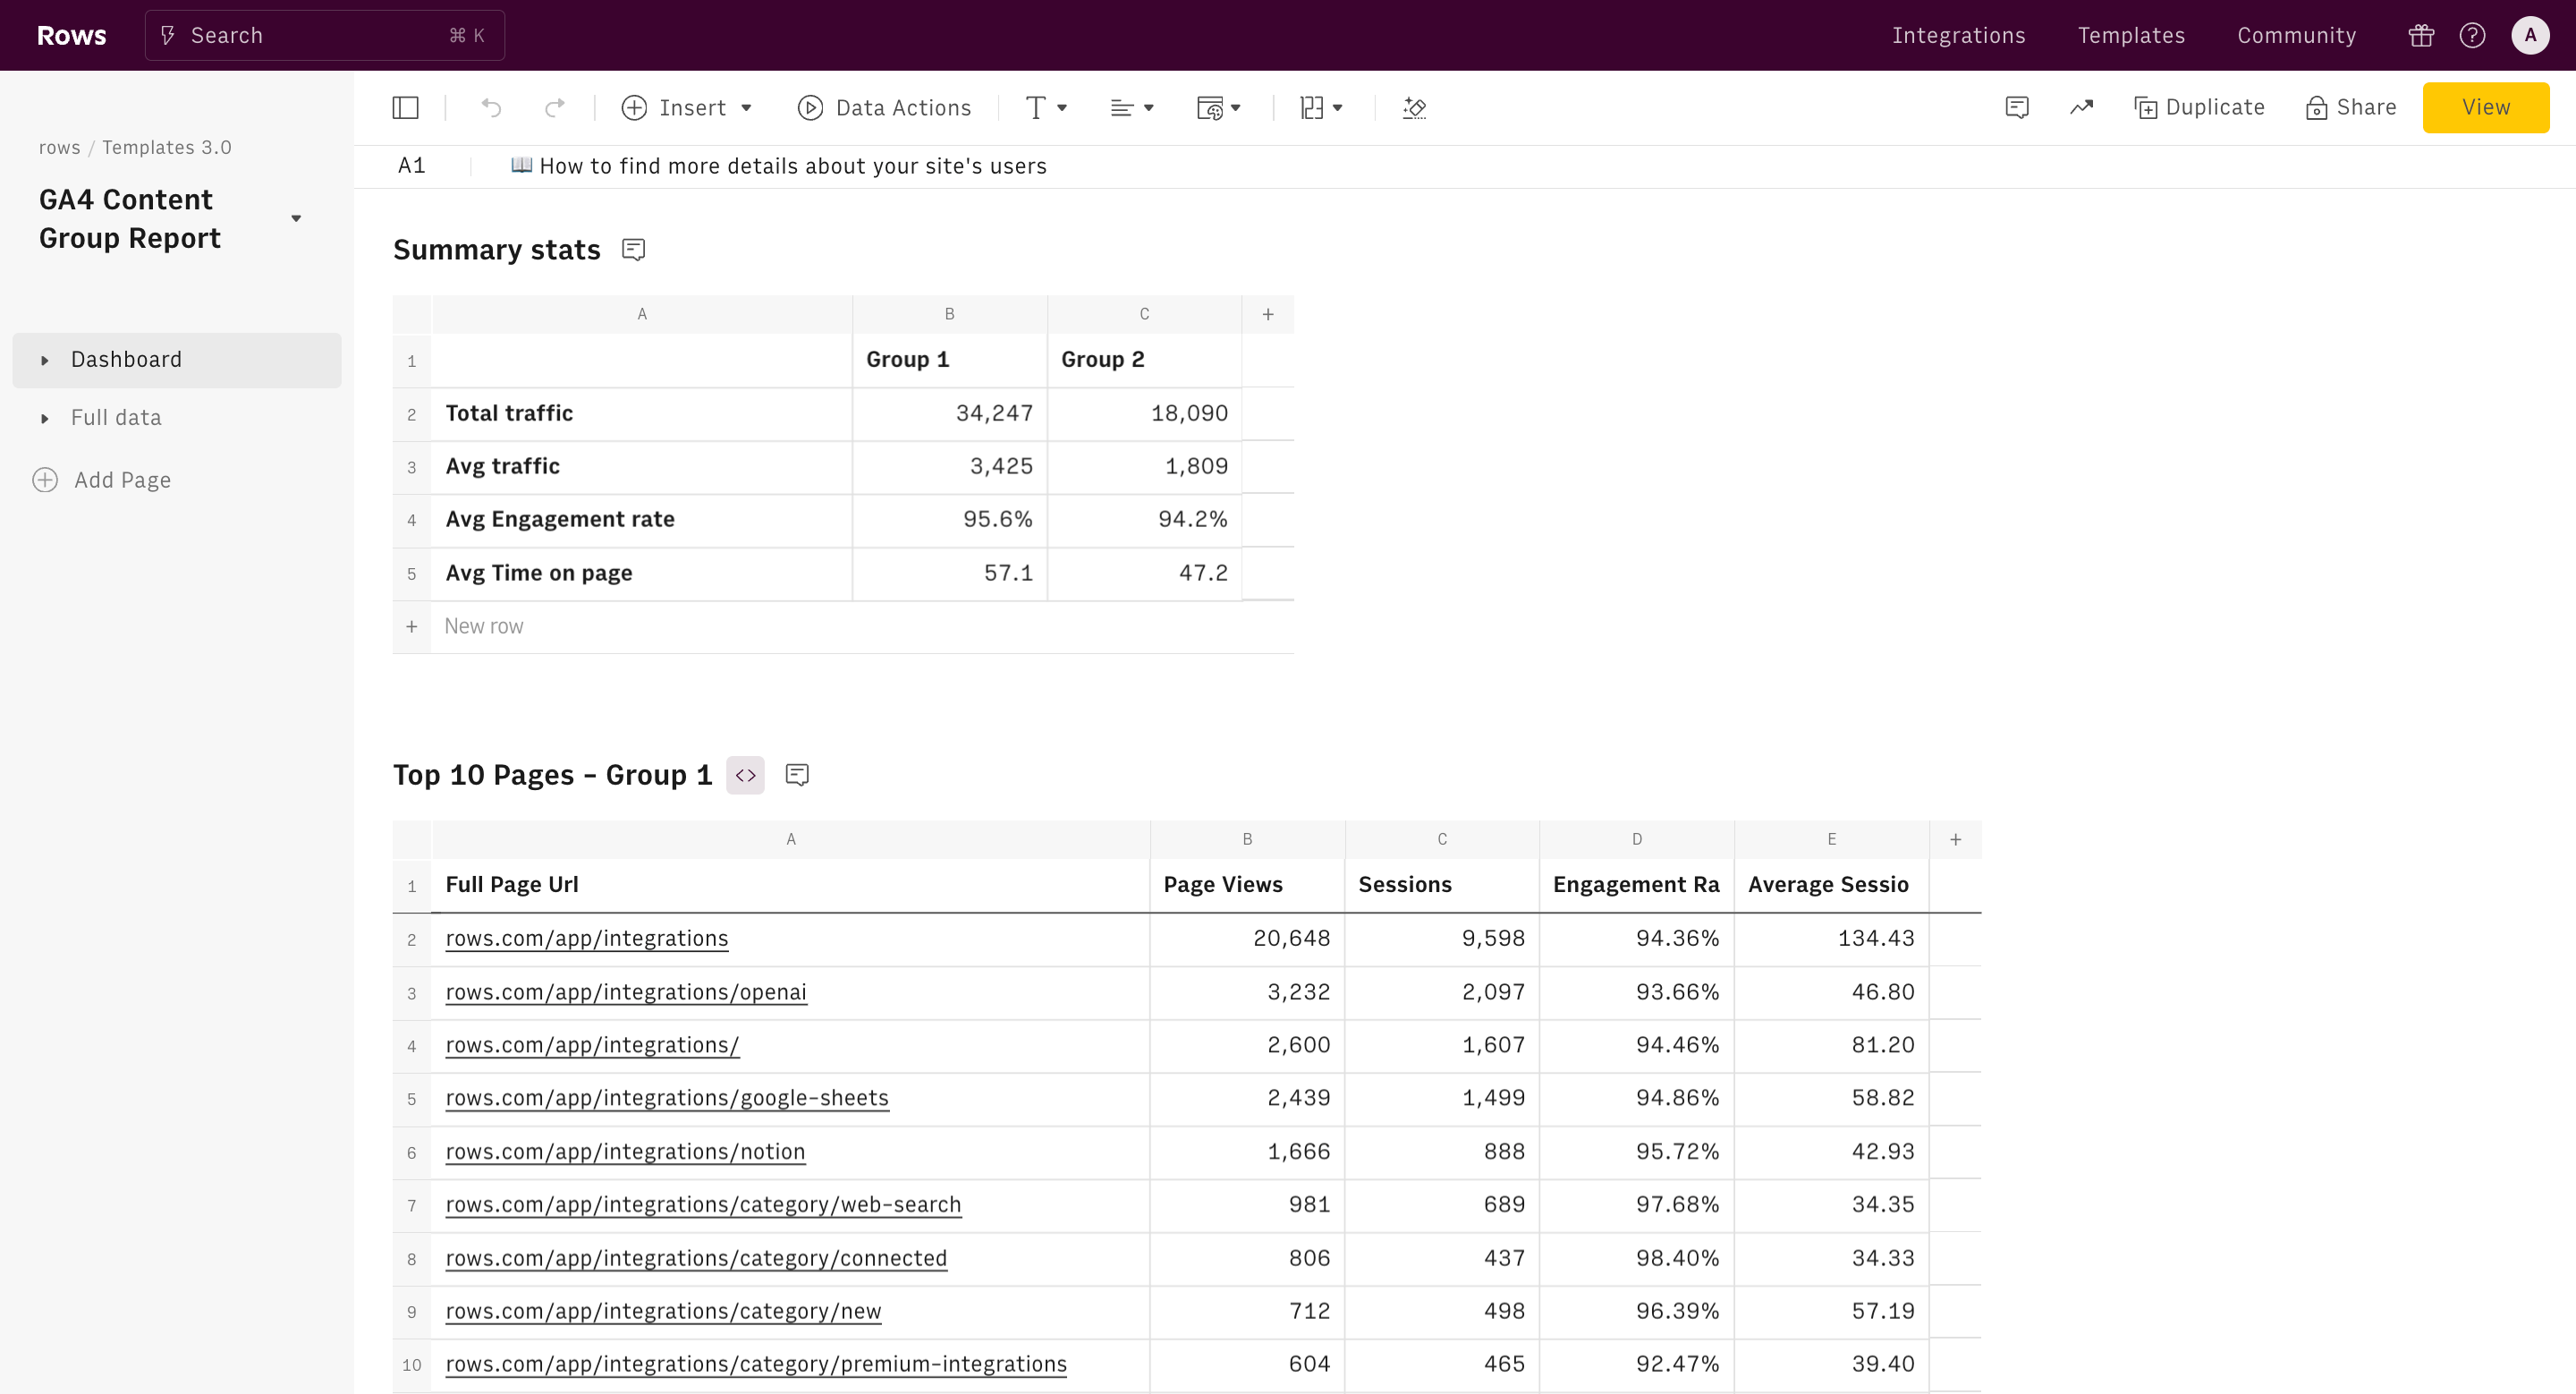
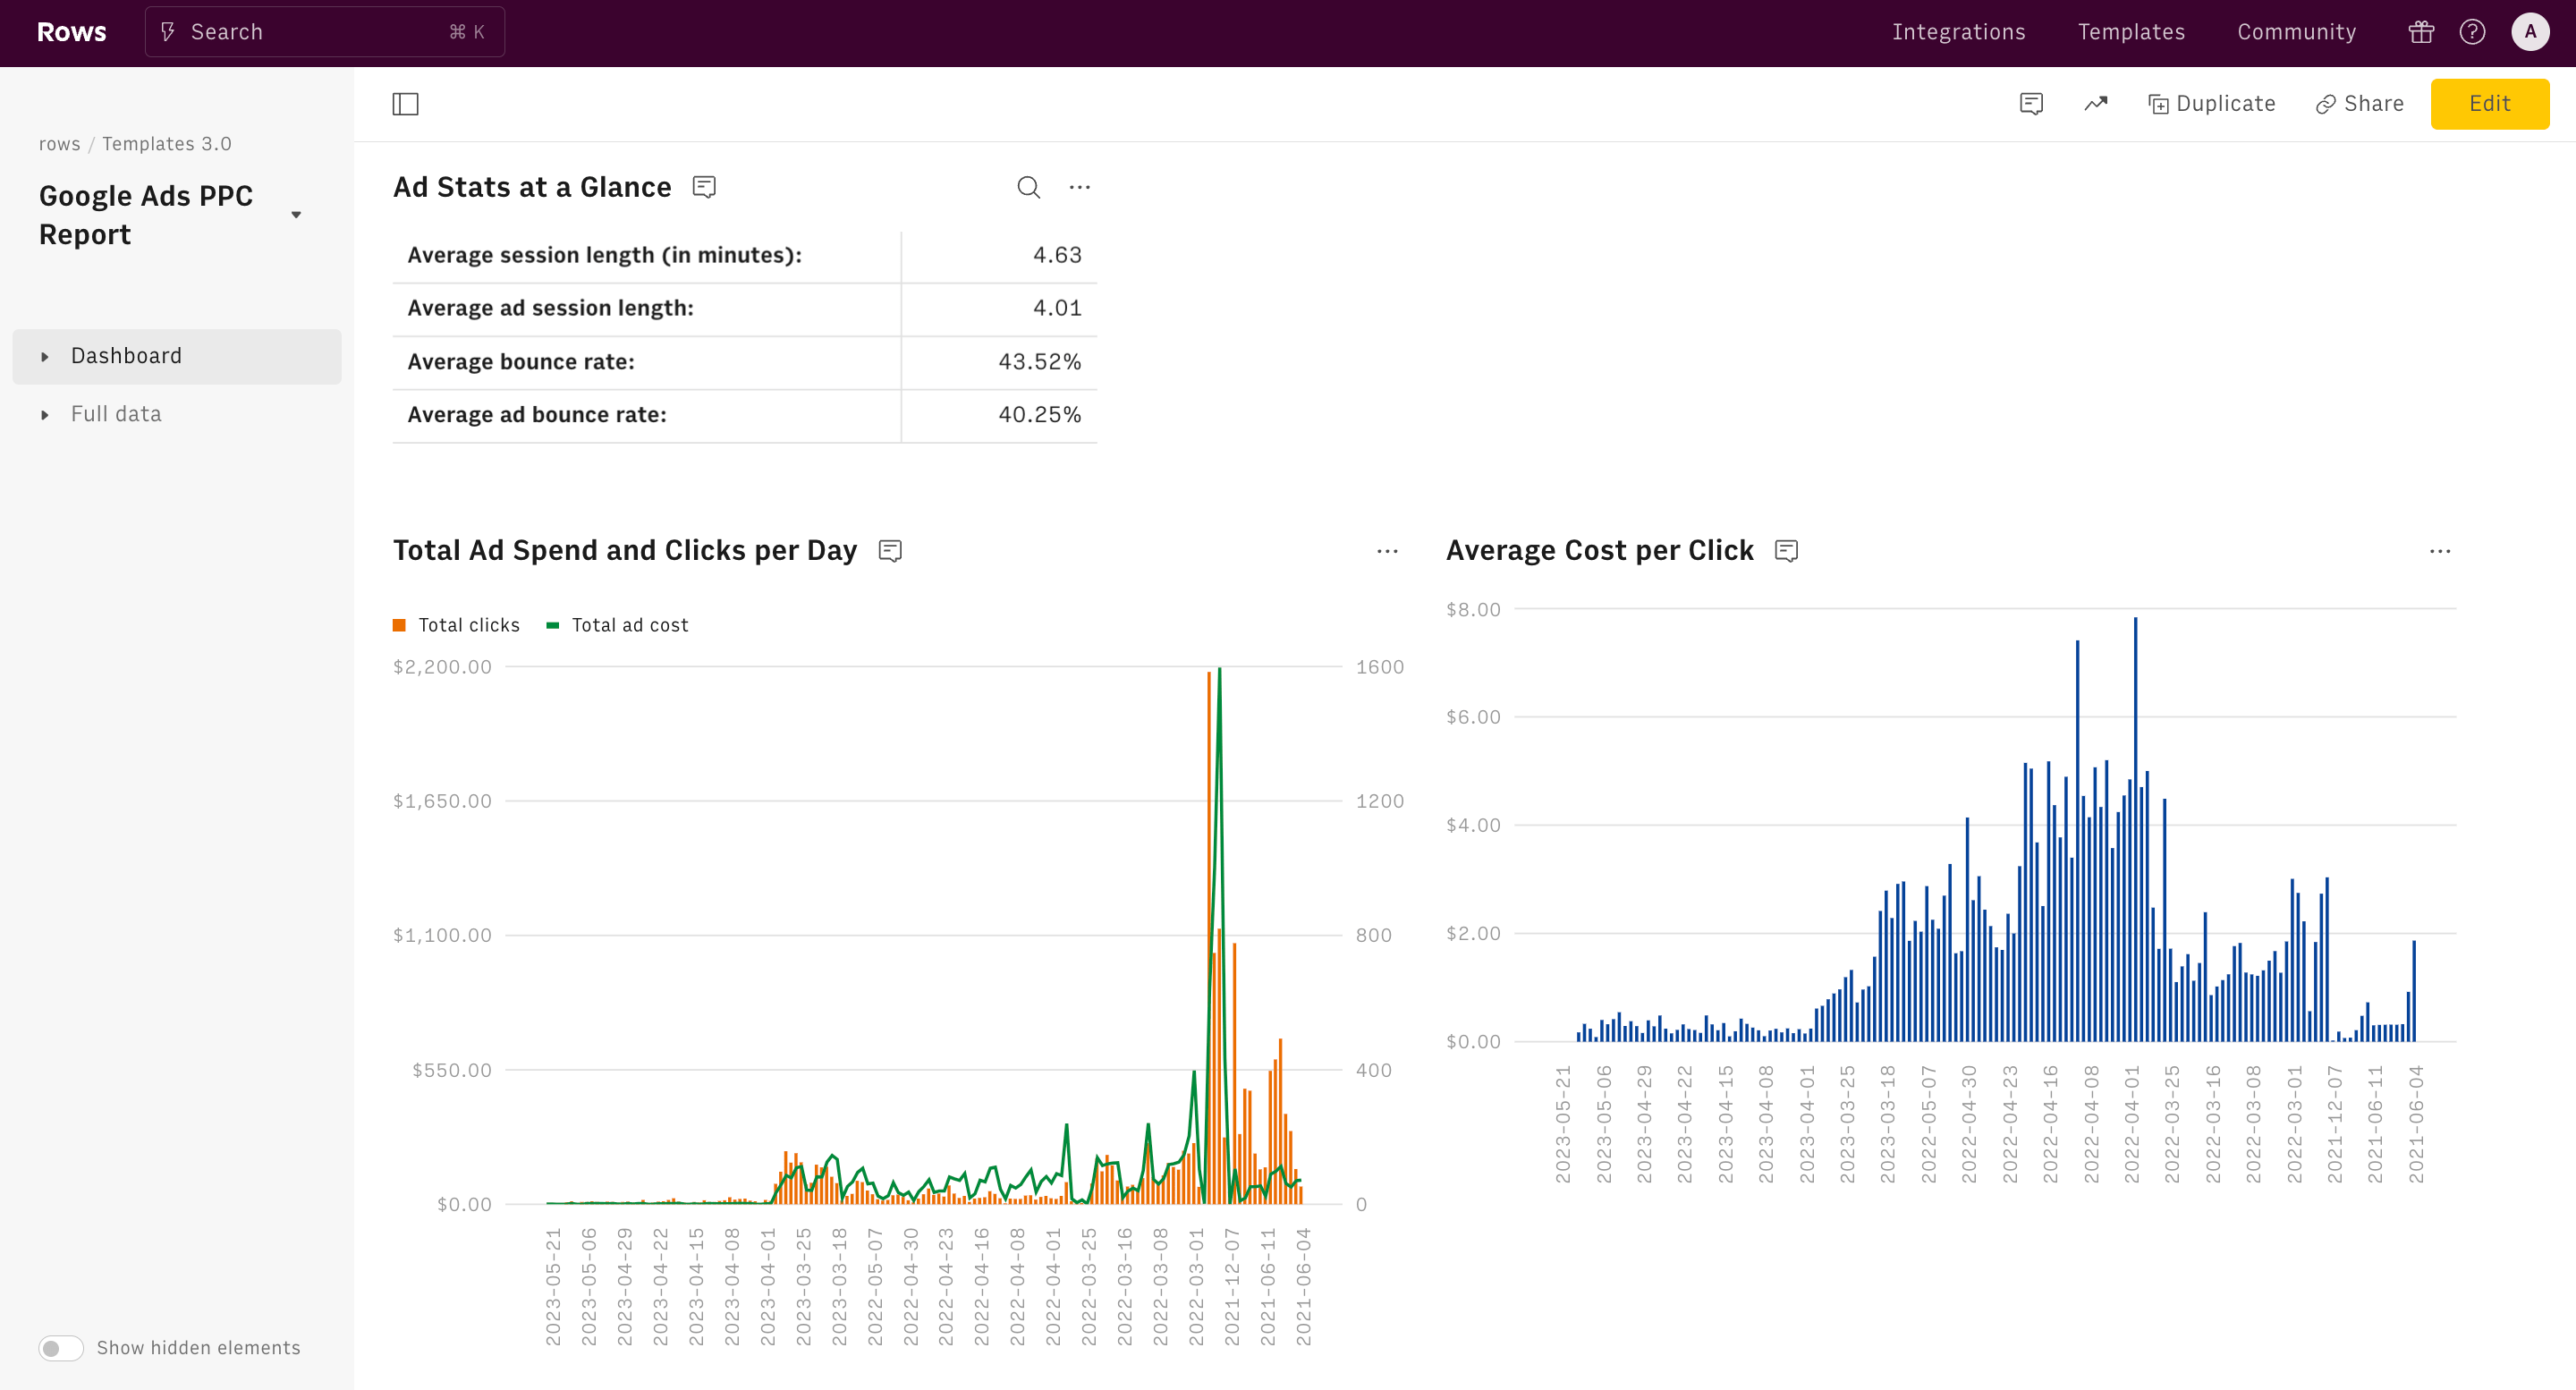
- Ad Stats at a glance. At a single glance, you're getting a comprehensive snapshot of your campaign's performance - from spending to user behavior. You'll get access to your total ad spend, cost-per-click, user engagement metrics, and even granular details like average session length and bounce rates.
- Total Ad spend and clicks per day. This dual-axis chart is a goldmine for understanding campaign dynamics. It visually correlates your daily ad spend with click volume, revealing critical patterns.
- Average Cost Per Clicks. This trend line is your efficiency meter. It tracks how your CPC evolves, showing your auction competitiveness and ad relevance.
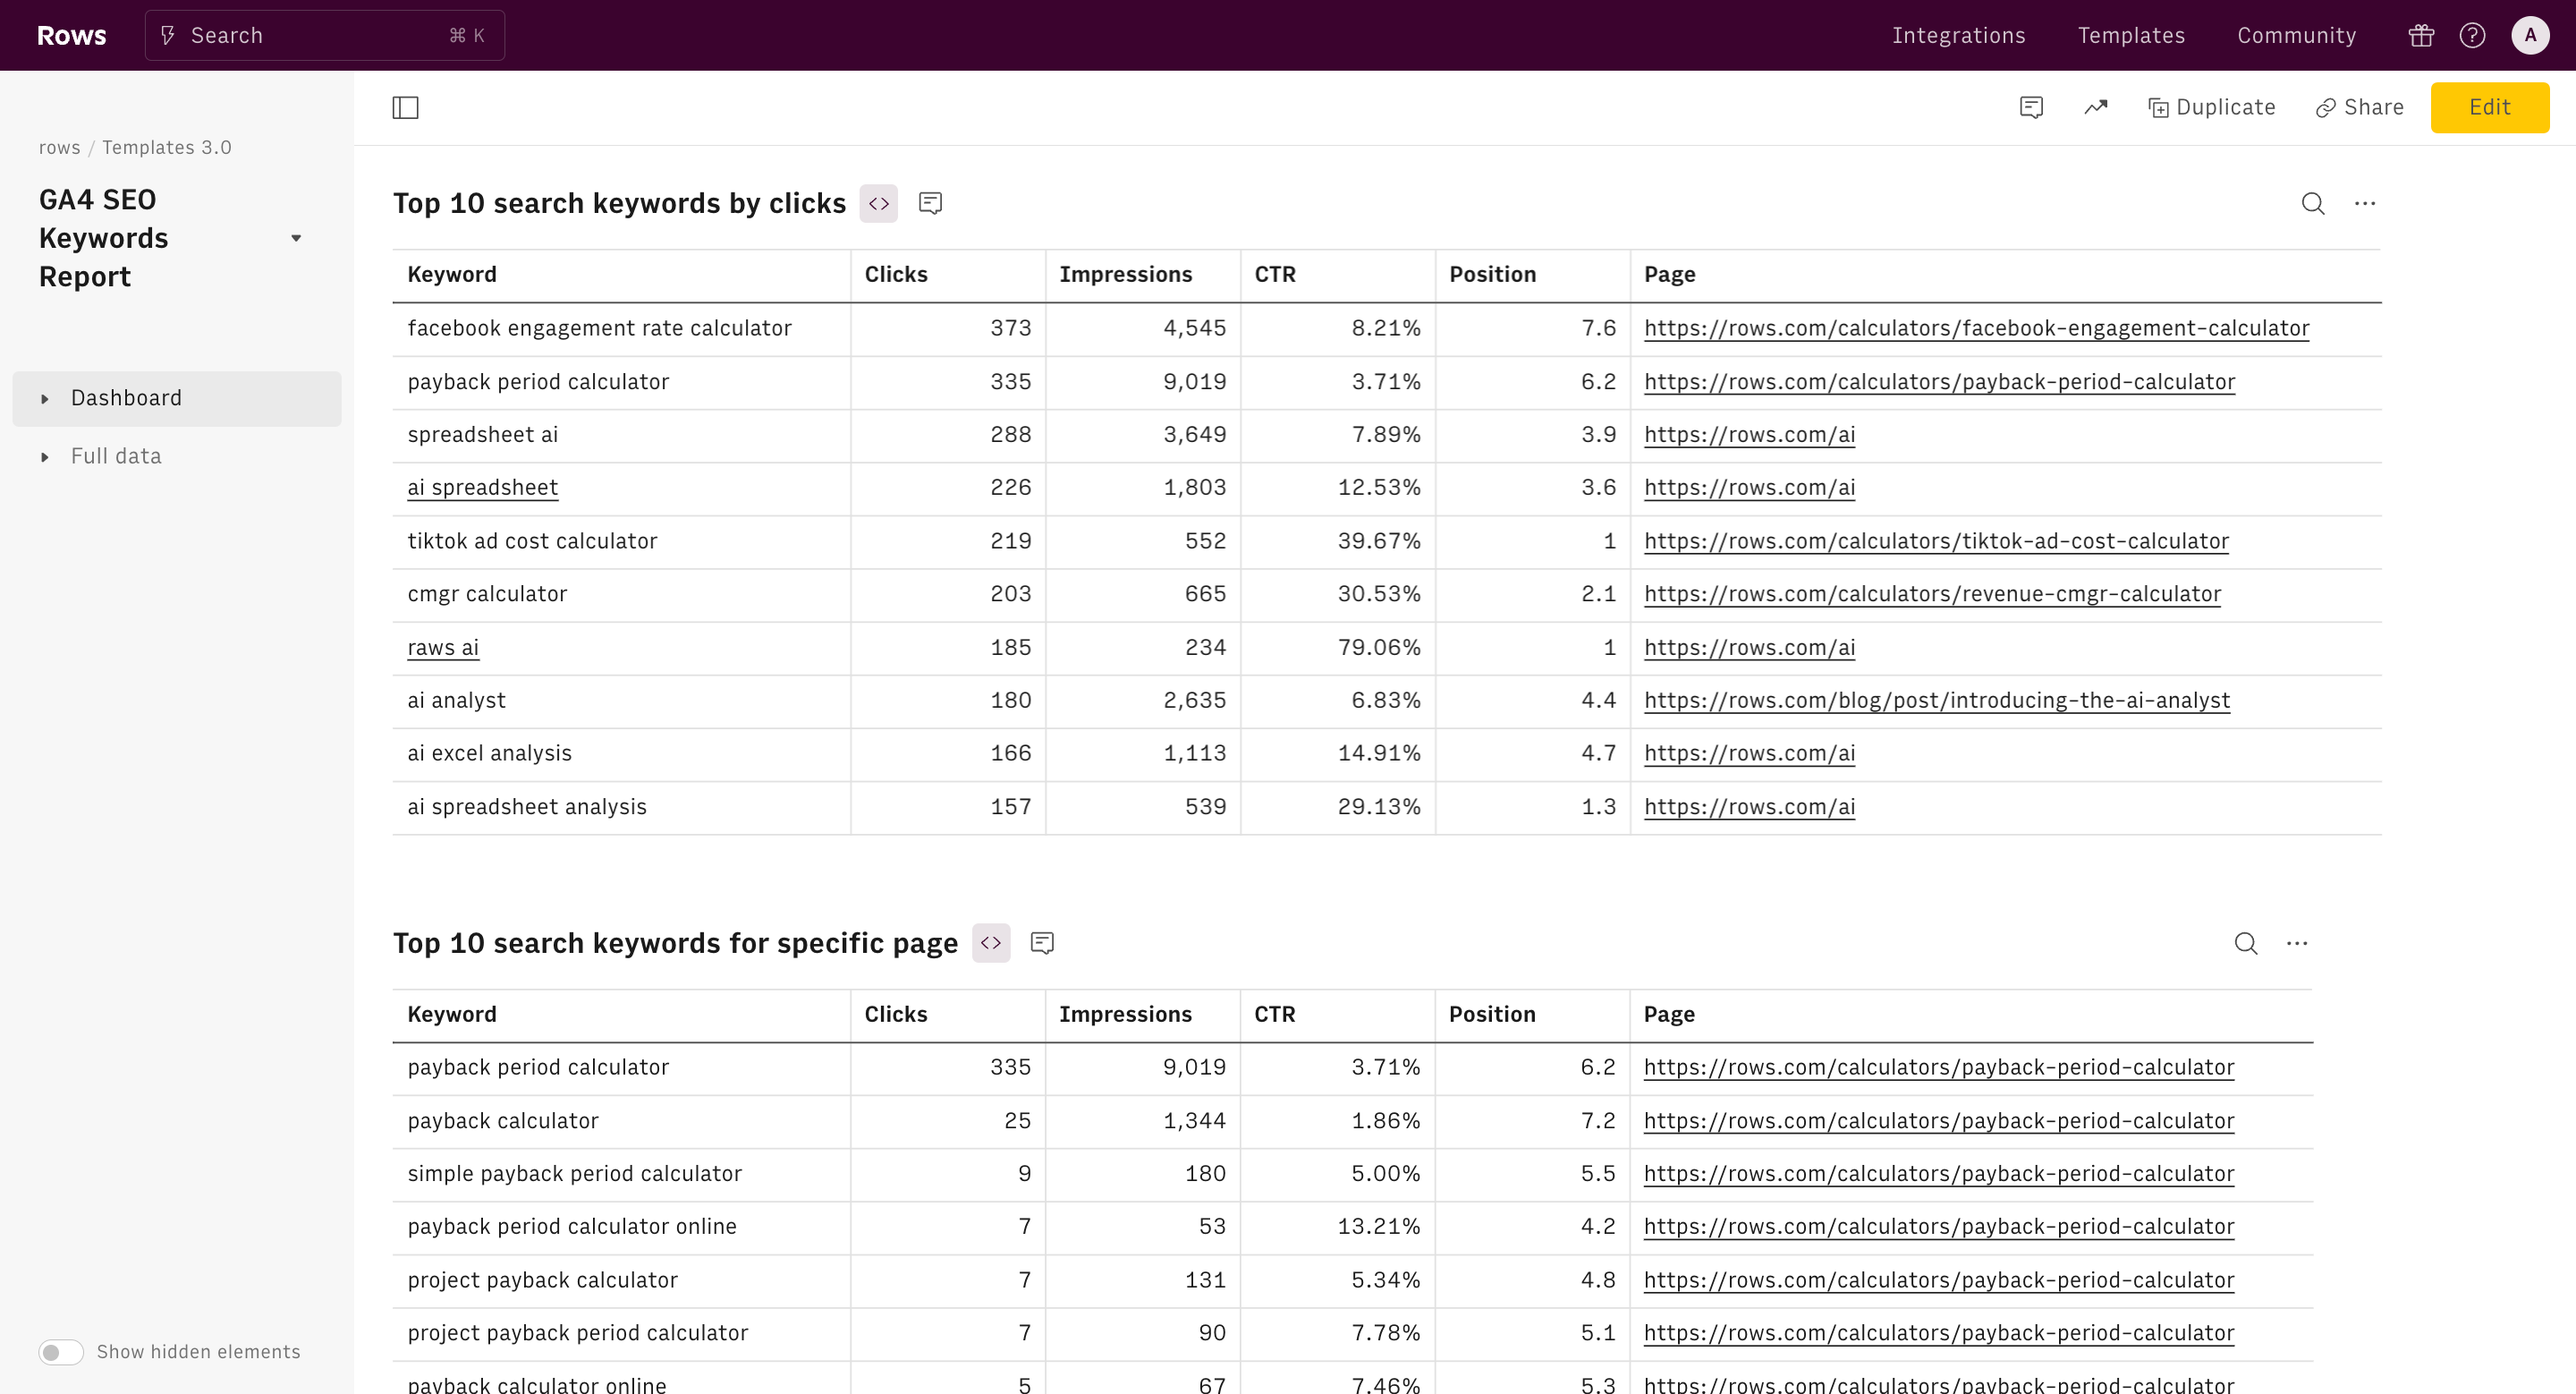
- Top 10 Google Search Queries with Ad click. This table reveals the exact search terms triggering your ads and driving user engagement, providing clear insights into your audience's intent and language.
- Top 10 Google Ad keywords. It provides a view of your most impactful keywords, allowing you to laser-focus your strategy on what's driving results. The "Total Use" column instantly shows which keywords are resonating most with your audience, while the "Advertiser Ad" and "Advertiser Ad Cost" columns reveal the financial efficiency of each keyword.
Benefits of using Google Ads Report template
1. It saves you the stress (and time) of manual reporting.
The Google Ads Report template saves you both time and stress by automating data ingestion and presenting your campaign metrics in a clear, easy-to-read format. No more juggling file exports or navigating through Google Analytics 4—key data like clicks, cost-per-click, and conversions are delivered straight to you. This automation frees you from the manual reporting process, allowing you to focus on optimizing your campaigns without wasting time on data assembly.
2. It's easy to customize
Being based on spreadsheet format, this template offers unmatched flexibility. You can quickly customize it by adding new charts, columns, and insights using traditional spreadsheet functions and formulas. This makes it easy to surface new insights and adapt the report to suit your specific needs in seconds
3. It scales consistency in reporting
Manually checking Google Analytics means inconsistency. With a this Google Ads template, you get the same layout every time. That means no “Where did I find this last time?” moments. It’s all right there, clean and organized, so you can track progress over time and catch trends that matter without scrambling.
How it works
How it works
Get started
Click on 'Use template' and start using it right away. No forms, no signup. Your data first.
Connect your Google Analytics 4 account
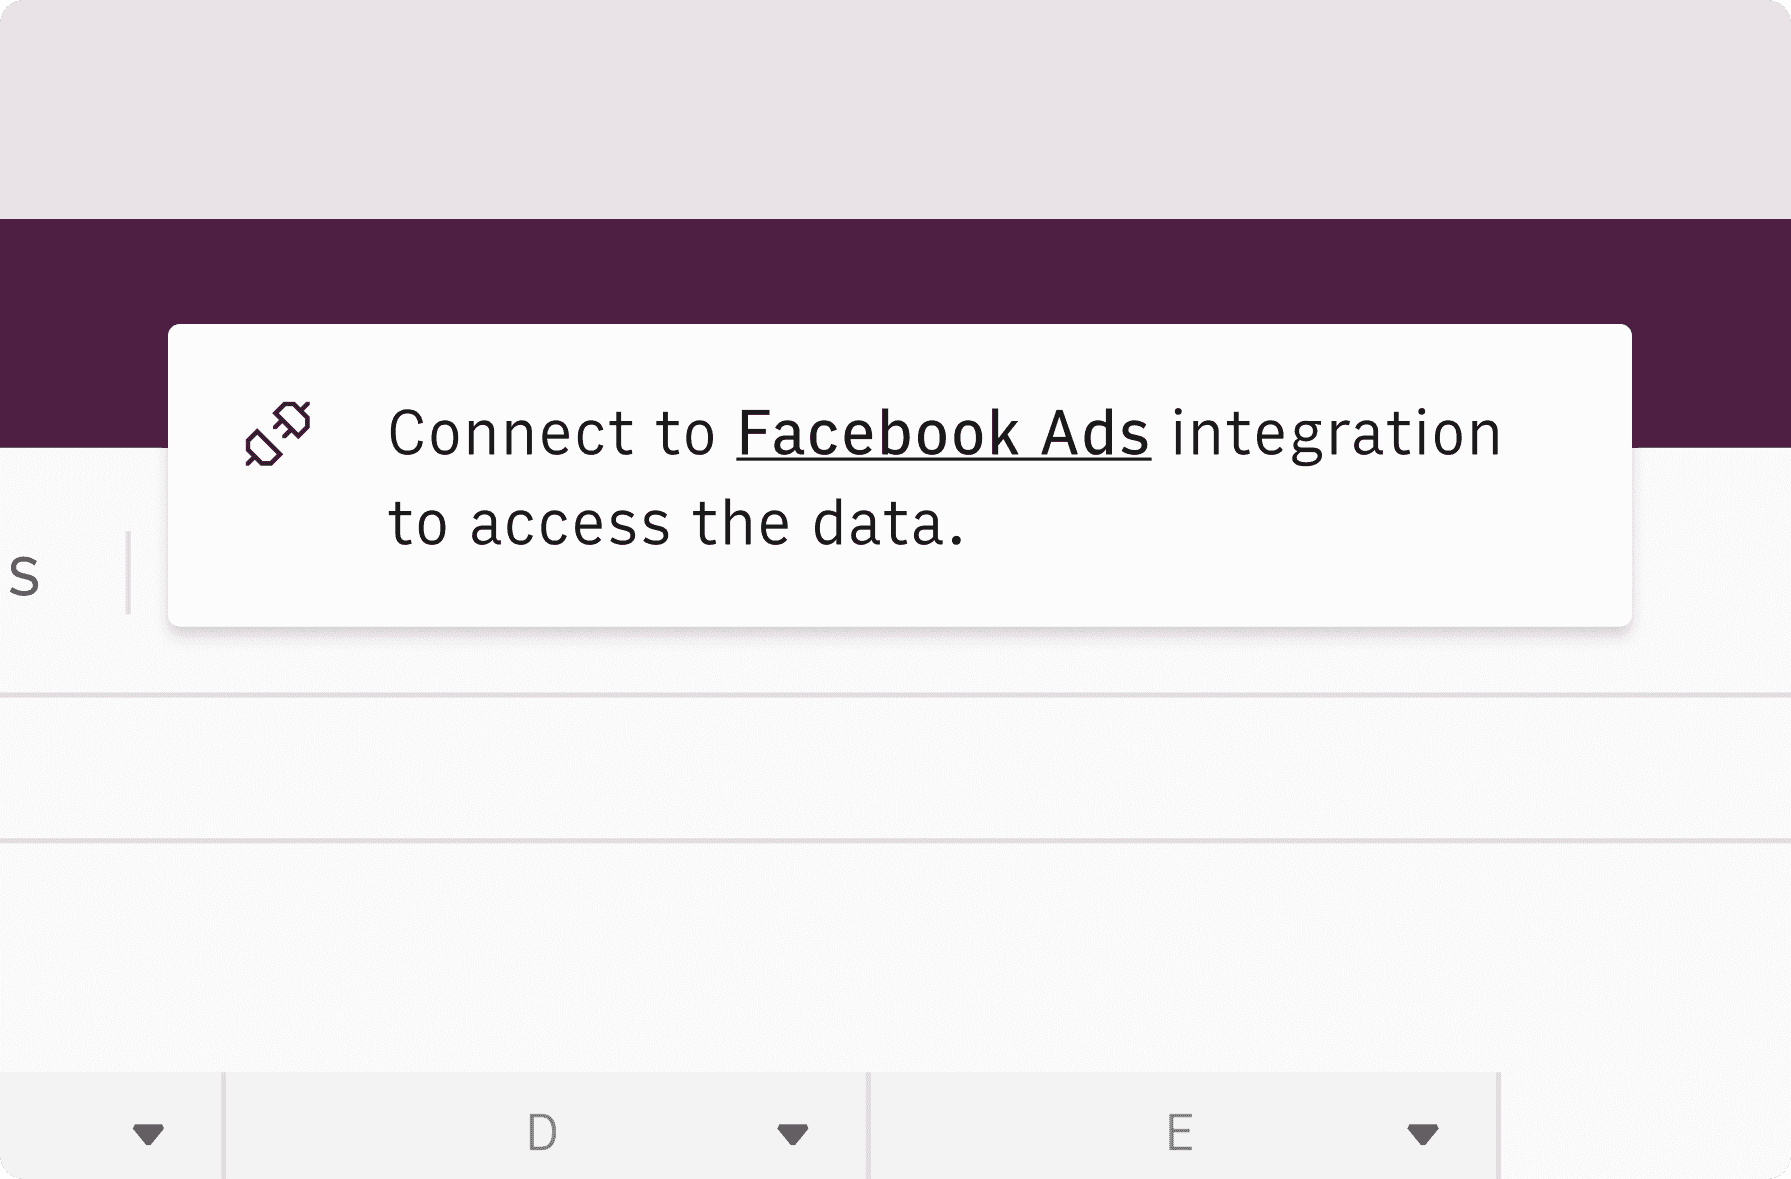
Once landed on the spreadsheet, follow the instructions to connect the required integration and pick your account.
Customize the template and schedule refresh
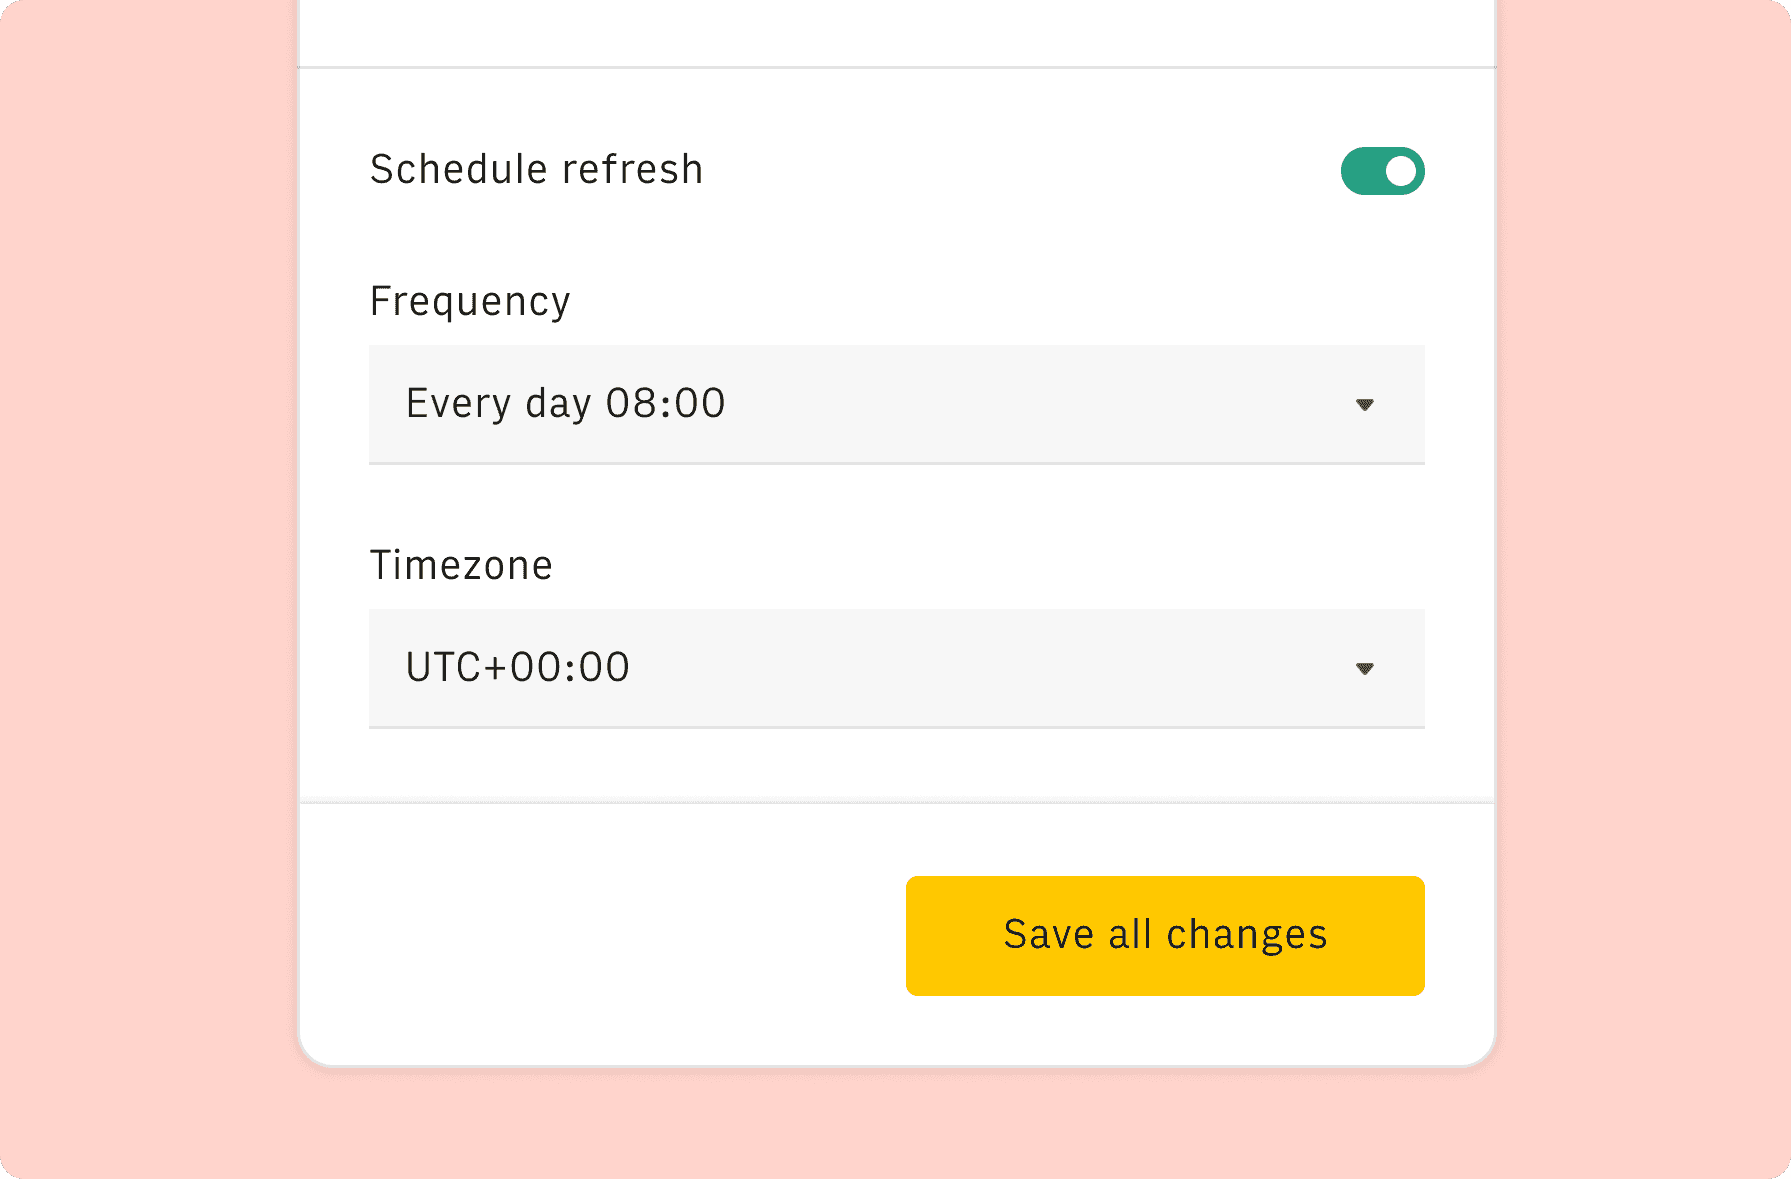
Once the integration has been connected, all tables will update automatically with your own data. Click on 'Edit Source' to change the retrieved data and automate the data refresh. You can then insert a chart or a pivot table, add a column or personalize formats, using all the regular functions and shortcuts that make spreadsheets great.
Embed tables and charts
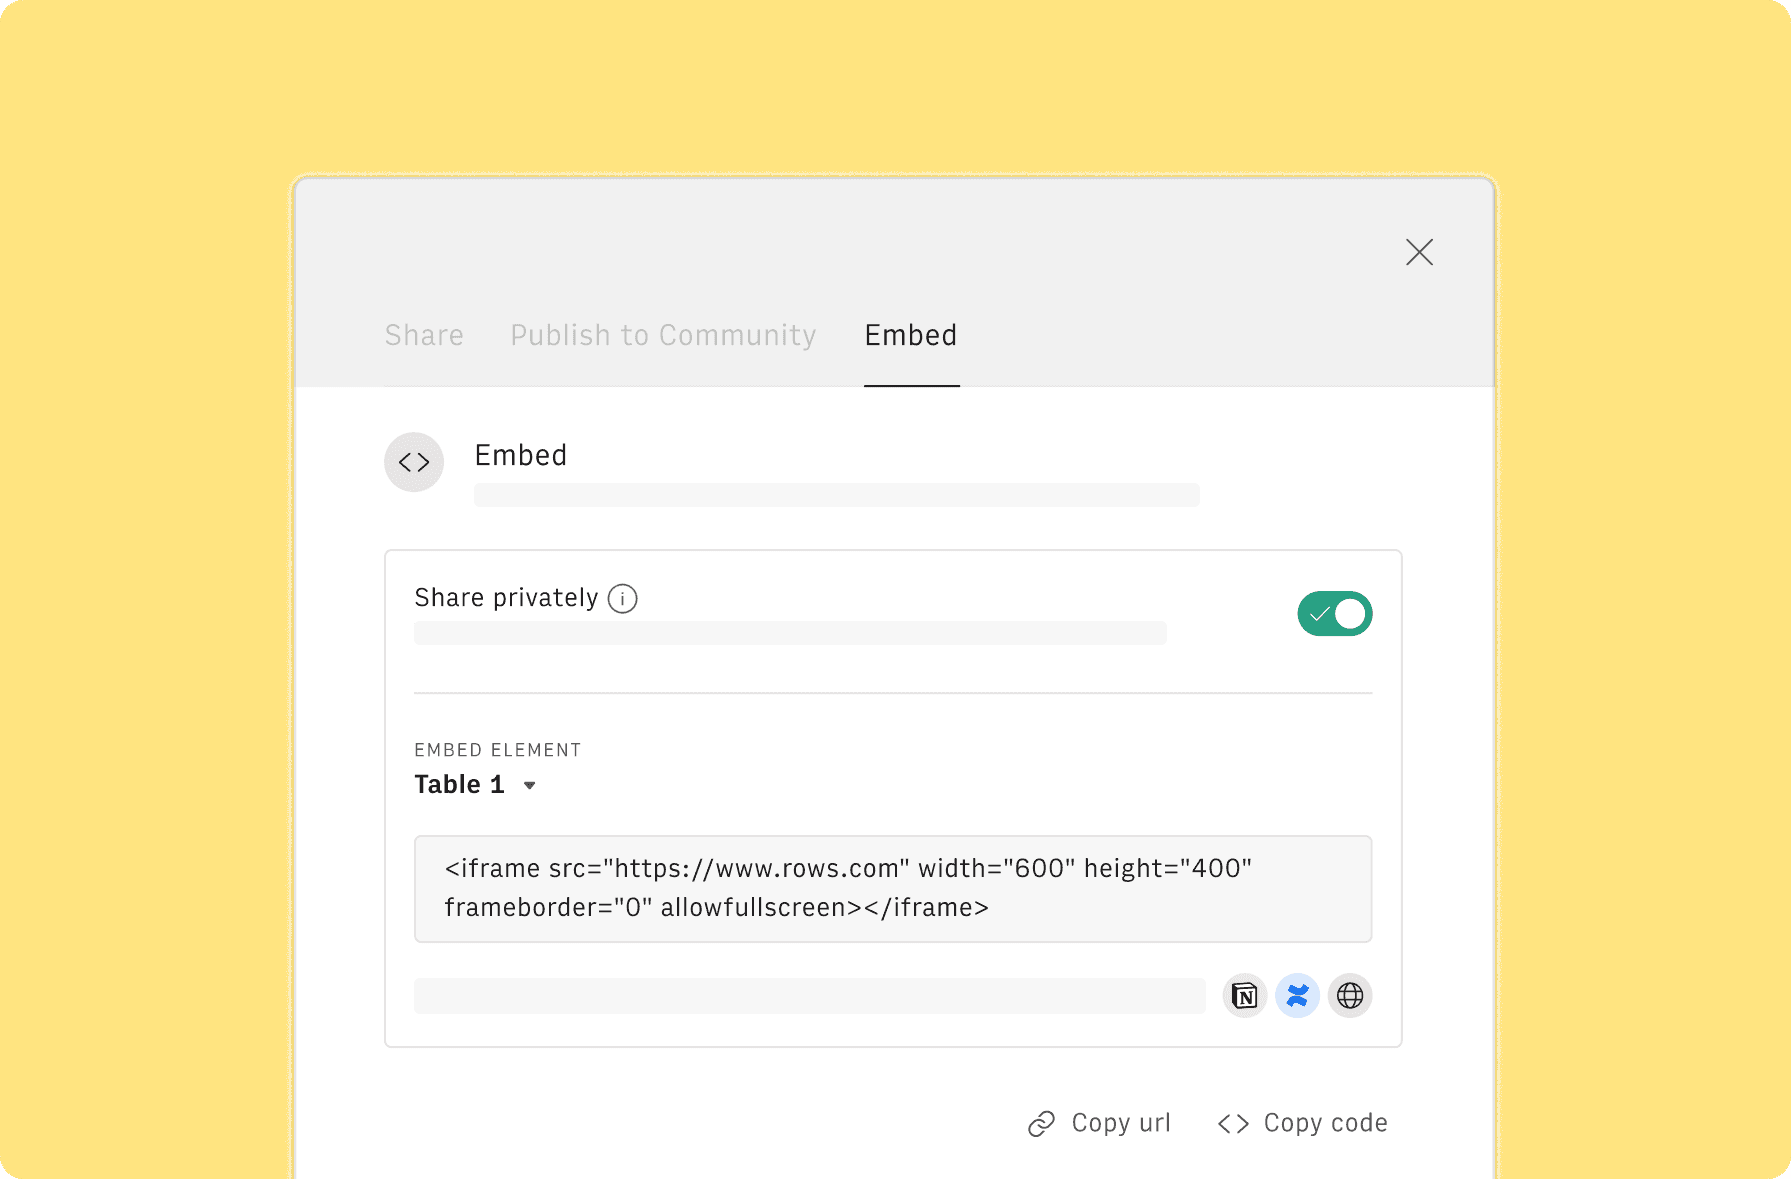
Click on the option menu to embed tables and chart on your Notion, Confluence or any other iframe-ready documents.
Questions and answers
Can I use Rows for free?
More than a Google Ads Report Template
Rows is your new AI Data Analyst. It lets you extract from PDFs, import your business data, and analyze it using plain language.
Signup for free
Import your business data
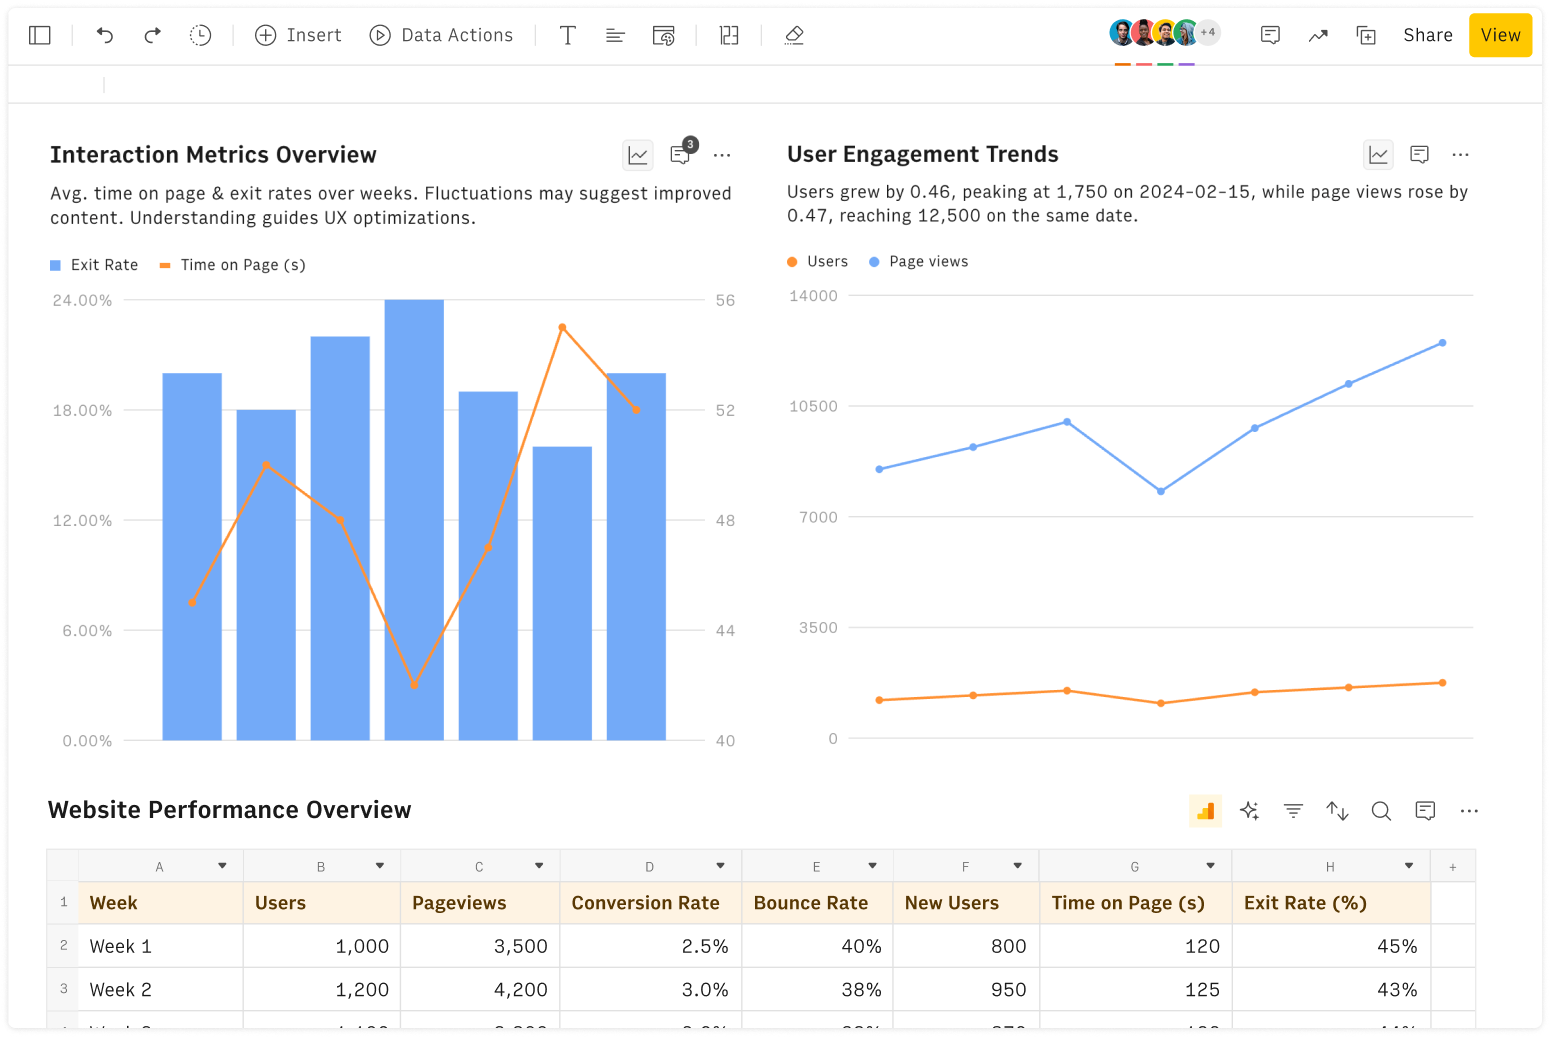
Extract from PDFs and images, import from files, marketing tools, databases, APIs, and other 3rd-party connectors.
Know moreAnalyze it with AI
Ask AI✨ any question about your dataset - from VLOOKUPs to forecasting models - and surface key insights, trends, and patterns.
Know moreCollaborate and Share
Seamlessly collaborate and share stunning reports with dynamic charts, embed options, and easy export features.
Know more
