Best 8 PPC Report Templates in 2025


You’re spending big on Google, Facebook, Instagram, and more—but when it’s time to measure results, you’re stuck trying to figure out where your ad spend went.
Even worse, you're scrambling to explain the performance of each campaign because you don’t have a clear, reliable way to report on your PPC efforts. This is where effective PPC report templates become a game-changer.
Whether you're a seasoned PPC professional or just starting, these templates will help you easily analyze, present, and optimize your pay-per-click campaigns. From Google Ads to social media advertising, we've got you covered with customizable templates for multiple channels.
Let's take a deep dive into these PPC report templates that can improve your reporting workflow and impress your clients or stakeholders.
What Are PPC Report Templates, and Why Are They Essential?
PPC report templates illustrate an analysis of the performance of your pay-per-click (PPC) advertising campaign, providing you with insights and data about how your advertising campaigns are performing across different channels.
With PPC report templates, you get a data visualization reporting the returns of every penny you spend on ads. It highlights key PPC performance metrics in a spreadsheet with charts and tables.
By using PPC report templates, you can save time, maintain consistency in your reporting, and focus on deriving actionable insights from your data

Level up your performance marketing game
With Rows, you import live data from ads platforms, automate analysis with AI and build dashboards in minutes.
Explore TemplatesWhat Are the Top 8 Free PPC Report Templates for 2025?
In 2025, marketers have access to a wide array of free PPC report templates that cater to various campaign types and platforms. These templates are designed to help you showcase your pay-per-click performance in the most effective way possible.
Additionally, at Rows we are not leaving you in the dark with lifeless templates — Rows has over 50 integrations that let you get live data on spreadsheets, that way, you can connect to your ad accounts.
From comprehensive Google Ads reports to specialized templates for social media advertising, we've curated a list of the top 10 free PPC report templates that will elevate your reporting game. Each template offers unique features and insights, allowing you to choose the perfect fit for your campaign needs and reporting style.
Template 1: Comprehensive Google Ads Performance Report
Our Google Ads report template gives you a detailed breakdown of your paid Google Ads keywords, the search terms that lead visitors to click on your ads, and your total ad spend and average cost per click over the most recent period.
You can't find this data until you connect your Google Ads and Google Analytics paid search analytics accounts. Once these accounts are connected, our report template automatically illustrates your total ad spend, average CPC (Cost Per Click), top ads, and search keywords.
This report template offers you the following metrics at a glance:
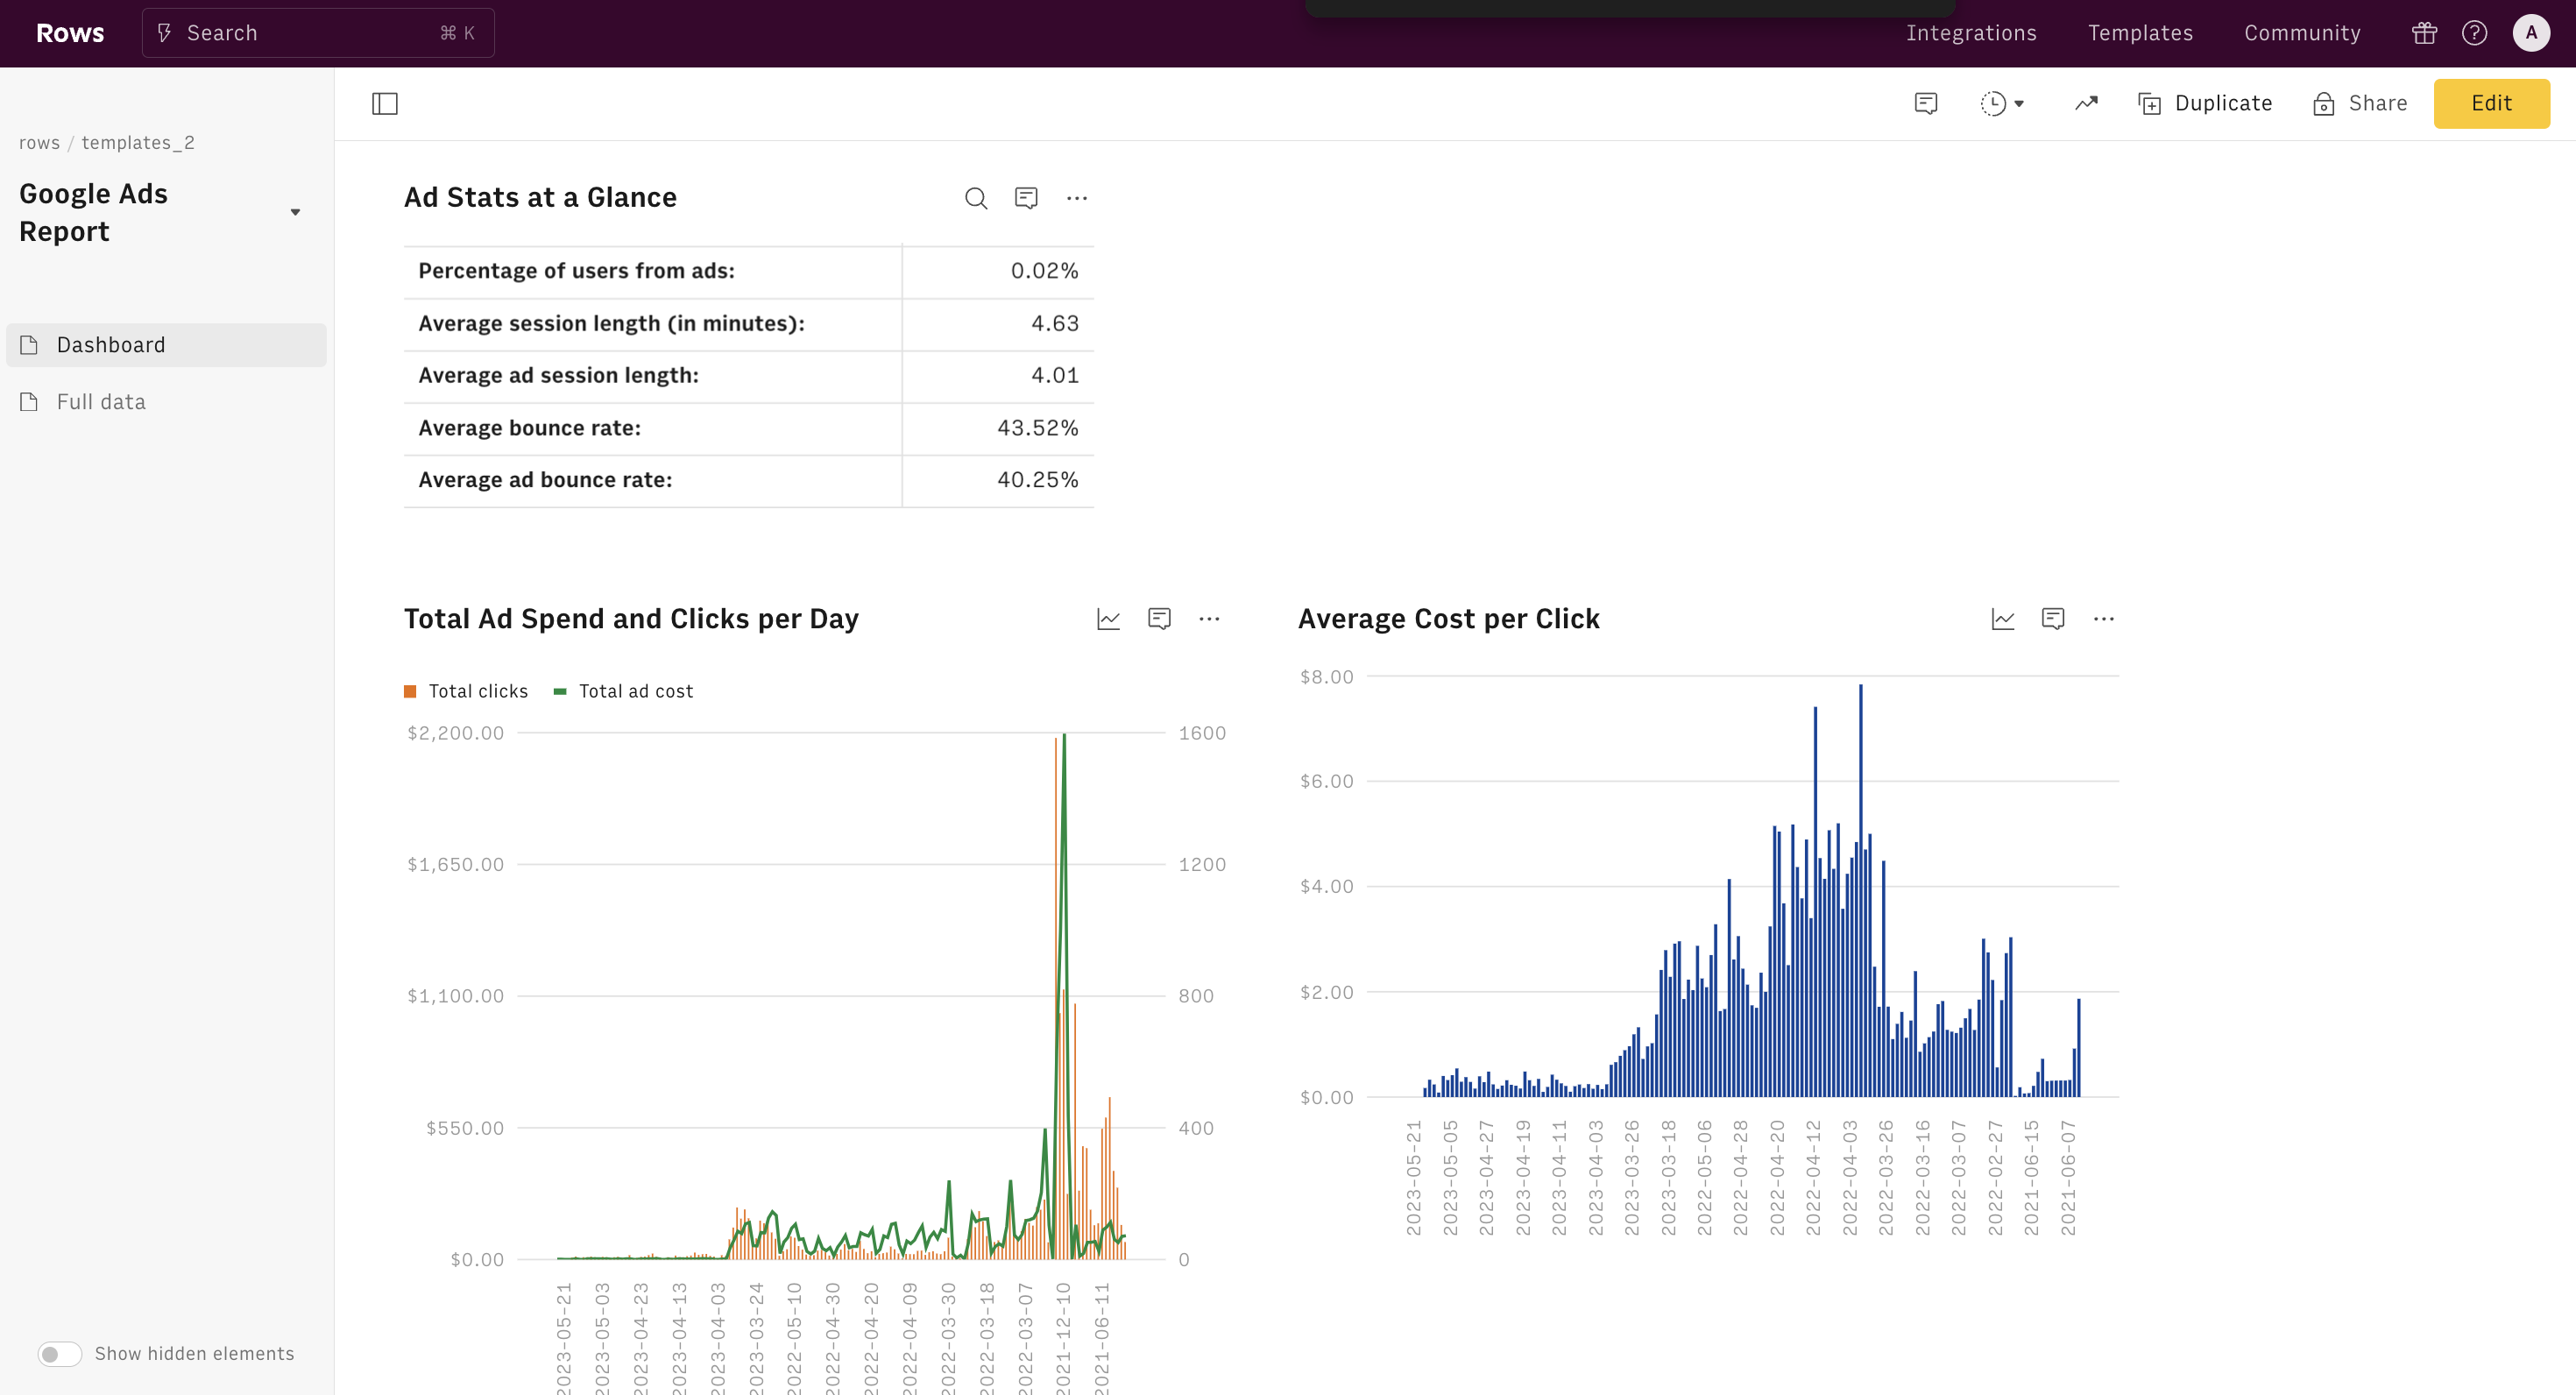
Ad Stats at a glance.
At a single glance, you're getting a comprehensive snapshot of your campaign's performance - from spending to user behavior. You'll get access to your total ad spend, cost-per-click, user engagement metrics, and even granular details like average session length and bounce rates.
Total Ad spend and clicks per day
This dual-axis chart is a goldmine for understanding campaign dynamics. It visually correlates your daily ad spend with click volume, revealing critical patterns.
Average Cost Per Clicks
This trend line is your efficiency meter. It tracks how your CPC evolves, showing your auction competitiveness and ad relevance.
Top 10 Google Search Queries with Ad click
This table reveals the exact search terms triggering your ads and driving user engagement, providing clear insights into your audience's intent and language.
Top 10 Google Ad keywords
It provides a view of your most impactful keywords, allowing you to laser-focus your strategy on what's driving results. The "Total Use" column instantly shows which keywords are resonating most with your audience, while the "Advertiser Ad" and "Advertiser Ad Cost" columns reveal the financial efficiency of each keyword.
How to use this template
Follow the panel's instructions to get started with our Google Ads Campaign Report Template. Connect your Google Ads account, and the data will automatically be fetched into the dashboard. This seamless process ensures you have up-to-date information on how to check ads on Google Ad campaigns and track your campaign's success.
CTA: Start using the template now!
Template 2: Facebook Ads Campaign Report
Facebook Ads are crucial in modern paid marketing strategies, offering unparalleled reach and precise targeting options. Key performance indicators (KPIs) such as click-through rate (CTR), conversion rate, and return on ad spend (ROAS) help in measuring the success of your campaigns.
Our Facebook Ads Campaign Report template is connected to your Facebook Ads account and automates the tracking of the main KPIs, ensuring your marketing efforts are always on point.
This Facebook ads campaign report template offers a comprehensive overview of your Facebook Ads campaigns. It allows you to have access to a summary of your campaign performance over a particular period of time.

Key metrics of the Facebook ads campaign report template:
Campaign Performance Summary
This table presents a concise view of the core performance metrics for each campaign, including clicks, CPC (cost per click), CPM (cost per thousand impressions), and CPP (cost per purchase).
Campaign Objectives Breakdown
This table breaks down the performance of different campaigns based on their objectives, such as lead generation, impressions, purchases, and spending.
Leads and Purchases vs Spend
This chart shows the relationship between the number of leads and purchases generated versus the total spend.
Clicks and Spends by the Publisher
This table tracks how much each publisher contributes in clicks, spending, and the corresponding cost per order and lead.
Spend by Objective
This chart visually breaks down the total spend across various campaign objectives, offering insights into where your budget is allocated relative to each campaign’s goal.
Weekly Spend by Objective
This table provides a week-by-week breakdown of how much is spent on different campaign objectives. It's particularly useful for tracking performance over time. It allows PPC managers to dynamically identify trends and adjust spending to match performance shifts, such as increasing budgets during high-conversion weeks or pulling back spending during slower periods.
Daily Summary
This table gives a detailed breakdown of key performance metrics (impressions, spend, leads, purchases, cost per lead, and cost per purchase) on a day-to-day basis.
How to use this template
Follow the panel's instructions to get started with our Facebook Ads Campaign Report Template. Connect your Facebook Ads account, and the data will automatically get fetched into the dashboard. This seamless process ensures you have up-to-date information on how to check ads on Facebook and track your campaign's success.
CTA: Start using this template now!
Template 3: Instagram Ads Campaign Report
This comprehensive Instagram Ads dashboard report is designed to provide detailed insights into your ad performance, helping you understand how Instagram ads work and optimize your campaigns. You'll have all the necessary information, with sections dedicated to weekly performance summaries, campaign performance summaries, and objective breakdowns.

Our Instagram Ads Campaign Report Template includes:
Weekly Performance Summary.
Track your weekly ad metrics such as Impressions, Spend, Leads, Purchases, Cost per Lead, and Cost per Order.
Campaign Performance Summary
Dive deeper into your campaigns with detailed metrics, including Campaign Name, Clicks, CPC, CPM, CPP, CTR, Reach, Spend, Leads, Purchases, Cost per Order, Cost per Lead, and ROAS.
Campaign Objective Breakdown.
Understand the distribution of spending by objective.
Leads and Purchases vs. Spend Chart.
Visualize the correlation between your spending and the results achieved.
Weekly Spend by Objective.
Monitor how your budget is allocated across different objectives weekly.
How to Use This Template
Follow the panel's instructions to get started with our Instagram Ads Campaign Report Template. Connect your Facebook Ads account, and the data will automatically get fetched into the dashboard. This seamless process ensures you have up-to-date information on checking Instagram ads and tracking your campaign's success.
CTA: Start using this template now!
Template 4: LinkedIn Ads Dashboard Template
This template shows you all the main KPIs of your LinkedIn Ads campaign, including audience demographics and cost-related metrics.
Our LinkedIn Ads Dashboard template is designed to provide you with a comprehensive overview of your LinkedIn advertising efforts.
This powerful tool simplifies your LinkedIn reporting by offering high-level period summaries, including the number of campaigns, total spend, clicks, and cost-per-click (CPC). Dive deeper with campaign-specific summaries, spending, CPC trends over time, and audience breakdowns by job function, country, industry, and company size. This LinkedIn analytics tool is your go-to resource for detailed insights into your LinkedIn advertising performance.

Metrics at a glance:
Period summary
This table aggregates the SUM of all the LinkedIn campaigns you run.
Clicks and spend overtime
This chart shows the relation between clicks per ad and expenditure on ads over a particular period of time.
Spend and CPC by campaign
This chart shows the relation between your spending on ads and cost-per-click by the campaign over time.
Most engaged job functions
This chart shows the level of engagement per role in an industry. For example, it can show you if founders engaged more with your posts.
Most engaged industries
This chart shows the industry or niche that engaged more with your LinkedIn advertising campaigns.
Most engaged company sizes
Companies differ by employee sizes; for example, 51-100, and others range from 500 to above. This chart shows you the sizes of companies that engaged with your LinkedIn campaigns
Campaigns, total spend, and CPC
For every campaign you run, this chart gives a total sum of total Ad spend and cost per click (CPC) for each campaign.
Top 10 performing industries
This table helps identify which industry sectors generate the best results for LinkedIn ad campaigns.
Top 10 performing company size
This table reveals which company size segments are most engaged with the LinkedIn ads.
Top 10 performing seniority
This table highlights which seniority levels are most responsive to the LinkedIn ads.
How to Use the LinkedIn Ads Dashboard
Getting started with our LinkedIn Ads Dashboard is straightforward. All you need to do is:
Follow the instructions in the panel to connect your LinkedIn Ads account to Rows
Once connected, pick a date range to filter data from the desired period
Your LinkedIn ad stats will be automatically fetched and displayed in the dashboard.
CTA: Start using the template now!
Template 5: Tiktok Ads Dashboard Template
This template gives you a comprehensive report of your TikTok Ads campaigns. Our TikTok Ads Dashboard template is designed to provide comprehensive insights into your TikTok ad campaigns. This powerful tool aggregates crucial data points to help you track and optimize your advertising performance. With features like a weekly performance summary, ad group performance breakdown, spending by objective, and demographic analysis, this dashboard offers everything you need to make informed decisions about your TikTok advertising strategy.
Key Components of the TikTok Ads Dashboard
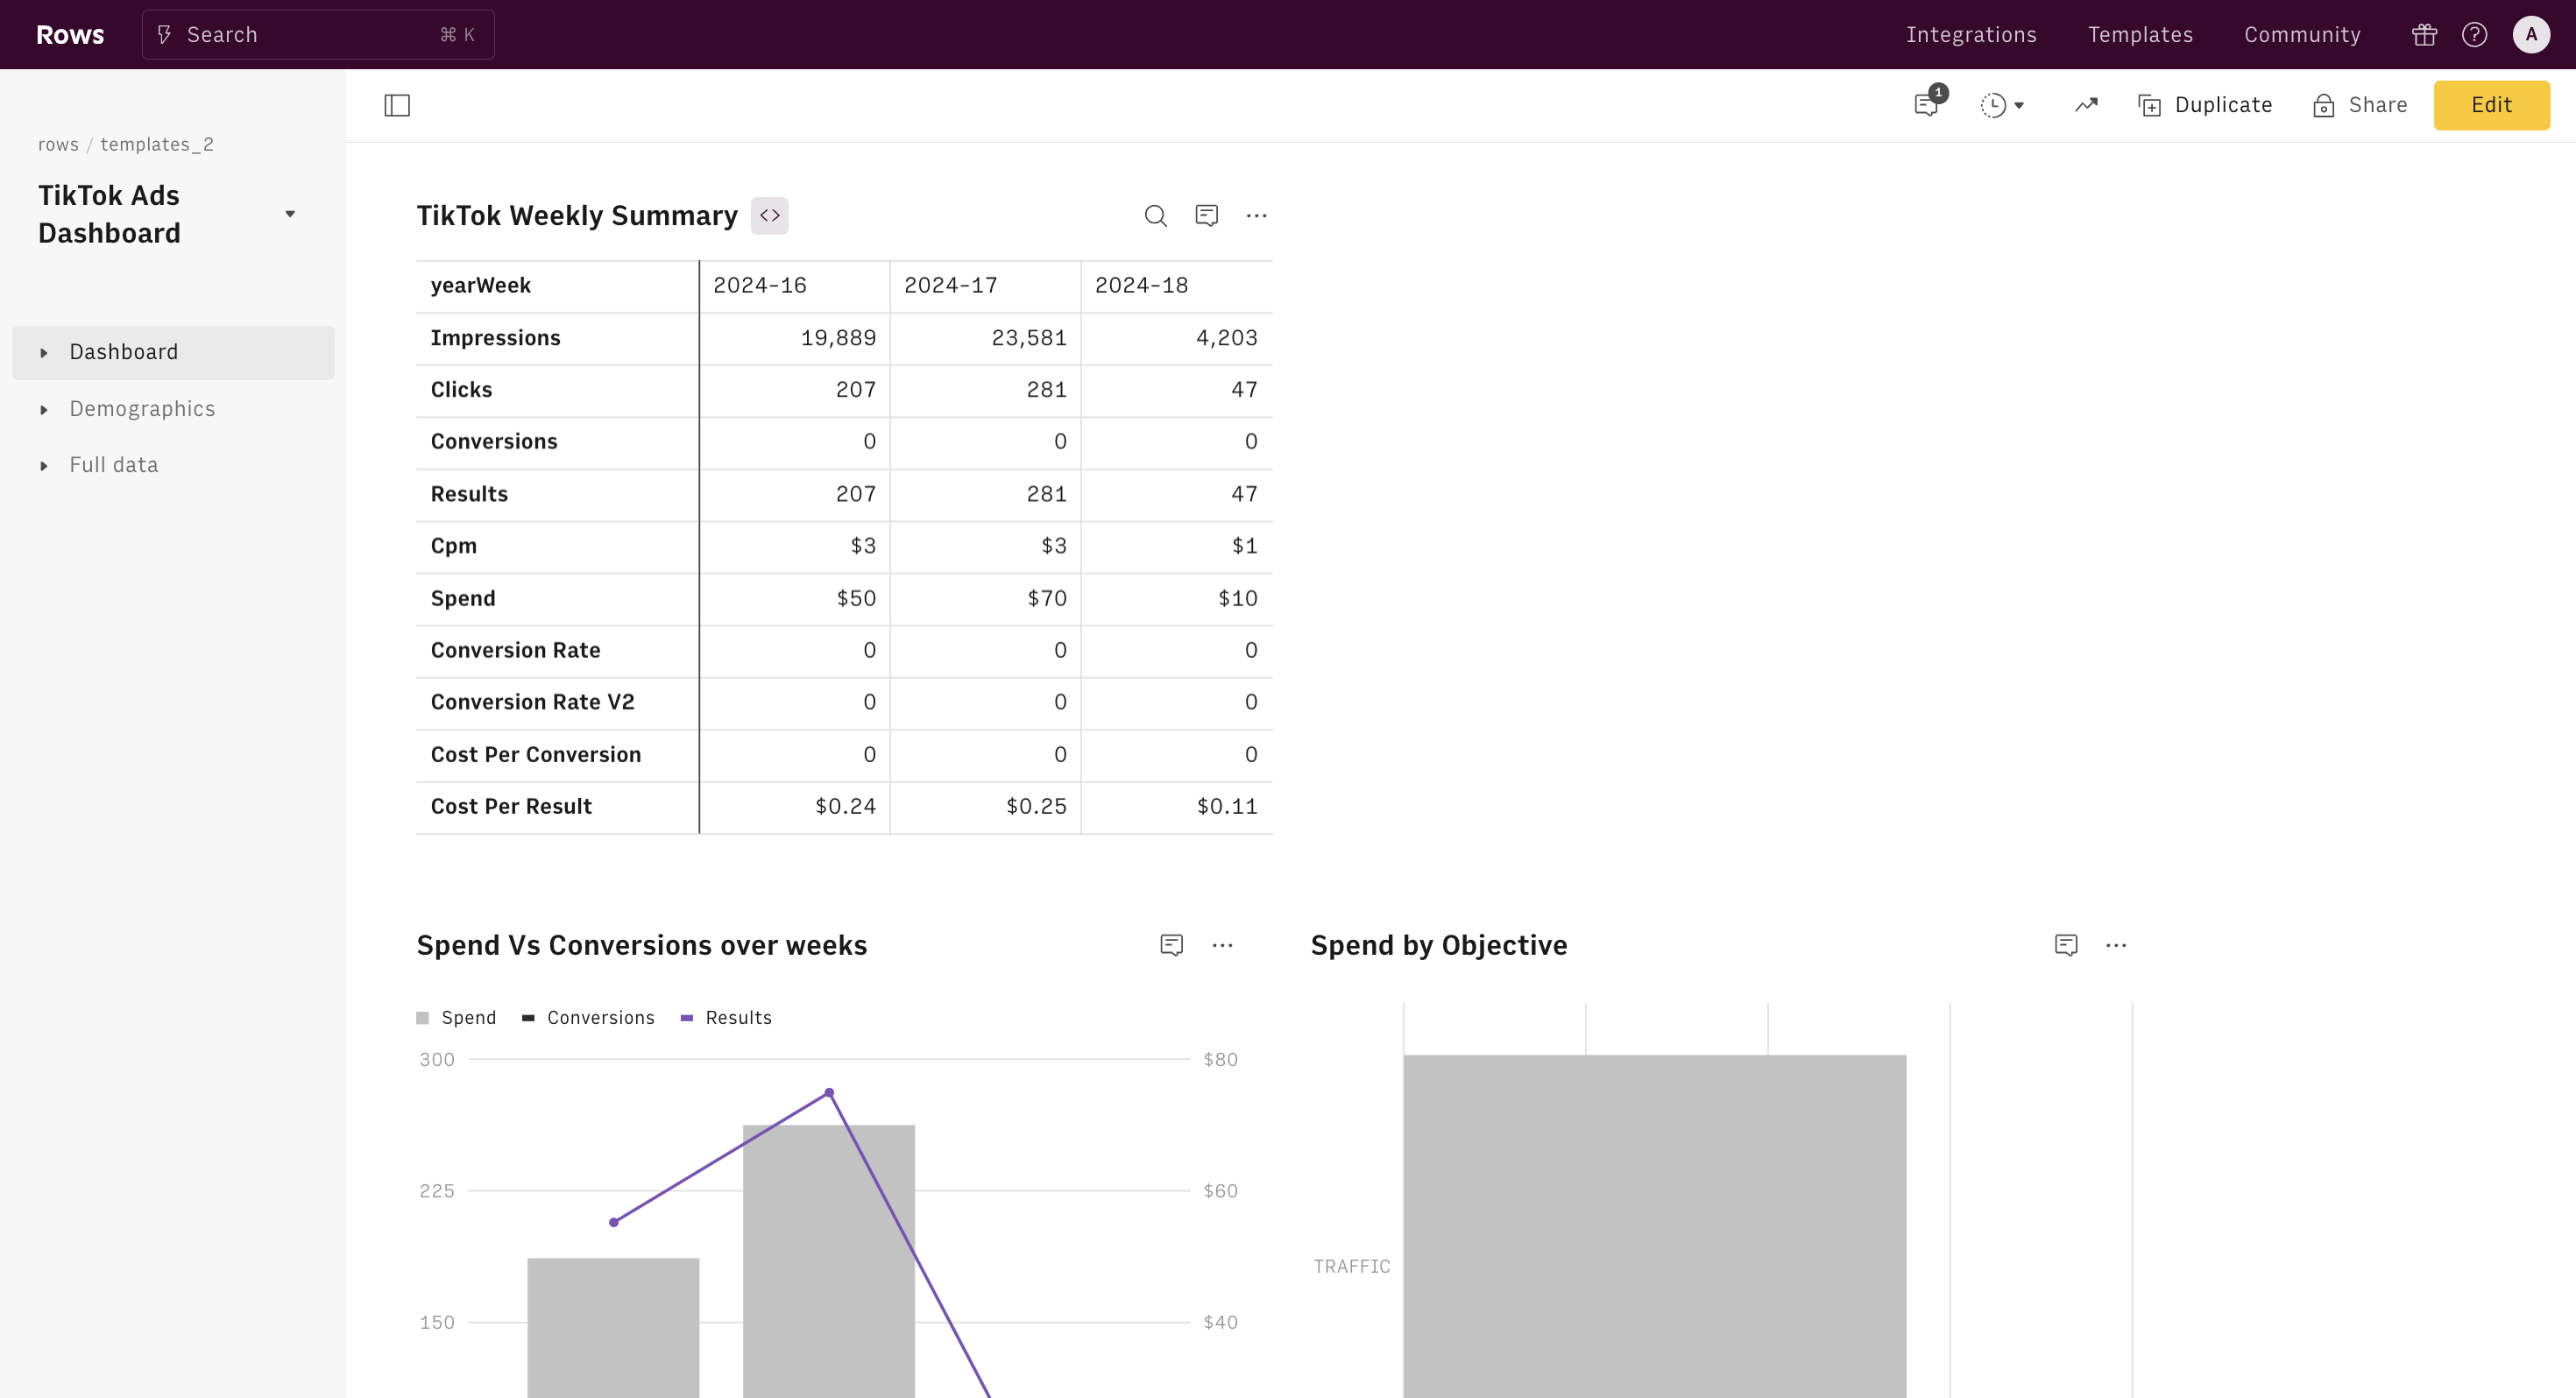
Weekly Performance Summary
Stay on top of your campaigns with our detailed weekly performance summary. Monitor key metrics, including impressions, spending, leads, purchases, and cost per lead and order. Year-Week clearly labels each week's data to provide a chronological view of your campaign's progress.
Adgroup Performance Summary
Analyze the effectiveness of your ad groups with our group performance summary. Track metrics such as campaign name, clicks, CPC, CPM, CPP, CTR, reach, spend, leads, purchases, cost per order, cost per lead, and ROAS..
Spending by Objective Breakdown
Understand where your budget goes with a detailed breakdown of spending by objective.
Conversions vs. Spend Chart
Visualize the relationship between your spending and conversions with our easy-to-read chart.
Demographics Breakdown
Gain a deeper understanding of your audience with our demographics breakdown. Analyze your audience by age, interest, gender, and country to tailor your campaigns to the right demographics and improve your targeting strategies.
How to Use the TikTok Ads Dashboard
Using our TikTok Ads Dashboard is simple and straightforward. Follow the instructions in the panel to connect your integration account. Once connected, the dashboard will automatically fetch and update your data, providing real-time insights into your TikTok ad campaigns. This automated process saves you time and ensures you have the most current data.
CTA: Start using this template now!
Level up your performance marketing game
With Rows, you import live data from ads platforms, automate analysis with AI and build dashboards in minutes.
Explore Templates
Conversion discrepancies report templates
Conversion discrepancies can occur for various reasons, including differences in attribution models, tracking issues, and data processing times. Monitoring these discrepancies is essential to ensure the accuracy of your performance metrics.
To help you out, at Rows we've developed comprehensive conversion discrepancies report templates. With these templates, you can identify and analyze discrepancies effectively.
Template 6: Google Ads Conversion Discrepancies Report
With our Google Ads conversion discrepancies template, you can easily track and compare conversion data from Google Ads with Google Analytics 4. Identify and resolve discrepancies to maximize your marketing ROI.
Components of the Template
Google Analytics UTM Tracking: To start, input the UTMs you use for your Google Ads campaigns into the provided table. This will ensure accurate tracking and comparison of your ad performance data.
GA4 Conversion Event Naming: Next, specify the name of the conversion event as it is defined in your Google Analytics 4 account. This step is crucial for aligning the data from your ad channels with the data reported by GA4.
Discrepancy Analysis Report: The core component of this template is the discrepancy report. Pick a date range for the analysis and get a report that measures and displays the discrepancies between conversions reported by your ad channels and those attributed by GA4.
How This Template Helps
This template provides a clear and concise report of conversion discrepancies, allowing you to identify and address issues quickly. By aligning the data from your ad channels and GA4, you can make more informed decisions and enhance your marketing strategies.
CTA: Use this template now!
Template 7: LinkedIn Ads conversion discrepancies report
The LinkedIn Ads Conversion Discrepancies Report template is a powerful tool to help marketers and data analysts streamline their advertising performance analysis.
This dashboard compares the conversion data from your ad channels (LinkedIn Ads) with the conversions tracked by Google Analytics 4. By identifying discrepancies between these platforms, you can make data-driven decisions to enhance your marketing strategies and boost your ROI.
Components of the Template
Google Analytics UTM Tracking: To start, input the UTMs you use for your LinkedIn Ads campaigns into the provided table. This will ensure accurate tracking and comparison of your ad performance data.
GA4 Conversion Event Naming: Next, specify the name of the conversion event as it is defined in your Google Analytics 4 account. This step is crucial for aligning the data from your ad channels with the data reported by GA4.
Discrepancy Analysis Report: The core component of this template is the discrepancy report. Pick a date range for the analysis and get a report that measures and displays the discrepancies between conversions reported by your ad channels and those attributed by GA4.
Once your accounts are connected, the template will automatically fetch the necessary data and generate a discrepancy report. This automated process saves time and reduces the risk of manual errors.
CTA: Use this template now!
Template 8: Facebook Ads Conversion Discrepancies Report
The Facebook Ads Conversion Discrepancies Report template is a powerful tool to help marketers and data analysts streamline their advertising performance analysis. This dashboard compares the conversion data from your ad channels (Facebook Ads) with the conversions tracked by Google Analytics 4. By identifying discrepancies between these platforms, you can make data-driven decisions to enhance your marketing strategies and boost your ROI.
Components of the Template
Google Analytics UTM Tracking: To start, input the UTMs you use for your Facebook Ads campaigns into the provided table. This will ensure accurate tracking and comparison of your ad performance data.
GA4 Conversion Event Naming: Next, specify the name of the conversion event as it is defined in your Google Analytics 4 account. This step is crucial for aligning the data from your ad channels with the data reported by GA4.
Discrepancy Analysis Report: The core component of this template is the discrepancy report. Pick a date range for the analysis and get a report that measures and displays the discrepancies between conversions reported by your ad channels and those attributed by GA4.
Once your accounts are connected, the template will automatically fetch the necessary data and generate a discrepancy report. This automated process saves time and reduces the risk of manual errors.
Level up your performance marketing game
With Rows, you import live data from ads platforms, automate analysis with AI and build dashboards in minutes.
Explore Templates
How Can You Customize PPC Report Templates for Your Specific Needs?
While pre-designed PPC report templates offer a great starting point, depending on them alone is insufficient. By tailoring these templates, you can create pay-per-click reports that present data effectively and resonate with your audience.
Whether adjusting color schemes to match your brand, adding custom metrics, or restructuring the layout, personalization ensures that your PPC reports accurately reflect your unique campaign strategies and goals.
Steps to Customize Your PPC Report Template
Different businesses, different PPC campaign goals, and different KPIs. This means reporting template customization varies, from metrics and formatting to frequency for PPC reports.
So, before you hop on another customization spree, ensure that you've Identified and mapped out all the ingredients that must be included in your PPC report.
Additionally, review the default structure of the PPC report template and find out if it aligns with your needs.
It's not hard to customize our templates.
Most of the above templates rely on Data Tables, a specific type of table in Rows that is synced with an external data source (e.g. Google Ads, GA4, Facebook Ads, ...) to provide you with always up-to-date data
To customize templates on Rows, follow these steps below:
Step 1: Go to the source logo in the top right corner of your table. A sub menu will open with three options:
Data Source, to edit what data is included in your table
Automation, to modify or setup a automated updated
Columns & layout, to show/hide columns and set up a vertical/horizontal layout.

Step 2: Click 'Data Source'
A panel will open on the right end side of, and you will have the chance of changing the date range, metrics, dimensions or filter used to fetch and display your data.

Step 3: Visualize data
Create custom charts and graphs to ensure clarity. You can edit pre-designed charts on our templates. You must click the “three dots” at the top of the chart you want to edit.

Step 4: Brand your report.
Incorporate your brand elements into the report template, from color codes to brand name and style.

Tools for Enhancing PPC Report Templates
Many specific tools can positively impact your PPC reporting strategy — reduce time spent on charts, fine-tune visual elements, accurately aggregate figures, and more. Below are tools to enhance your report templates:
Spreadsheet add-ons for advanced analytics
Due to numerous metrics and figures, you need spreadsheet add-ons to create effective PPC reports. A spreadsheet software like Rows comes in very handy — Rows is a comprehensive spreadsheet for modern teams that offers better UX for data ingestion and has native AI capabilities (AI analyst, AI-generated subtitles, native AI functions) that Coefficient lacks. The software makes it super easy for you to import data directly from tools like databases and ad platforms to a spreadsheet.
Rows' native View mode (i.e. dashboard mode).
This feature allows you to rearrange and focus on the key data, plus share the any report error proof.
Data visualization tools (e.g., Google Data Studio, Tableau)
Google Data Studio (Looker ) is good for creating interactive dashboards with real-time data integration from sources like Google Ads and Analytics. Its user-friendly interface offers drag-and-drop functionality for custom report building.
Design software for visual enhancements (e.g., Canva, Adobe Creative Suite).
Design tools like Canva allow non-designers to create professional-looking infographics, charts, and report layouts using pre-made templates tailored for marketing reports.
How Can You Automate Your PPC Reporting Process?
Automating your PPC reporting process can save you time. By leveraging automation tools and techniques, you can create dynamic PPC reports that update in real time, providing you and your stakeholders with the most current campaign performance data. From setting up automated data pulls to creating scheduled report distributions, automation empowers you to focus more on strategy and less on manual data compilation.
With Rows, you can automate your PPC reporting process from start to finish. Below are a few features that make Rows vital for automating PPC reporting:
Data aggregation
For the context of this piece, you can easily integrate data from your Google Ad Analytics dashboard to your spreadsheet table in Rows.
Additionally, you can aggregate live data from 50+ sources in a very simple manner, thanks to built-in data integrations in various domains:
Marketing: GA4, GSC, Facebook, Instagram, TikTok, etc
Productivity software: OpenAI, Notion, Slack, Email, Translate.
Data Warehouse: MySQL, BigQuery, PostgreSQL, Snowflake, Amazon Redshift
And many more.
AI-powered automation
With the AI Analyst, you can ask AI to analyze, summarize, transform, and enrich your analysis. Click on the "AI Analyst“ ✨ icon, at the top right corner of any table.
A chat interface will open on the right: you can ask a broad range of questions, from basic spreadsheet commands - plotting a chart or adding or formatting columns - to more complex tasks, such as slicing, pivoting, or computing metrics about your data.
For example, given a dataset with daily revenue and costs of various marketing campaigns, you can ask the Analyst to add a column with the profit margin. Watch the video below:
In addition, our AI Analyst is instructed to use our native OpenAI functions to perform data enrichment or extraction tasks.
For example, you can ask the AI analyst to run a sentiment analysis on a column with product reviews, or add a column that categorizes addresses into regions, see below:
Want to know more about how our Analyst works? Check out our guide or watch our demo.
Level up your performance marketing game
With Rows, you import live data from ads platforms, automate analysis with AI and build dashboards in minutes.
Explore Templates
What Future Trends Will Shape PPC Reporting in 2025 and Beyond?
As we look toward the future of pay-per-click advertising, reporting techniques and templates are evolving to meet new challenges and opportunities. In 2025 and beyond, we can expect significant shifts in how PPC professionals analyze and present campaign data. From integrating artificial intelligence for predictive analytics to advanced data visualization techniques, the landscape of PPC reporting is set to become more sophisticated and insightful.
1. AI and machine learning are going to be game-changers.
“The landscape of paid advertising has shifted dramatically, propelled by the capabilities of AI-driven solutions. Advertisers are embracing AI-powered tools and platforms that analyze vast datasets in real-time, extracting insights and optimizing campaigns for maximum impact”, says Amish Adodra, Head of Digital Specialist at Brightbid in ,a report tagged PPC trends in 2024 by Searchenginejournal
Additionally, running social media ads with various creatives can be highly effective. Platforms like Meta leverage AI to serve your target audience with the most relevant creative content, increasing the likelihood of achieving your campaign optimization goals.
2. Gamification and creation of interactive elements in reports
Interactive reports are on the horizon, letting us play around with different scenarios in real time. It's like having a crystal ball for your campaigns.
For example, imagine if you could Zoom in and out of campaign histories with animated visualizations showing how changes impacted performance over time. It's like a time machine for your data.
3. Cross-channel attribution is about to level up
We'll finally get a clear picture of how customers bounce between platforms before converting. It's going to be a real eye-opener.
4. Privacy is the new black.
With the increased importance of personalization, marketers must prioritize user data privacy and comply with relevant regulations, such as the General Data Protection Regulation (GDPR).
This includes obtaining user consent, being accountable, and ensuring data security. With cookies on their way out, we'll need to get creative about tracking while keeping user data on lockdown. It's a challenge but will push us to be more innovative.
Read more: Best 15 Free Google Sheets Dashboard Templates [2025].
Conclusion
In conclusion, mastering the art of PPC reporting is essential for any digital marketer looking to showcase the value of their pay-per-click campaigns.
The 8 free PPC report templates we've explored offer a solid foundation for creating impactful, data-driven reports that resonate with clients and stakeholders.
By customizing these templates, following best practices, and staying ahead of emerging trends, you can elevate your PPC reporting game and drive better campaign results.
Remember, effective reporting is not just about presenting data—it's about telling a compelling story that informs strategy and demonstrates the tangible benefits of your PPC efforts. As you implement these templates and techniques, you'll be well-equipped to navigate the ever-evolving landscape of PPC advertising.
Want to learn more about Rows today? Check out our blog section.