How to create a Google Analytics 4 (GA4) dashboard in Notion

Notion is a versatile project management tool designed for both individuals and teams, offering a wide range of functionalities. It is widely favored by thousands of users for organizing day-to-day tasks efficiently. One of its key strengths lies in its flexibility, allowing it to serve as a company wiki, a CRM for Sales, a platform for generating marketing reports, and much more.
Increasingly, teams are recognizing the value of using Notion for sharing marketing reports with their colleagues. In this article we’ll share how to set up Google Analytics 4 dashboards within Notion, offering an easy, automated way to monitoring and analyzing your website performance.
We’ll build the dashboard in two steps:
Create the report in Rows, connected to GA4.
Embed the charts and tables in Notion.
Let’s dive in:
Part 1 : Create the GA4 report in Rows
1. Go to Rows.com
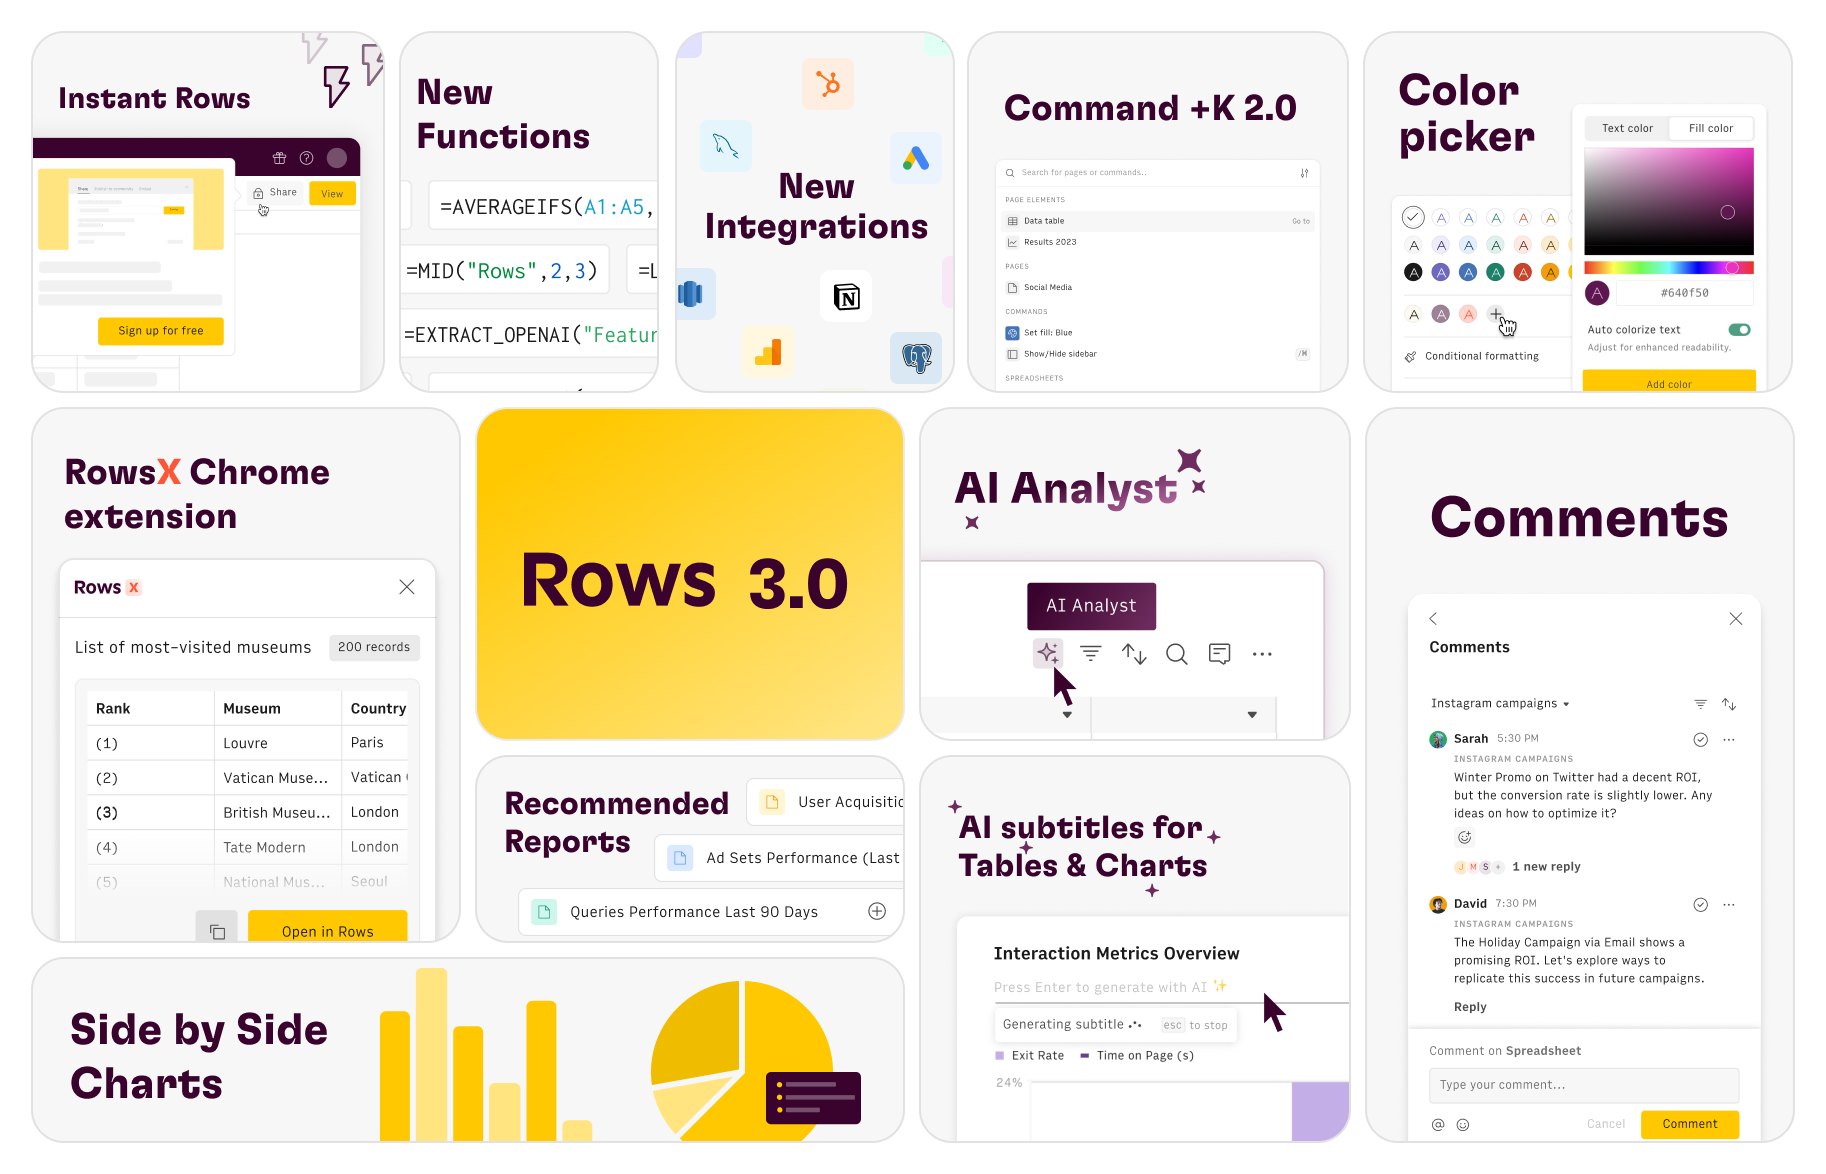
Rows is a web application for creating modern, beautiful spreadsheets. It combines a modern spreadsheet editor, data integrations (e.g. Social media, Google Analytics, Salesforce, Stripe) and a novel sharing experience that turns any spreadsheet into a website in one-click.
 Rows is a modern spreadsheet
Follow the steps below to create your first spreadsheet:
If you haven't signed up for Rows, do that here and login to your account.
Create a spreadsheet. Do this by clicking on the “Create Spreadsheet” button.
2. Connect the Google Analytics 4 integration
Now it’s time to connect Google Analytics 4 to Rows to import your data to the spreadsheet.
To do this:
Click on the Data Actions option located in the top format bar of the spreadsheet.
On the search panel, look for Google Analytics 4
Select the Get Google Analytics 4 metrics action
Click Connect to finalize the integration. You’ll be directed to a new browser tab to complete the authentication with your Google Analytics 4 data.
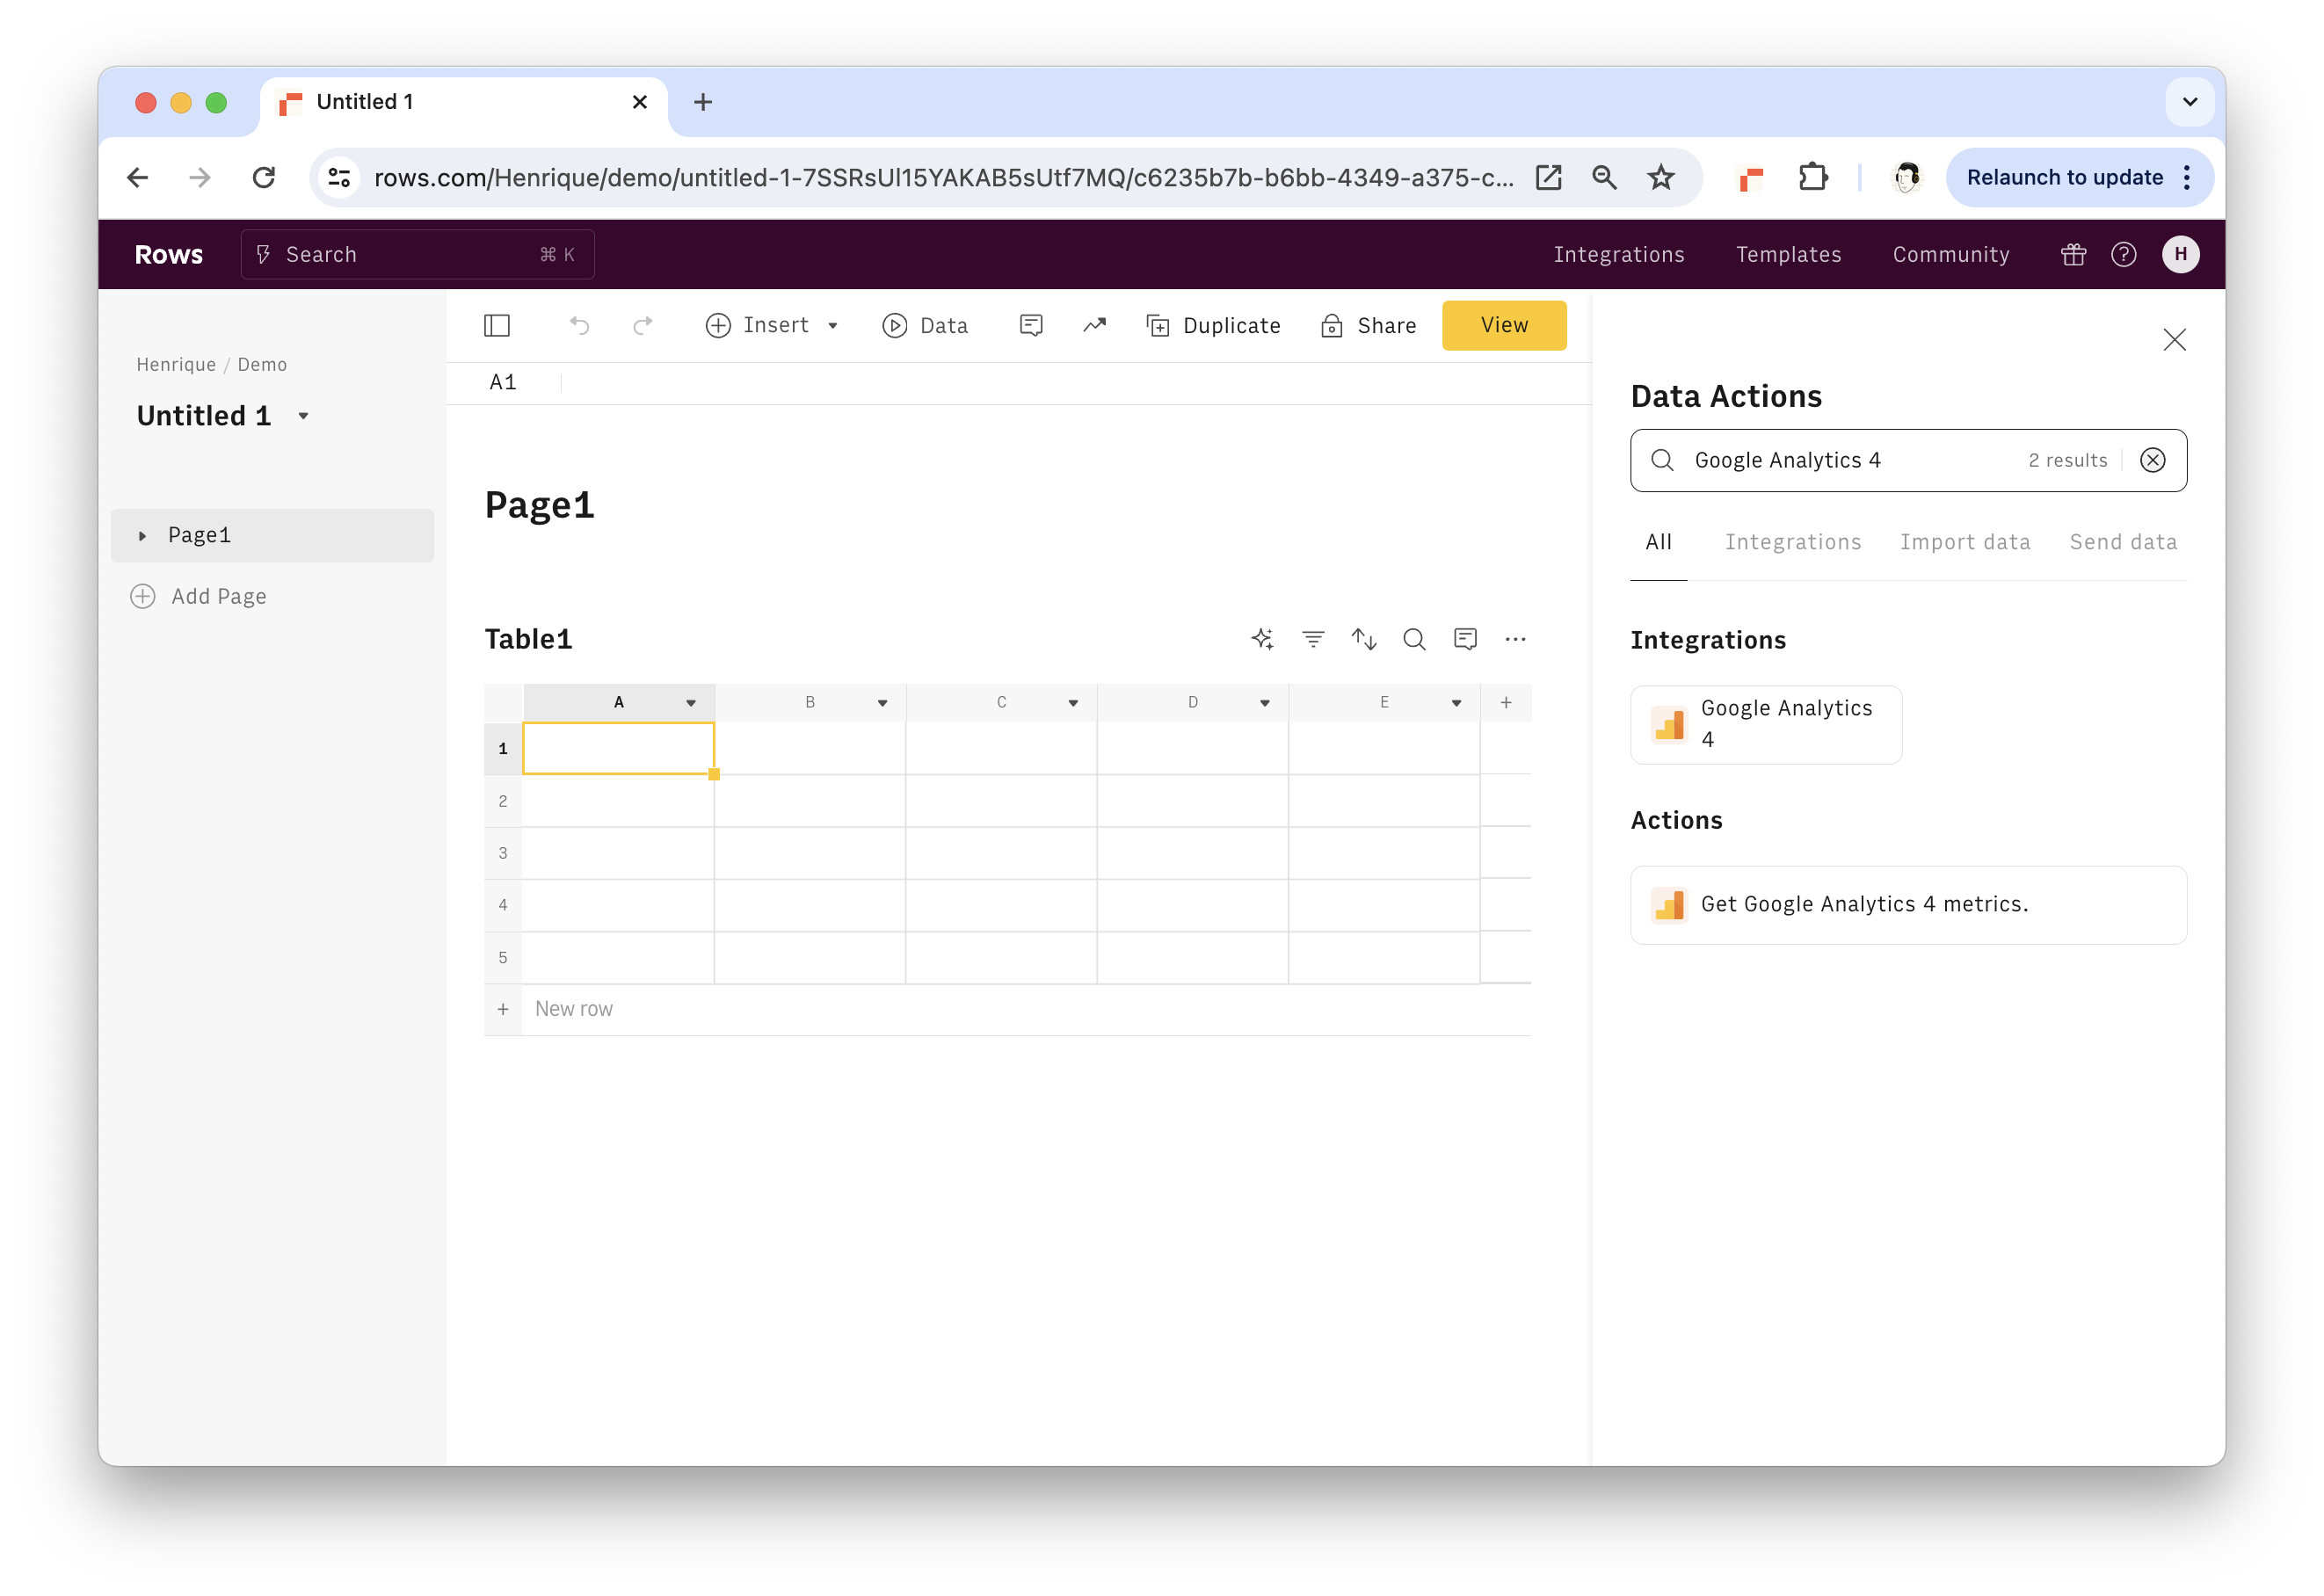 You can find the Google Analytics 4 integration in the Data Actions panel
If you don’t have a Google Analytics 4 property install, follow the official Google Guide to add it to your website.
3. Create your report
Once the integration is connected, you can easily build your report in Rows. There are two ways of doing it:
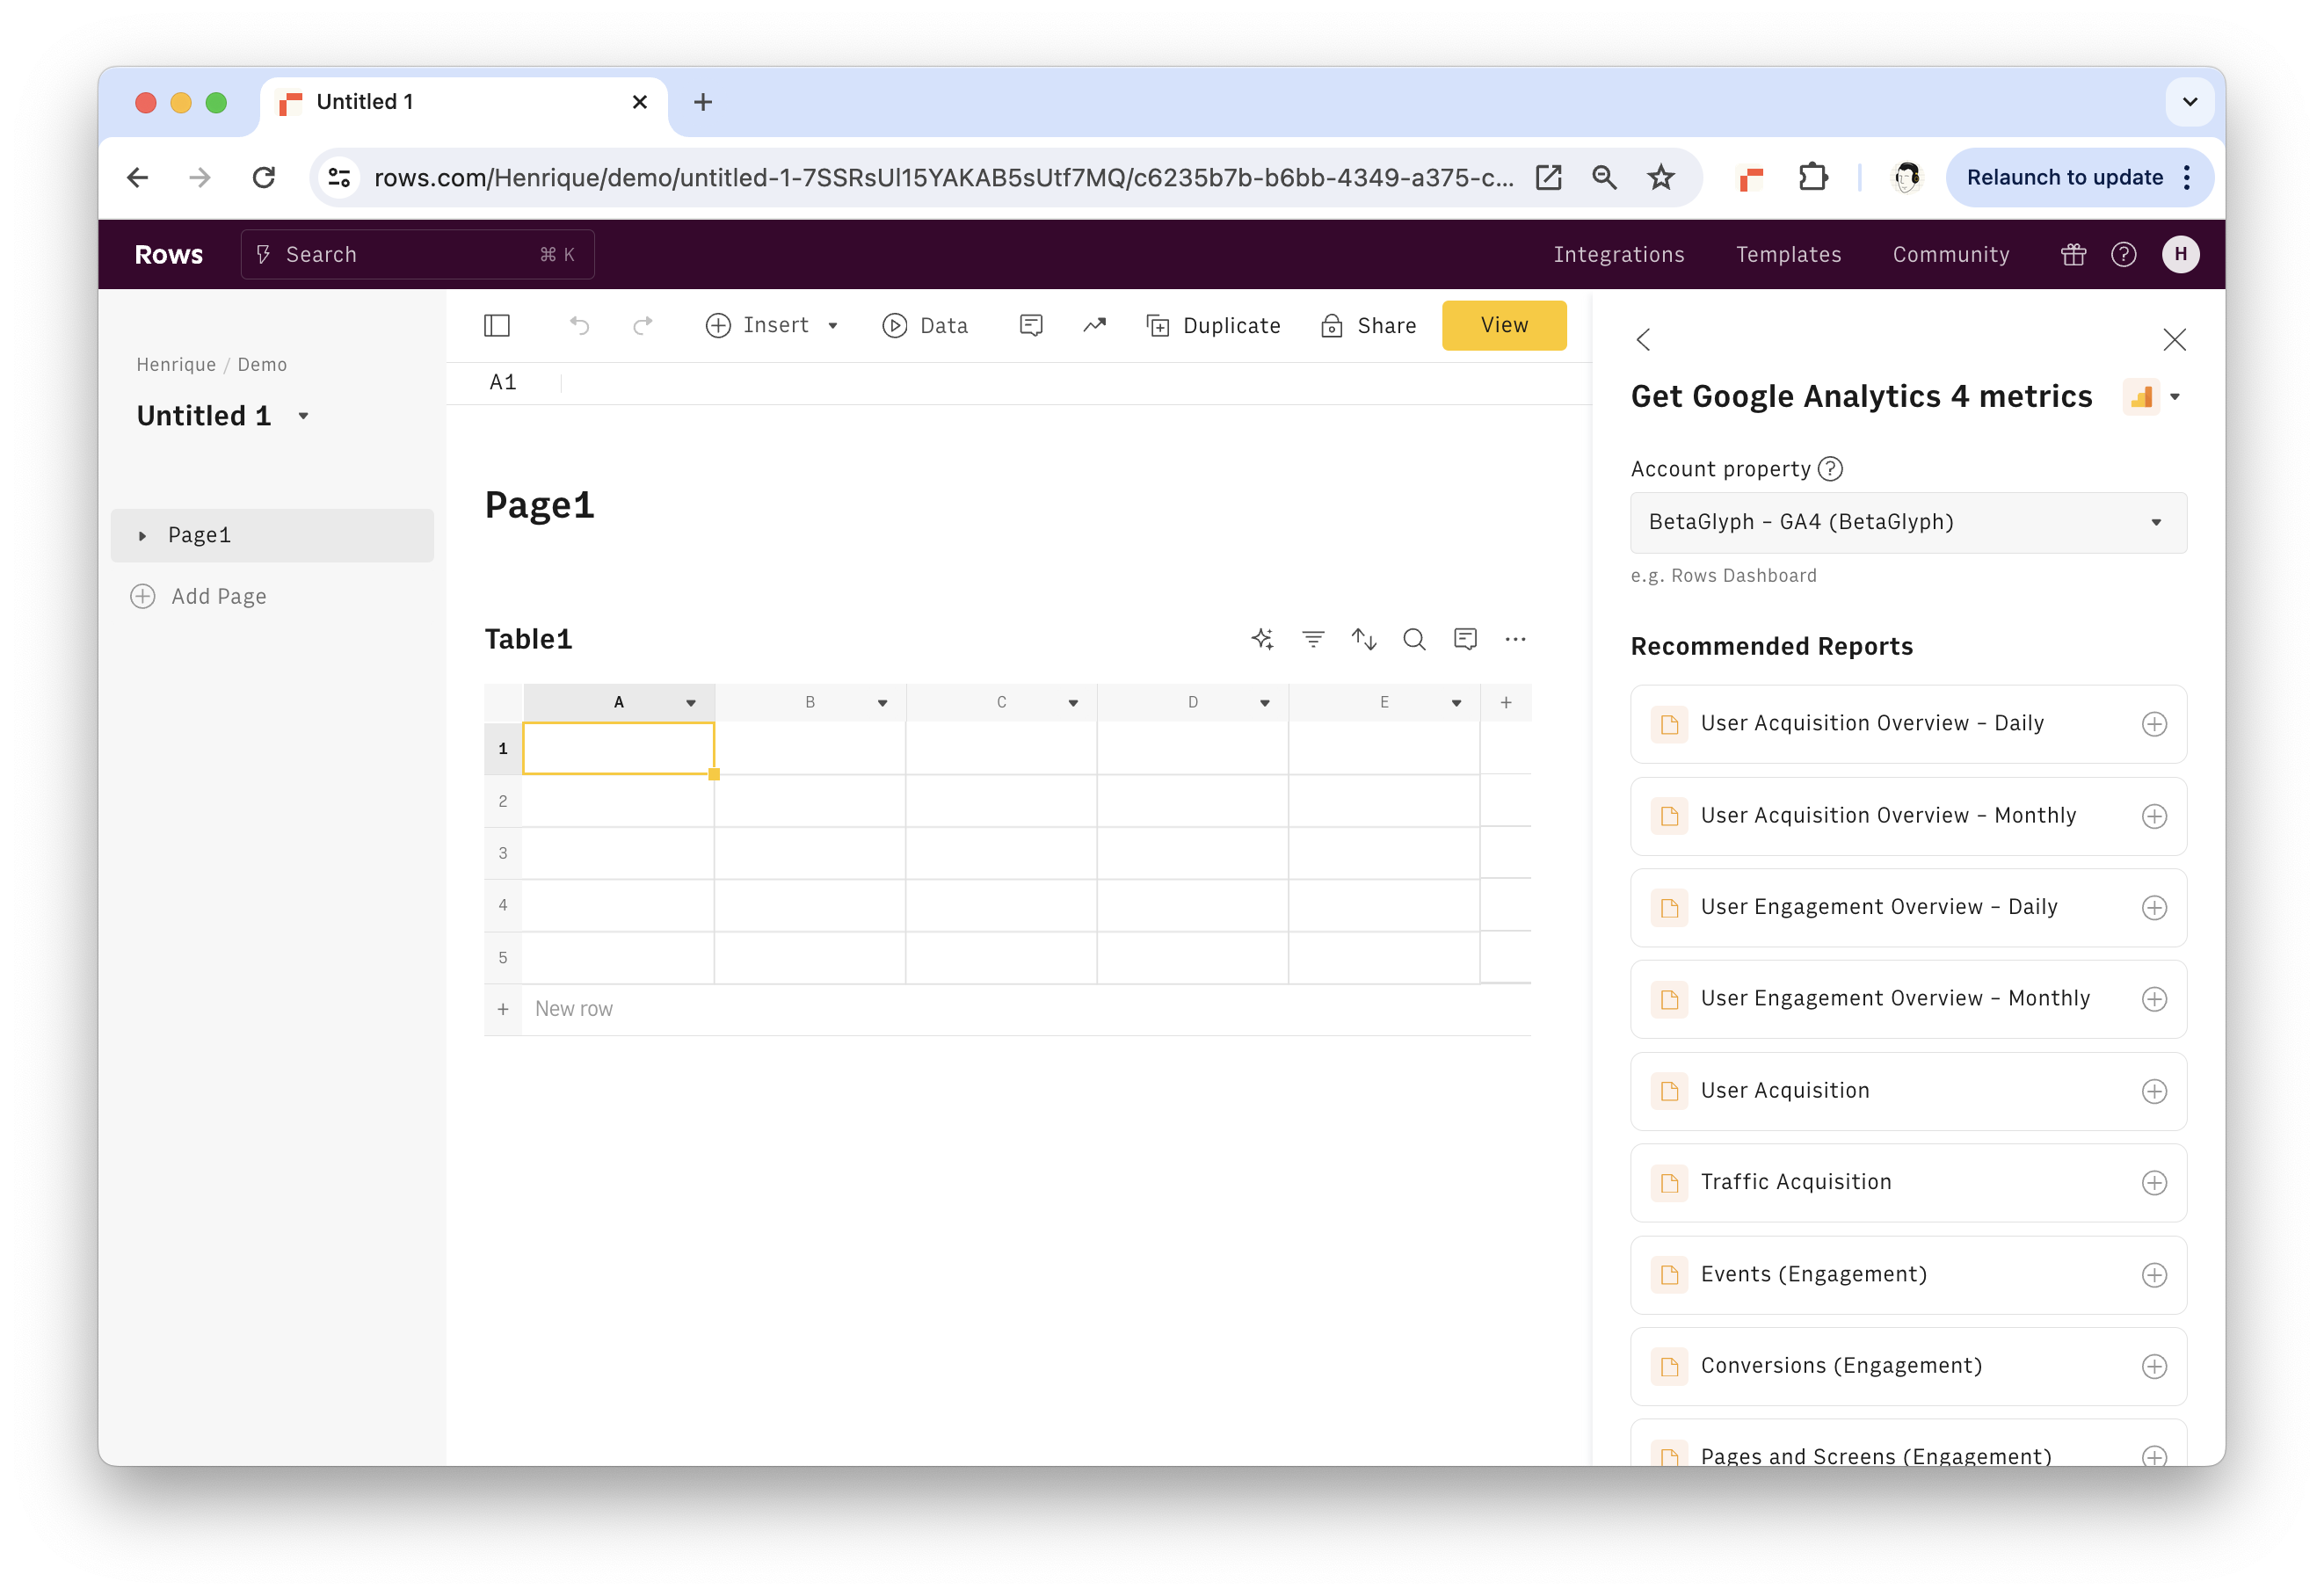 The GA-4 integration comes with a list of pre-set reports
Recommended Reports: Rows offers a set of +10 recommended reports that automatically import key GA4 reports with pre-set metrics to your spreadsheet that mimic the standard reports you see in the GA4 website. These include:
User Acquisition Overview
User Engagement Overview
Traffic Acquisition
Events Overviews
Pages and Screen reports
Audience Reports
(and more)
You can customize the report by going to the Edit Data Table icon on the top right corner of the table. Here you can:
Add/Remove metrics from the report by going to the Edit Action panel.
Schedule an automatic data refresh for the report.
With a scheduled refresh the report will update automatically every day (or hour, or minute, or at specific times) without any manual work.
 How to import and edit a Data Table
Custom report: You can also build your own custom data requests. First, select “Create your custom data request” at the bottom of the GA4 panel. Then, configure the report with the following parameters:
Account Property: The GA4 account you want to use.
Date range: The date range of the report. By default it assumes the last 30 days.
Metrics: One or more metrics. (e.g. "totalUsers","sessions"). Use the metrics selector to pick the metrics to add to the report. For a complete list of possible metrics, see this Google documentation.
Dimensions: The dimensions define how you want to breakdown the report (split by). Examples include Date, Session default channel group or Browser. Use the metrics selector to pick one (or multiple) metrics to add to the report.
Filter: You can specify filters for the report, by picking a filter value(the dimension to filter - e.g. Page path), a type (e.g. contains) and a value (.e.g ‘/blog’).
Once you’ve configured the data request, click Get data to import it. Once the data is imported, click Data Table to add it to the spreadsheet.
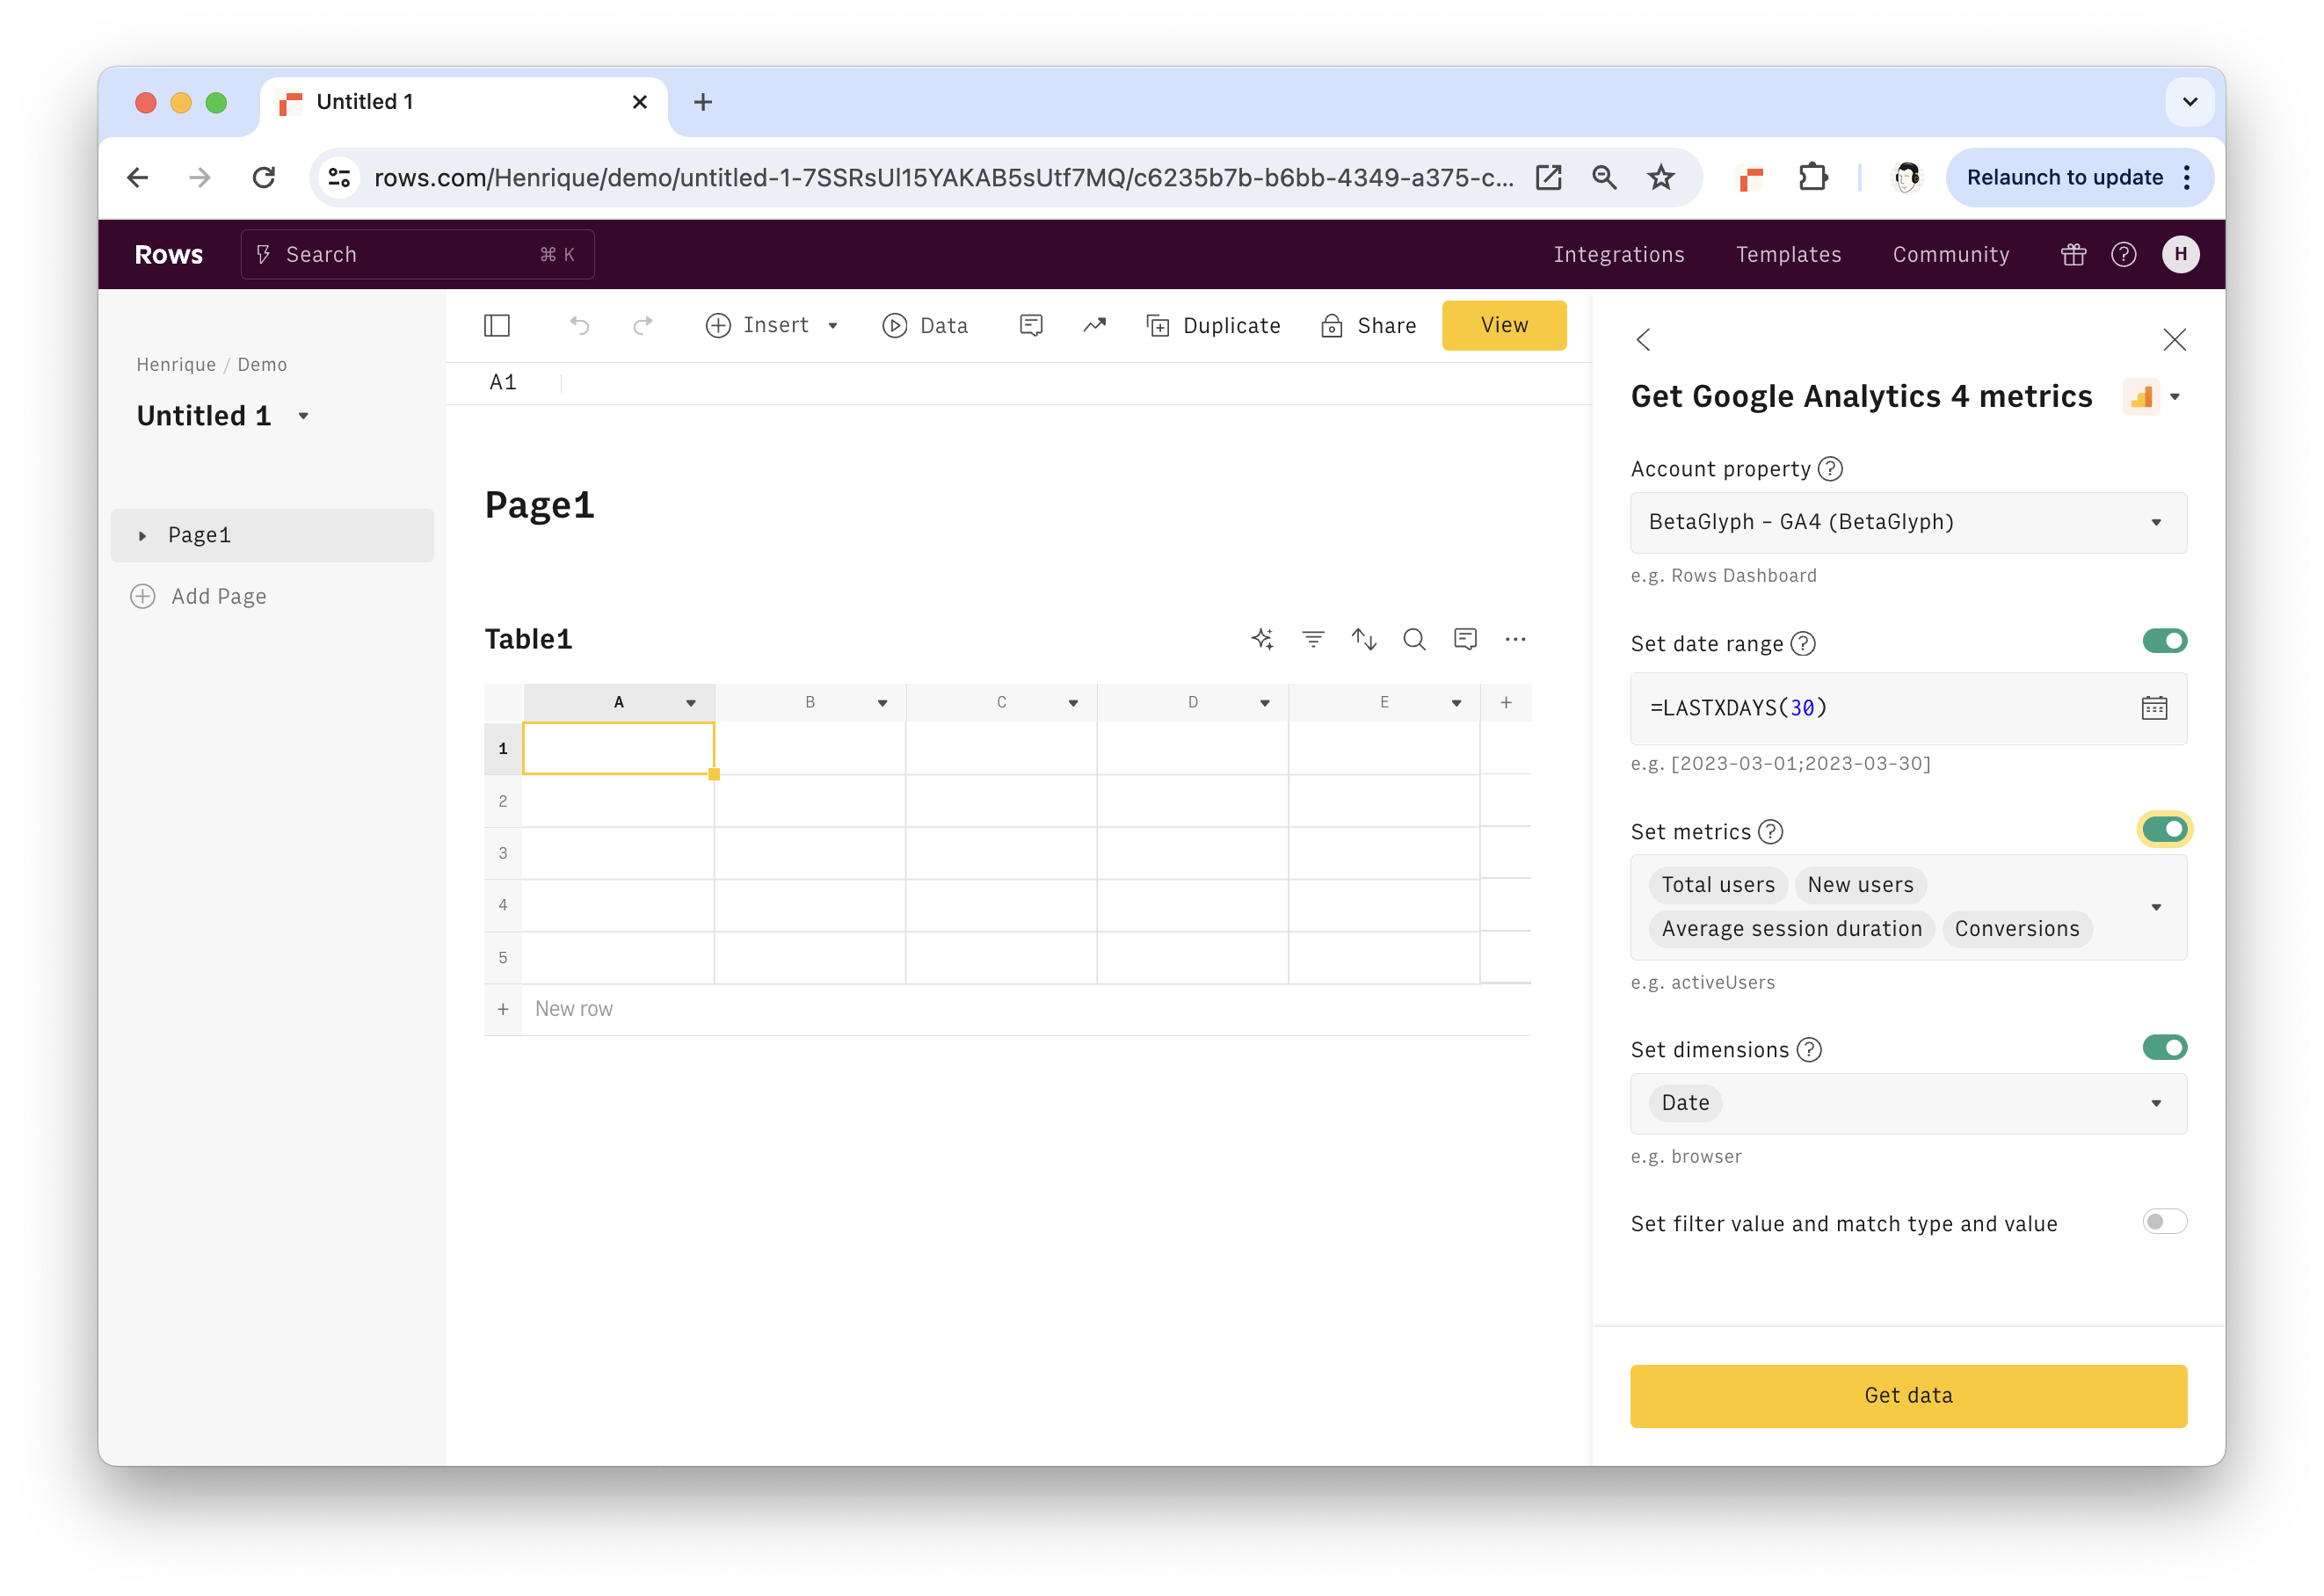 Configure Custom Reports from GA-4
You can add multiple reports to the same spreadsheet, and organize it into different Pages, use Pivot Tables and the AI Analyst✨ to transform the data and add different types of charts to complete your Report.
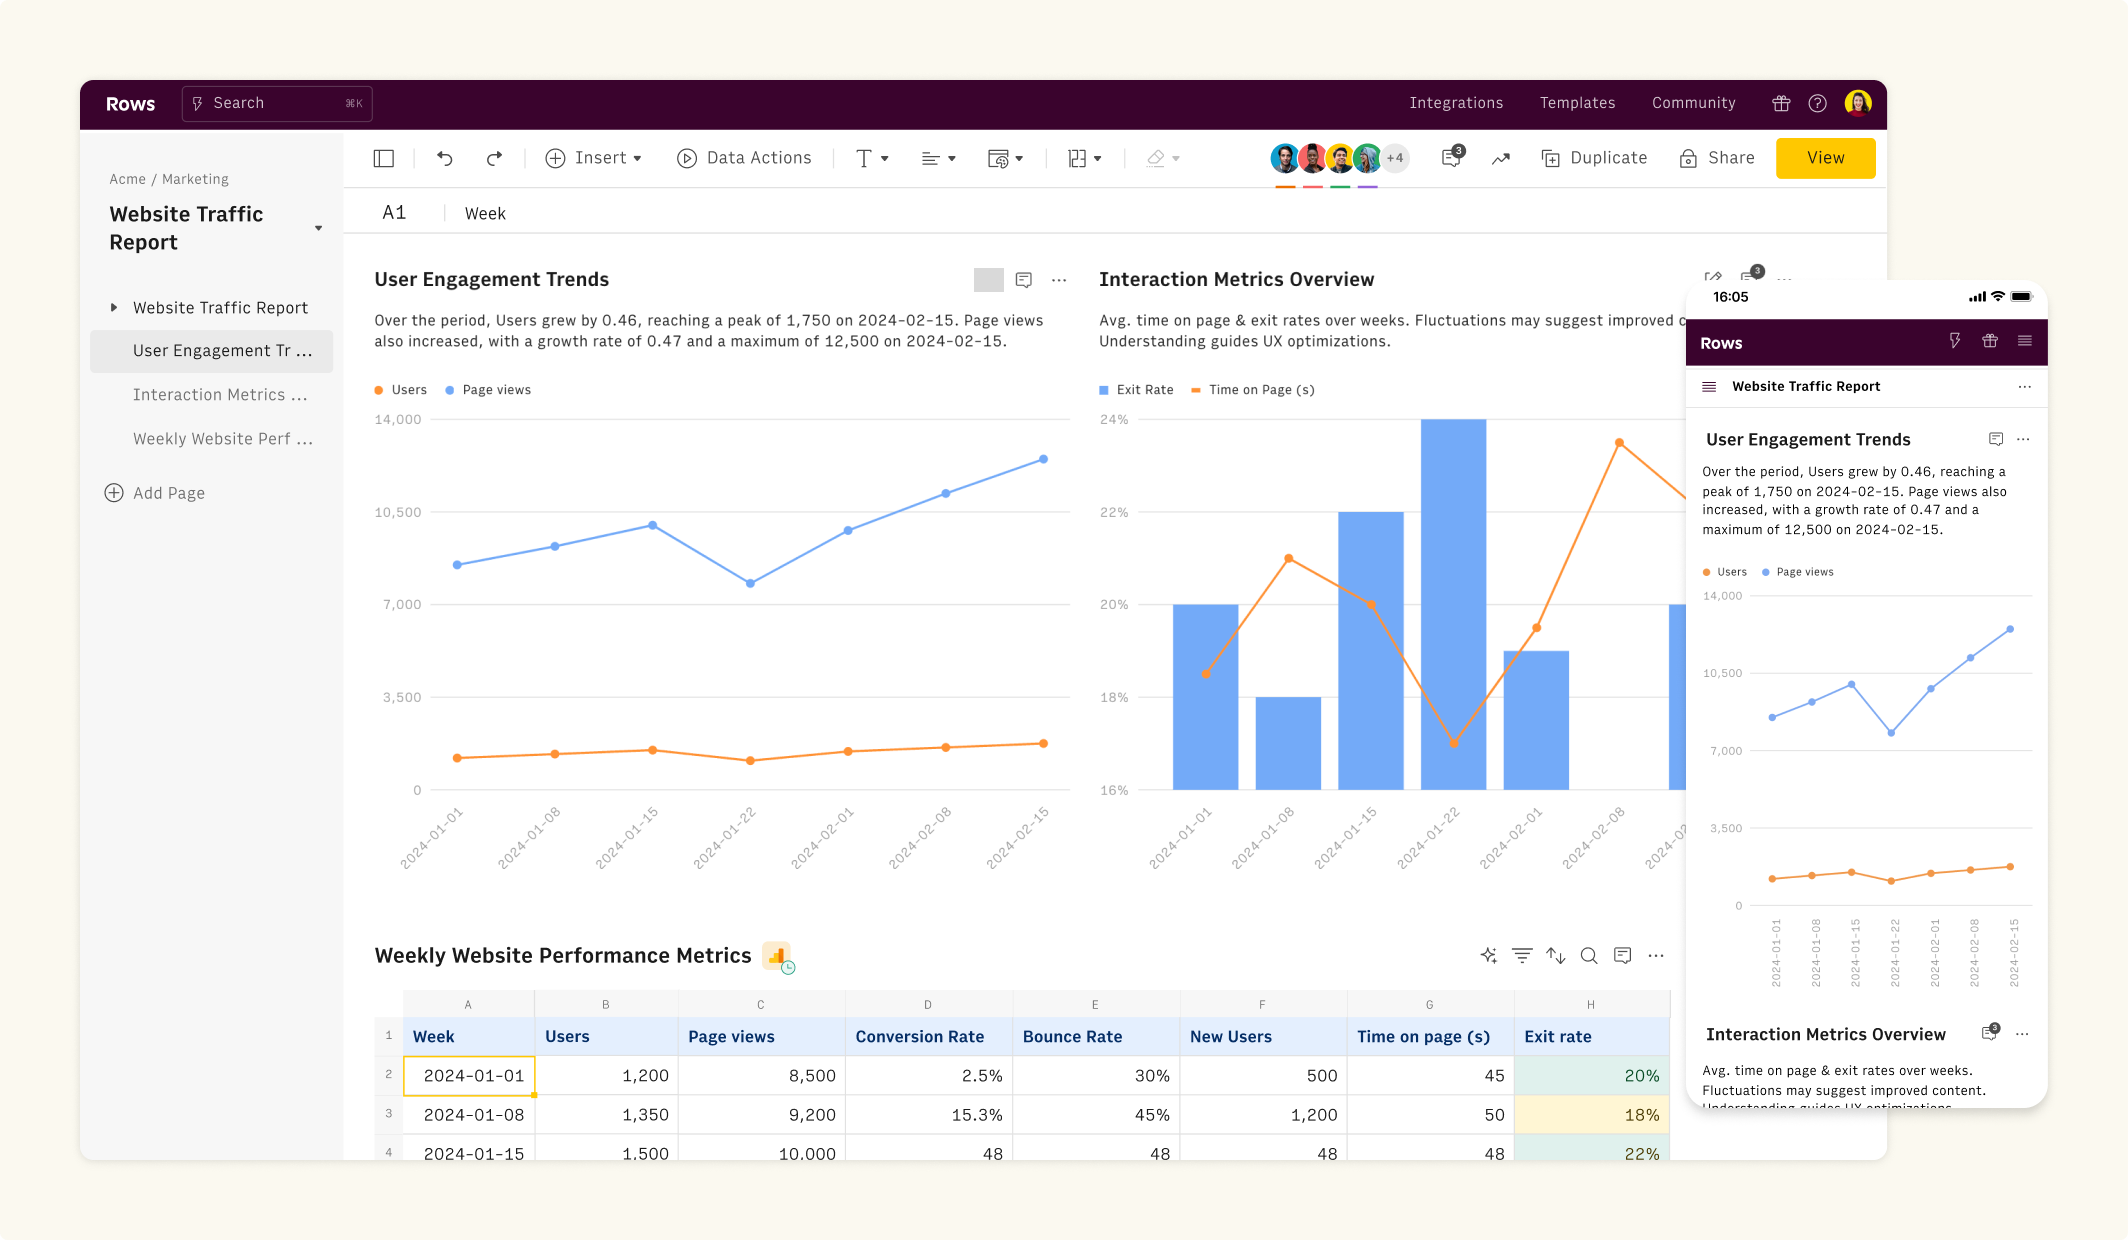
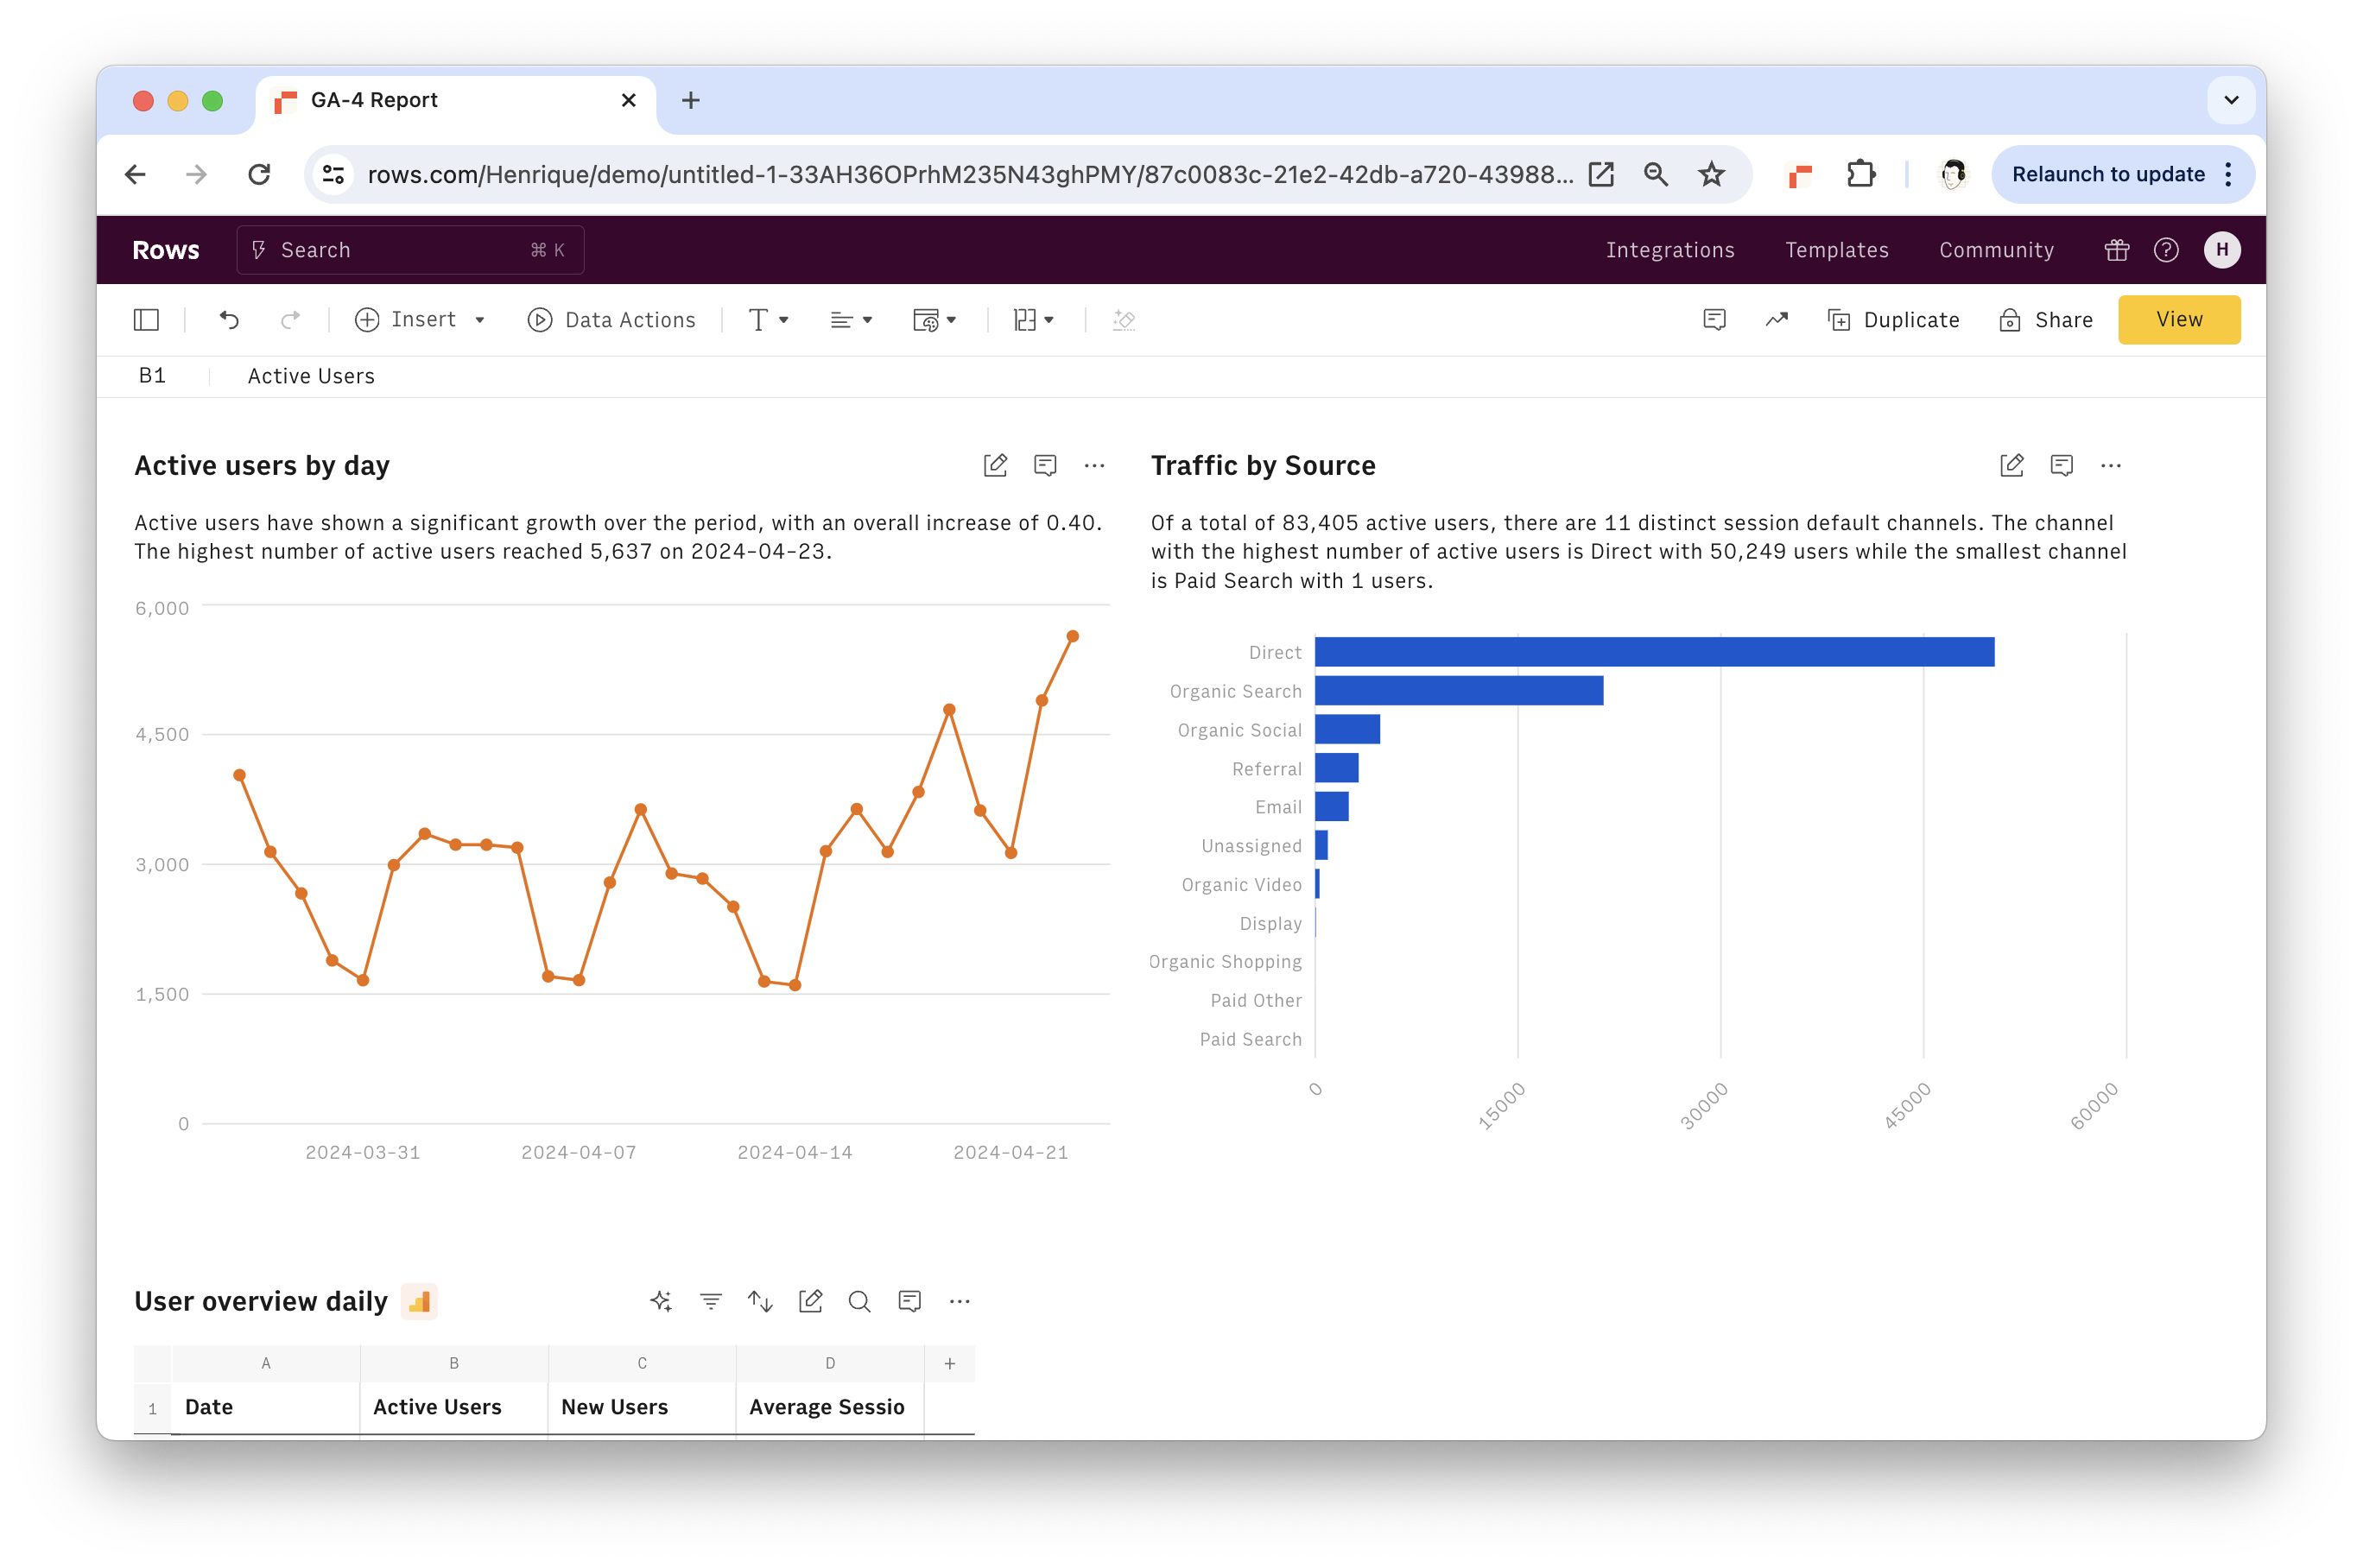 GA-4 dashboard example in Rows
Part 2 : Embed the Report in Notion
Now that your GA4 report is done, it’s time to embed it into Notion. You can embed any element from a spreadsheet - a Table, Chart, or Form - and have a live connection between your Notion doc and Rows spreadsheet.
To embed each element from your spreadsheet in Notion, follow these steps:
Choose Embed in settings menu located in the right-hand corner of the element you want to embed
Click the Share privately toggle.
Click Copy url
Paste the link on a Notion doc and click to Create embed
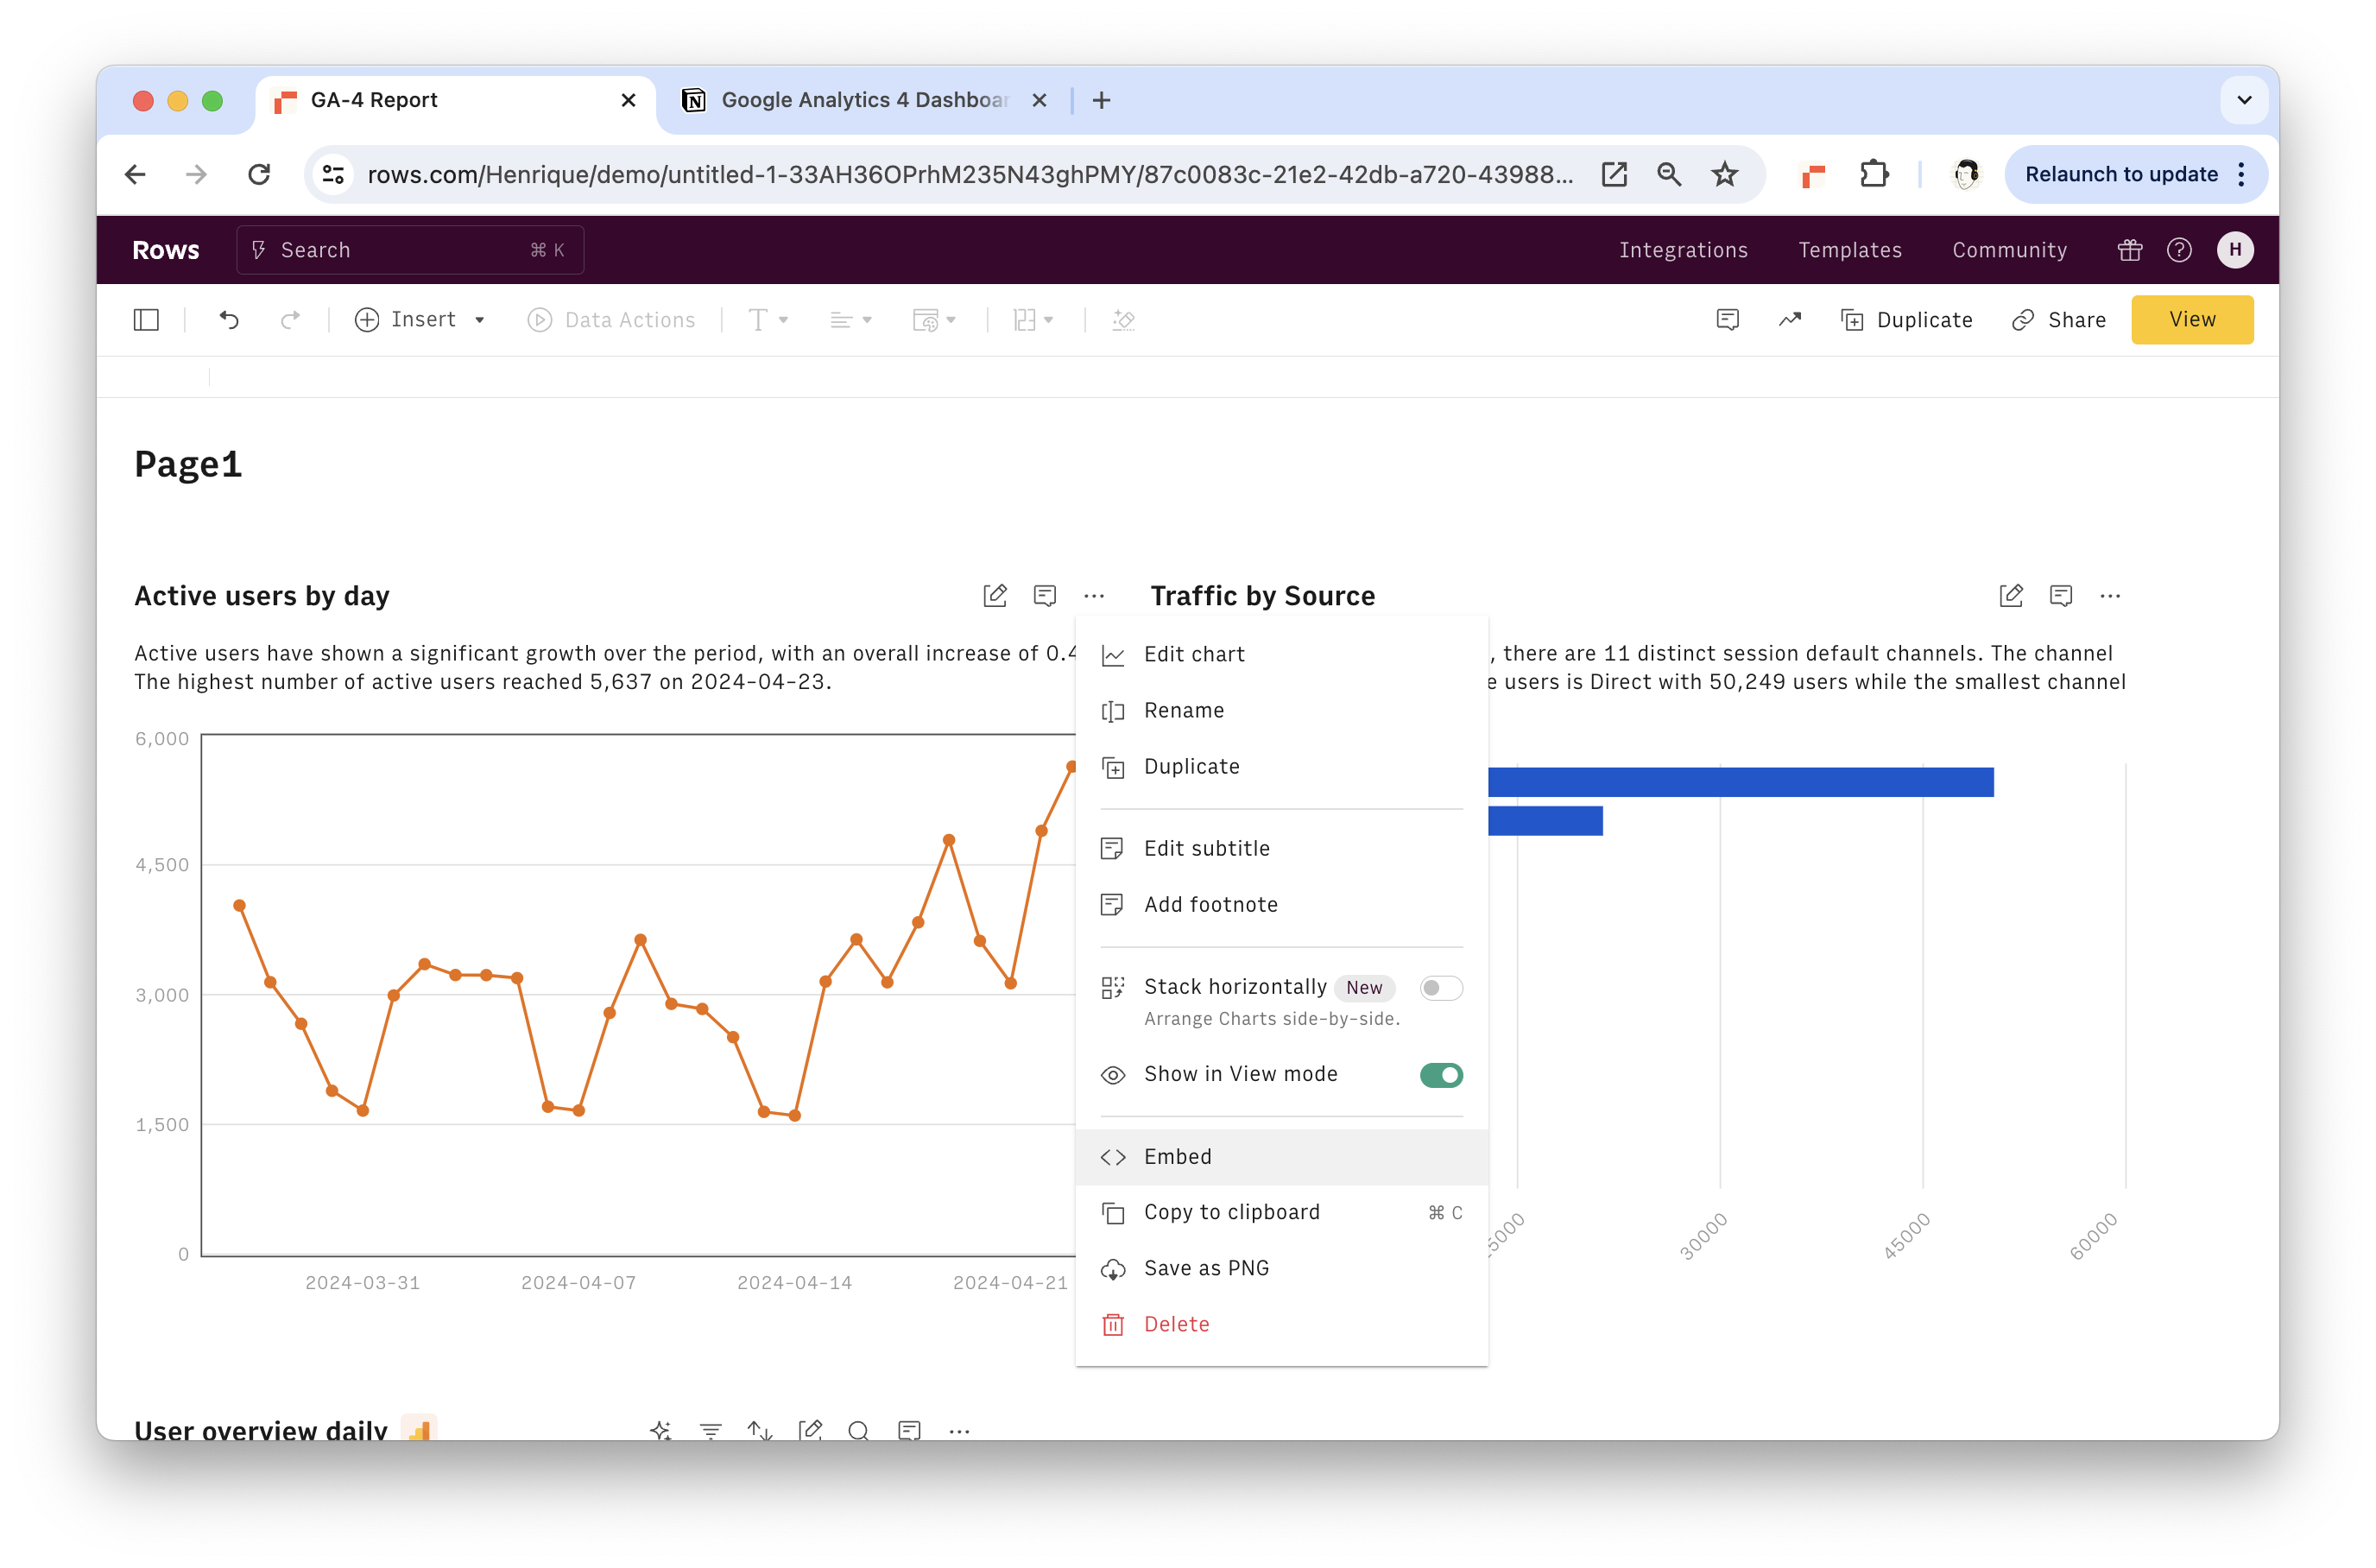 Use Embed to add each element to Notion
Once all the elements are embedded, you can drag each element to your desired location and customize the look and feel of your dashboard.
 The GA-4 dashboard in Notion
Extra : Get started with these 5 GA4 templates
At Rows we created a several Google Analytics 4 templates to help you get started. You can access them in the Templates library and install them in your Rows account for free.
The following is a short summary of each:
Google Analytics 4 Content Group Report
Quickly create content groups by URL keywords to see how those pages perform with specific user groups and demographics.
→ Install the template
Google Analytics 4 Engagement Rate Report
Chart and compare which pages had the highest number of site visitors who stayed for 10+ seconds or triggered a conversion event.
→ Install the template
Google Analytics 4 Landing Page Report
Find your website’s top landing pages, see which sites referred the most traffic, and analyze which pages and sources received the most pageviews, had the lowest bounce rate, or saw the most engaged audience.
→ Install the template
Google Analytics 4 Mobile vs Desktop Report
Find out how much of your site’s traffic comes from iPhones and Android devices versus from desktops and laptop computers—along with which web browser your audience uses and their screen size in a Google Analytics tech report.
→ Install the template
Google Analytics 4 SEO Backlink Checker
Get the list of backlinks sending the most referral traffic to your website and analyze which incoming links send the most active and engaged users.
→ Install the template
Integrate Notion databases with Rows
If you’re looking for a deeper integration between your Notion databases and a spreadsheet, Rows offers a native integration with Notion.
You can import your Notion databases directly to Rows and use the spreadsheet interface to add beautiful, flexible charts and reports to your Notion pages.
All you’ll need is:
An active Notion account with one or more databases.
A Rows.com account.
Appropriate permissions to integrate third-party apps within Notion
See how to harness the power of Notion in to Rows in our help guide.
 Sync your Notion databases with Rows in a few clicks
Automate Marketing Reporting with Rows
With the flexibility of Notion and the functionalities of Rows, you can seamlessly integrate GA-4 reports into your workflow. By embedding elements from your spreadsheet into Notion, you can customize your dashboard to suit your needs.
Explore the various GA-4 templates available in Rows' library to kickstart your reporting journey. With this guide, you can streamline your marketing reporting process and optimize your website's performance effectively.