Airtable vs Excel vs Rows: Which One is Better in 2026? (Updated with benchmark)

Airtable, Excel, and Rows are all solid platforms that let you ingest data from multiple sources, manipulate and export data, and help you visualize better.
But how do you choose the best one for your needs?
Your ideal choice must be based on affordability, integration, and innovation.
To help you make an informed decision, I compared Airtable and Excel with our tool – Rows.
Here’s what I found:
Airtable is a great tool if your priority is to build databases designed to support customizable apps and automations for your data process.
Excel is great if you want to analyze and manipulate mid and large-size datasets and use its AI copilot to carry out complex calculations.
Rows is best if you want to analyze, manipulate and visualize data coming from multiple sources in a sleek, modern way. Rows comes with 50+ data integrations, AI capabilities, and beautiful sharing options.
To arrive at this conclusion, I conducted an in-depth comparison of the tools, including their features, integrations, pricing, and customer reviews.

Your new AI Data Analyst
Extract from PDFs, import your business data, and analyze it using plain language.
Try Rows (no signup)Features - Airtable vs Excel vs Rows
Rows Features
Rows is your new AI Data Analyst. It combines the backbone of a spreadsheet with the power of ChatGPT to to give business people full autonomy over their data. Just ask in plain language and Rows will handle the rest, whether that's spreadsheet operations, data import or transformations, or running Python code to do code-level analyses.
It’s the new way teams at HP, AWS or Taxfix make sense of their data and speed up decision processes.
Let's dive into its features,
AI Analyst
Rows copilot works across four key capabilities:
Spreadsheet-native operations: Standard spreadsheet tasks are supported both as regular commands and via AI —pivots, conditional formatting, new columns, charts—happen through conversation instead of clicking through menus or writing formulas.
Example prompts:
→ "Build a pie chart showing share of profit by product"
→ "Add conditional formatting rule to column D: red if <100, yellow if <150 and green if >150"
Data Ingestion: Pull data directly from documents or connected tools without wrestling with configurations or manual copying-pasting.
Example prompts
→ "Import all transactions from my N26 account and classify them as: marketing, software, travel, other"
→ "Pull keyword data from the last 90 days from Google Search Console"
Multi-step plans: String together multiple dependent steps—build a dashboard, create a calculator from scratch, or execute a series of operations where each step builds on the last.
Example prompts:
→ "Add a column classifying keyword position into brackets: [1-3], [4-10], [10+], then create a pivot showing average CTR by bracket"
→ "Build a simple dashboard showing the performance of sales people in the last quarter"
Code-level analysis: When you need statistical analysis, machine learning, or custom visualizations that go beyond standard charts, Rows can write and execute Python code to get there.
Example prompts:
→ "How does my revenue change if my margin increases by 5%?" (what-if analysis)
→ "How many orders do I need to hit $100k, $500k, and $1M in revenue?" (goal-seek)
→ "Calculate correlation between keyword position and clicks, then show statistical significance"
→ "Run a k-means clustering model to segment customers by purchase behavior and visualize the clusters"
→ "Create a Sankey diagram showing traffic flow from source → landing page → conversion"
Instead of switching between tools or learning specialized syntax, you describe the analysis you want and the AI Analyst figures out how to execute it: it scans your dataset, understands the key variables, and provides what you need.
To access AI in Rows you can either
click on the ✨ icon, at the bottom right corner of your viewport: this will open a chat UI panel that will work across your spreadsheet. You can ask questions in two modes, Build or Chat, based on whether you want to actually creating elements or just have in-line answers.
use the ✨ icon at the top right corner of each element: a contextual menu with a few shortcut will open right away allowing you to perform quick actions like summarizing the content or beautify a table
Watch below side-by-side comparisons with Excel:
Running over 50 prompts on real-world datasets in our benchmark, we found that AI in Excel consistently underperformed across five key dimensions:
Core spreadsheet operations: structuring columns, applying logic across ranges, and keeping spreadsheets clean and traceable.
Accuracy: often giving incorrect or incomplete results, far below competitors
Static output: producing hardcoded numbers, pasted tables, or chart images instead of live, recalculating formulas and linked data.
Advanced analytics: scenario modeling, dataset relationships, clustering, and complex transformations frequently fail or need heavy manual fixes.
Generative requests: Consistently fails at creating predictive or analytical models, even after multiple attempts.
Extract data from documents and images
As mentioned above, Rows can ingest data directly from documents and images—not just as static imports, but as structured, editable tables.
It works with PDFs and multiple image formats (JPEG, PNG, HEIC...)
You can process batches at once rather than uploading files one by one.
All extracted data can get merged into a single table you can immediately work with, stay on separate tables or get appended to an existing one.
You can also add custom extraction instructions to pull exactly what you need. A very common use case is invoices management. By adding the prompt
"Extract date, vendor name, VAT amount, total amount, and description", Rowswill scan all documents and return a consolidated table with those specific fields—no manual data entry, no error, or formatting issues
Instructions can be enhanced automatically and saved for later. Watch the demo below:
What's more? 50+ data integrations
As anticipated above, Rows comes with 50+ built-in data sources integrations in various domains, many of which are supported in the AI Analyst, meaning that you can simply ask AI to pull data from your ideal source and it will take care of the rest.
Example of prompts:
SEO data: "
Pull page data from the last 30 days from Google Search Console, including only pages that contain /blog/"Finance data: "
Pull all transactions from my HSBC account and classify them into: software, marketing, travel expenses, revenue"Marketing data: "
Use GA4 data to rank the top sources of traffic from mobile in Brazil in the last 30 days"
See it in action below:
Here's a division of the built-in integrations in Rows:
Marketing: GA4, GSC, Facebook, Instagram, Tiktok
Finance: Stripe and Plaid (+12,000 supported banks)
Productivity software: OpenAI, Notion, Slack, Email, Translate
Data warehouse: MySQL, BigQuery, PostgreSQL, Snowflake, Amazon Redshift
Discover the full catalog here.
You also have the possibility of creating custom connections via our HTTP functions.
💡 Pro tip: When the tool you’re working with isn’t listed in our catalog, HTTP functions allow you to connect to any RESTful API, GraphQL endpoint, or other HTTP-based data sources, regardless of their structure or authentication methods. On Rows, GET, POST, PUT, and PATCH make the catalog of integrable tools virtually infinite. Try them our in our HTTP tester. Or watch the demo below:
Your new AI Data Analyst
Extract from PDFs, import your business data, and analyze it using plain language.
Try Rows (no signup)Airtable Features
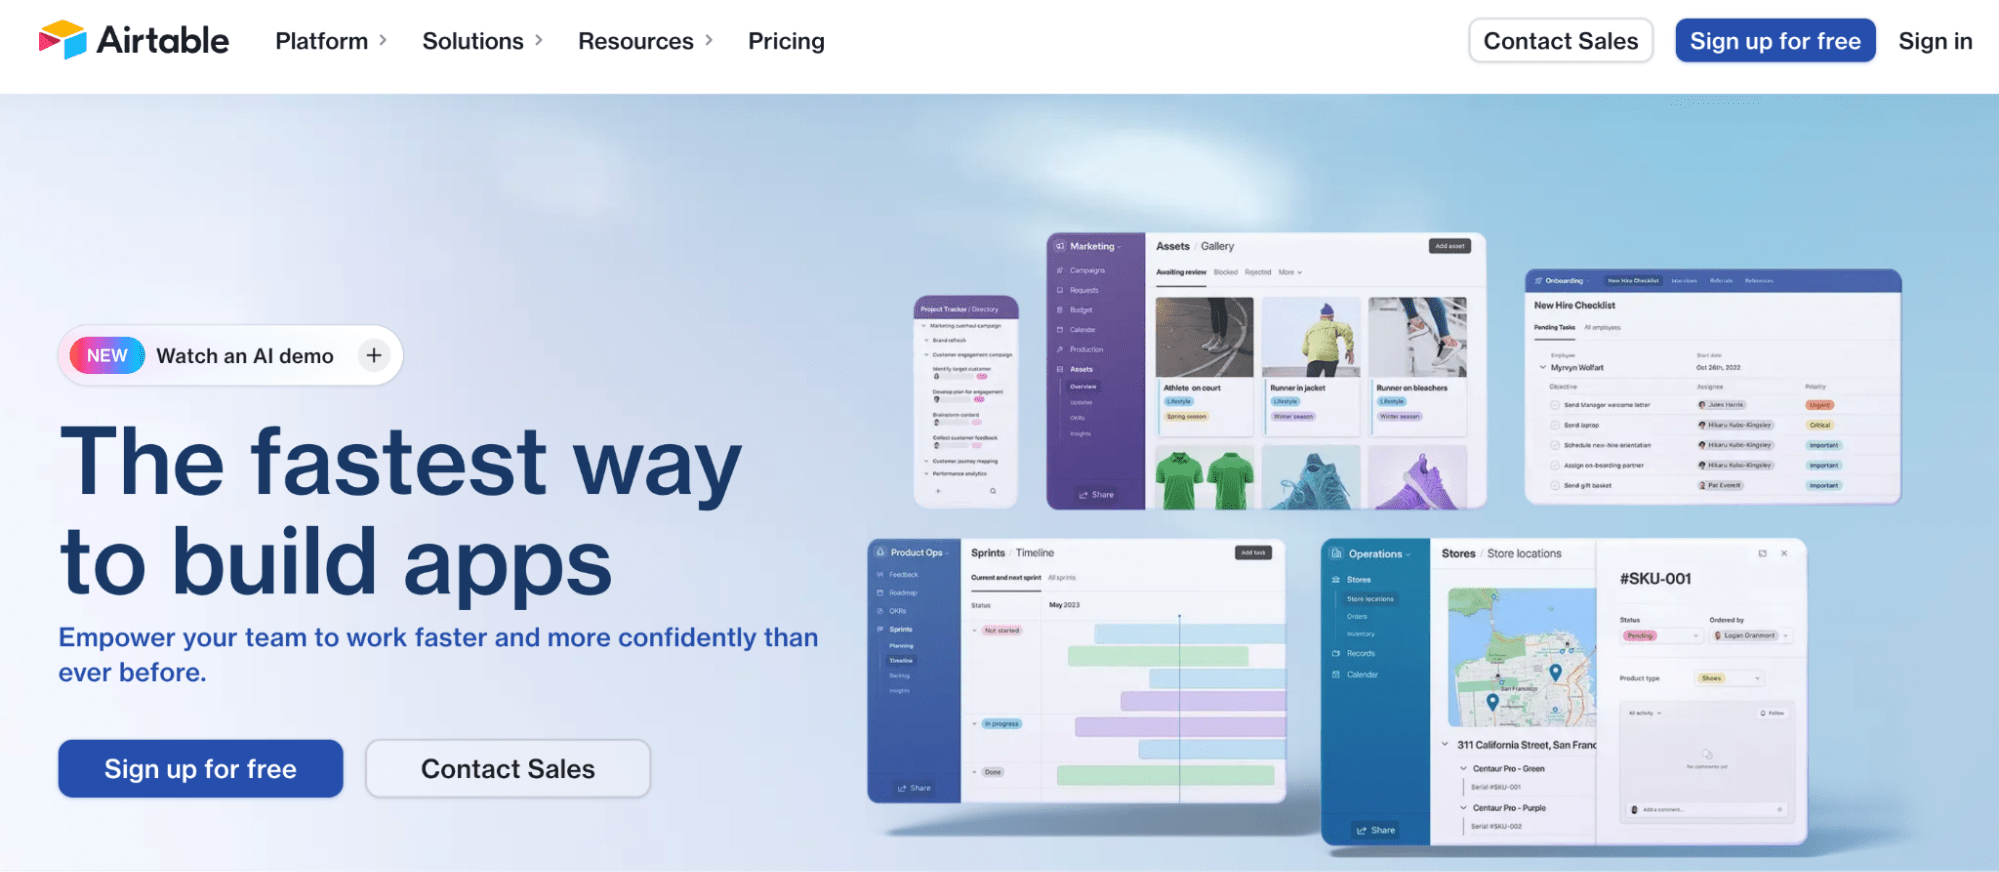
Airtable is a database-oriented software that brings a fresh, user-friendly approach to organizing and viewing data.
Unlike traditional spreadsheet software, Airtable goes beyond grids to offer a dynamic and accessible interface to work with data.
Let's look at Airtable's features.
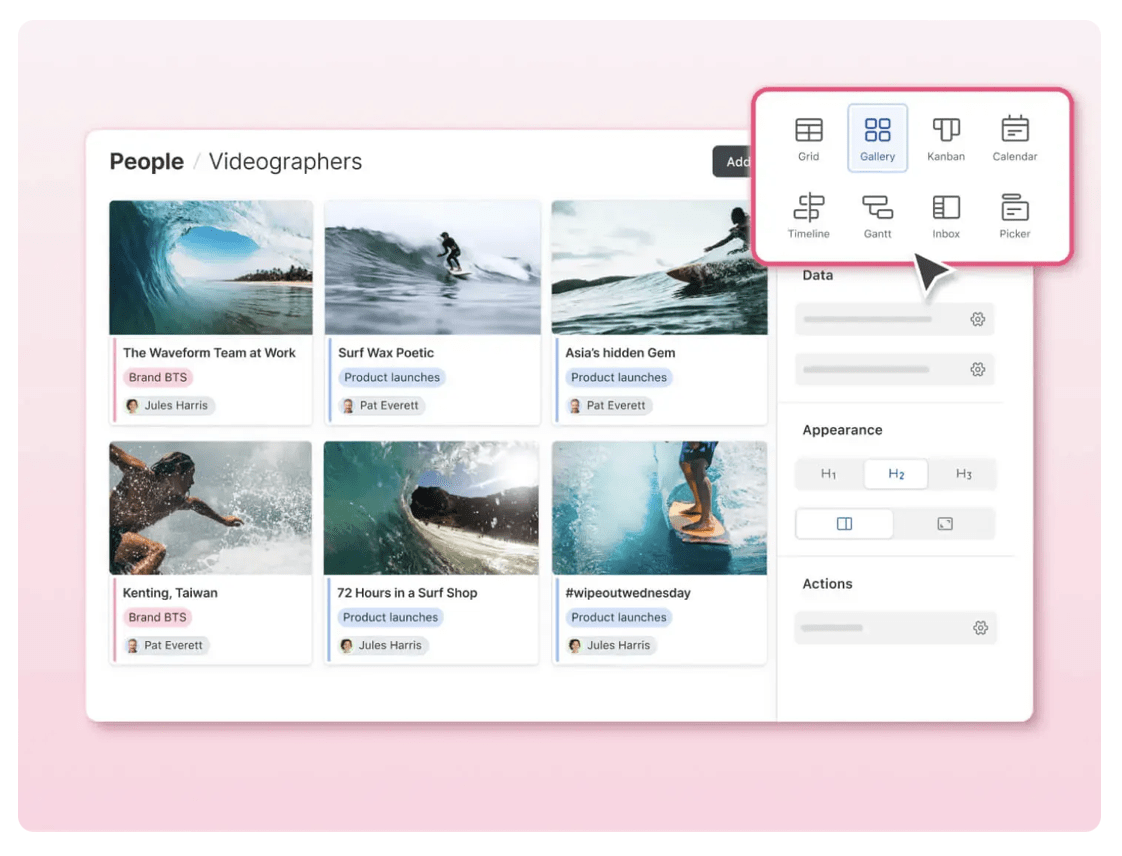
Multiple Views
Airtable offers multiple views to interact with data: Grid, Kanban, Calendar, List, Gallery, Gantt, Timeline, and more. Rows and Excel lack this. The latter two software to the traditional spreadsheet format.
Of course, you can hide some UI features to give more white space for the cells, but there's no escape from the grid view.
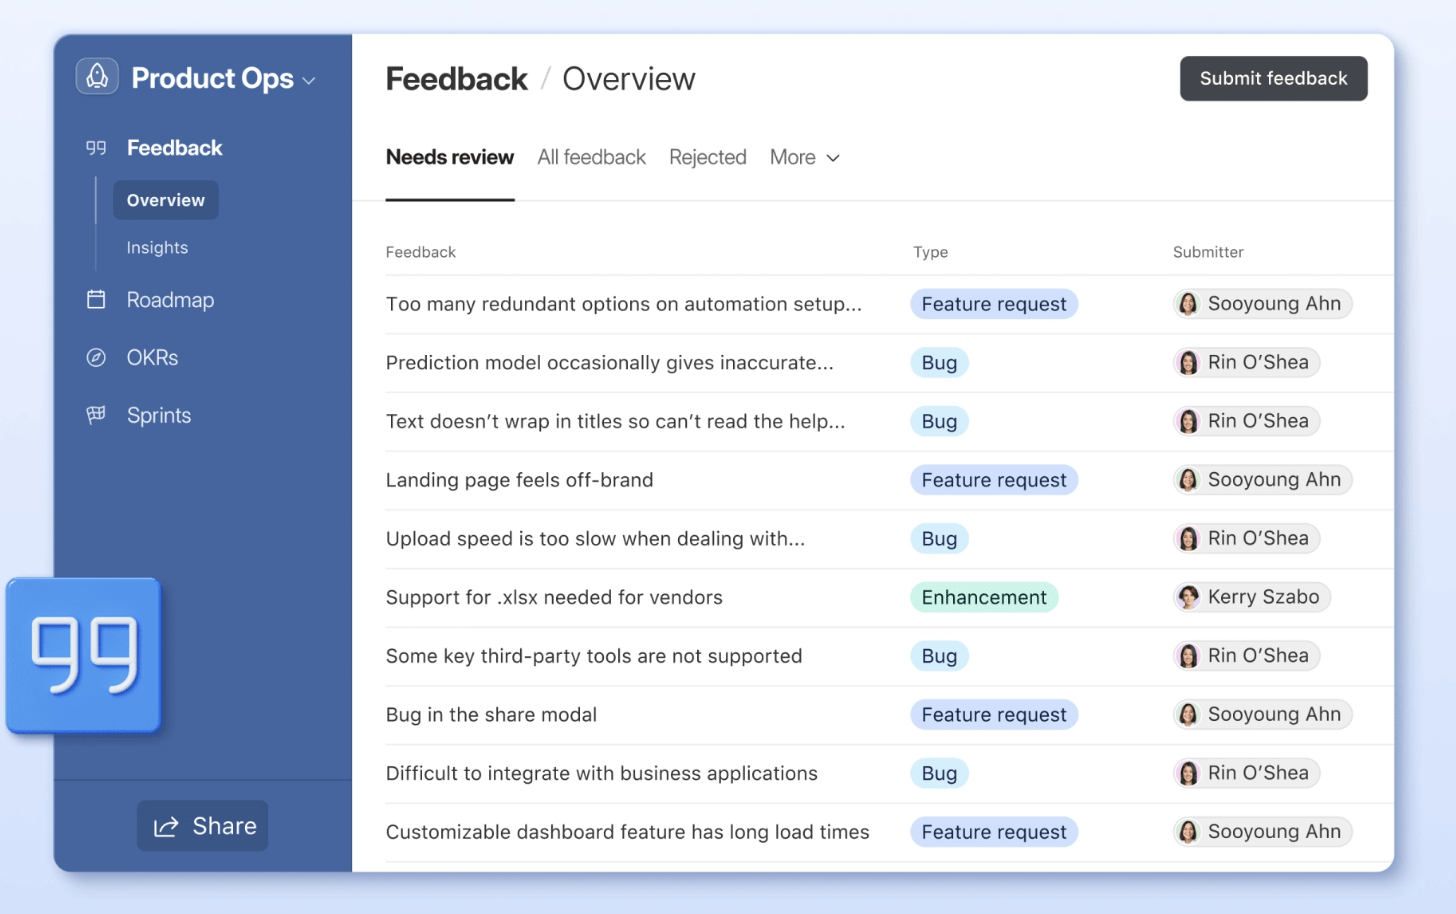
Interface Designer
If the different views aren't helpful, Airtable is configurable from head to toe.
Using its visual interface builder, you can drag and drop elements, tables, and records to create personalized interfaces.
Consider Airtable a blank canvas on which you can control how you work with data.
Airtable is a database software that doesn't store data at the forefront (like Rows and Excel). The data you see in the above image is stored in a backend and can be used in multiple ways, such as in different views or apps.
If you change the data in one place, the whole record changes in the backend.
That's why, out of the three - Airtable, Excel, and Rows, Airtable has the most extensive customization capabilities.
AI and Automation
Airtable features a no-code automation builder that allows anyone, regardless of their technical know-how, to automate team workflows and cross-platform processes – from a single notification to multi-sequence workflows.
The platform also provides pre-configured apps, like marketing and product apps, with tables, automation, forms, and other relevant use cases that support end-to-end, cross-functional workflows.
In terms of AI capabilities, Airtable is second to Rows and Excel.
Here's why.
Airtable AI lets you analyze, organize, and connect workflows and information you already have in Airtable. You can use it to:
Summarize and extract insights
Generate content pieces
Get suggestions on workflow improvements
However, unlike Rows and Excel, Airtable fails to integrate AI into core spreadsheet functions.
Rows AI Analyst focuses on cell-level or primary spreadsheet automation. Excel is no different.
Both feature AI that allows you to use formulas, generate content, analyze customer sentiments, identify trends and patterns, and more without leaving your spreadsheet.
But it makes sense because Airtable AI, being a database app, cannot interact at this level with your data.
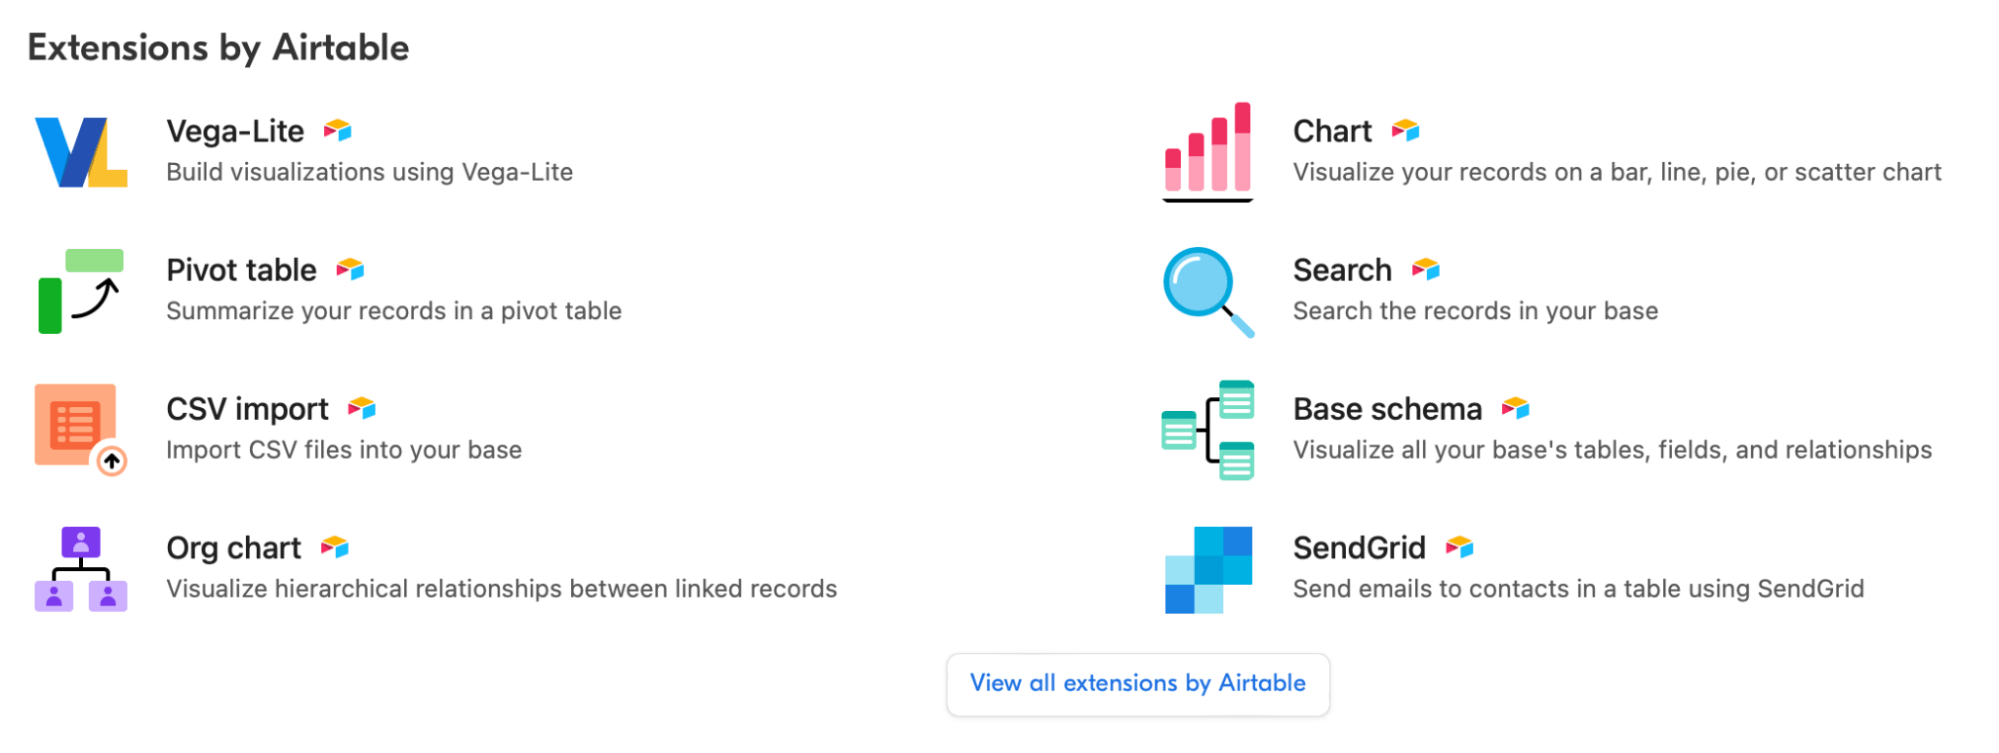
Data Visualization
Apart from the multiple views it offers, Airtable doesn't have built-in data visualization and relies on extensions to work. The Airtable marketplace houses a bunch of charts, graphs, and top-line metrics to suit your team's reporting needs.
However, the number of extensions per database is limited. The premium plan only gives you ten extensions per base, which is low considering that integrations use up your extension allowance.
Rows and Excel don't rely on extensions for data visualization. Everything is native and unlimited.
While Airtable still excels at specific visualizations like org charts and flowcharts, the key difference is the interactivity Airtable visualization elements offer.
Excel Features
Microsoft Excel has been around for so long that we have gotten used to it. It's a robust spreadsheet app perfect for crunching numbers.
Let's look at its features.
Formulas and Functions
Excel has the most extensive catalog of formulas and functions (500+) compared to Airtable and Rows. This makes tasks like accounting and statistical analysis easy to perform in Excel.
Rows is second to Excel in formulas and functions. Meanwhile, Airtable supports most Excel formulas, but they have limited functionality within the platform.
AI and Automation
Excel has an AI Copilot, a conversational AI assistant that lets you perform most tasks via natural language commands.
It helps you with low-level tasks like formatting and organizing data to high-end analysis, such as identifying trends, proposing what-if scenarios, suggesting ideas for improving your business, and building a dashboard.
However, unlike Rows, which provides AI capabilities with no added cost, Copilot is an add-on that costs an extra to use within Excel.
Excel lets you record Macros to automate workflows.
Macros are bite-sized recordings of a particular process. Once recorded, Excel automatically replicates the steps from the recording to perform the entire process in a click.
The borderline difference between Excel's Macros and Airtable automation is that the latter requires no technical knowledge, but it doesn’t handle complex data manipulation well.
Excel Macros are highly customizable and can perform complex tasks requiring advanced data manipulation and calculations.
Data Analysis and Manipulation
Excel is known for its extensive data-handling capabilities. It offers AI tools to auto-fill cells, update cell values, and apply automatic formatting to ease data analysis.
In Excel, every cell contains a formula that can be referenced to other cells or fields and manipulated at a cellular level.
In Airtable, formulas apply to the whole field rather than individual cells. That is, you cannot do a sum of two specific values in a column but can make an operation with the entire column.
Besides, you'd find advanced analytics that goes beyond Airtable and Rows in terms of functionality. For example, advanced statistical tests such as z-tests, t-tests, and ANOVAs are built into the platform.
Data Visualization
Excel has two functions that it’s great at. It's excellent at working with large data sets and visualizing them in multiple ways.
Unlike Airtable, which relies on extensions for visualizing data, Excel has native visualization capabilities. That is, you won't have to limit yourself to a couple of charts and can visualize the fullest.
It also has a Quick Analysis tool that automatically selects the best chart for your data. In addition, you've access to a vast gallery of ready-made dashboard and report templates for inventory, budgeting, and other versatile purposes.
Integrations - Airtable vs Excel vs Rows
Rows
Rows integrates with 50+ data sources, helping you import, automate, and visualize data more effectively.
It integrates with software in categories like finance, marketing, databases, AI, CRMs, and more, such as Google Analytics, Google Search Console, Facebook Ads, Notion and BigQuery.
Rows also integrates with Open AI to use AI when analyzing data, making the whole process easy for the users.
Other major integrations involve software like:
Make
Gmail
HubSpot
Looker Studio
Zapier etc.

Airtable
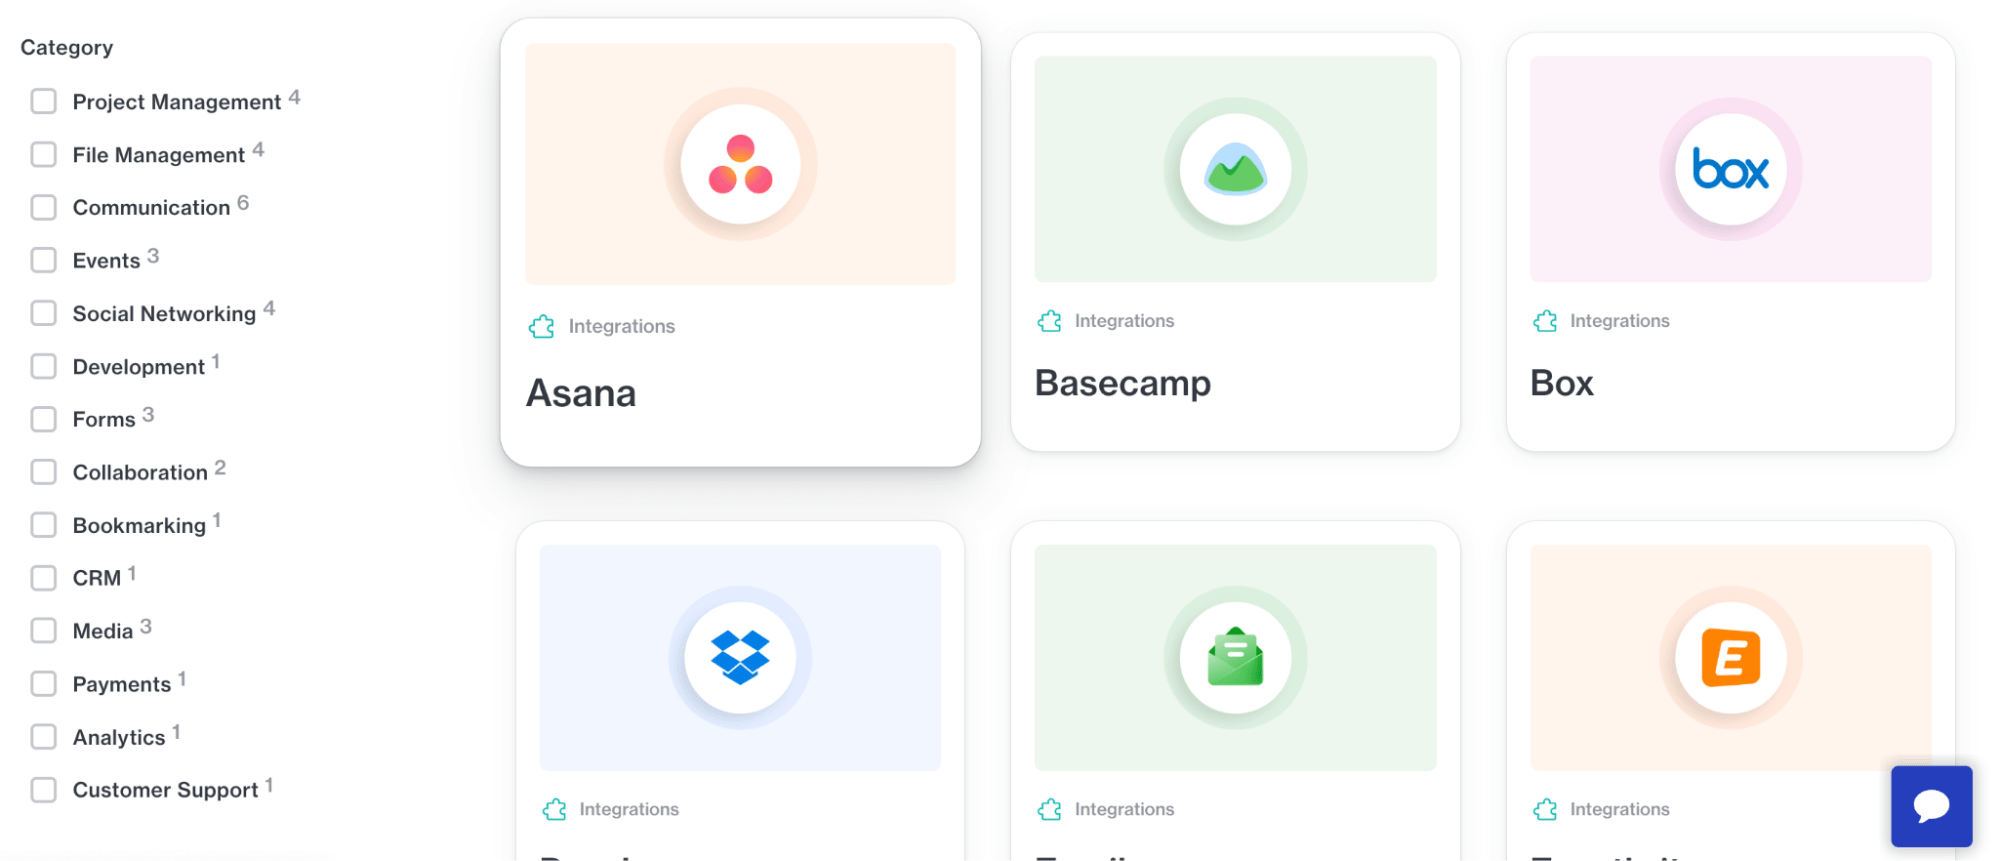
Airtable offers integrations to popular tools like Slack, YouTube, Instagram, Salesforce, Asana, and 30 others. However, most of the Airtable integrations are via a marketplace (extensions) and are not native to the platform.
Excel
Excel lacks plug-and-play data integrations, most of which you'd find in Airtable and Rows.
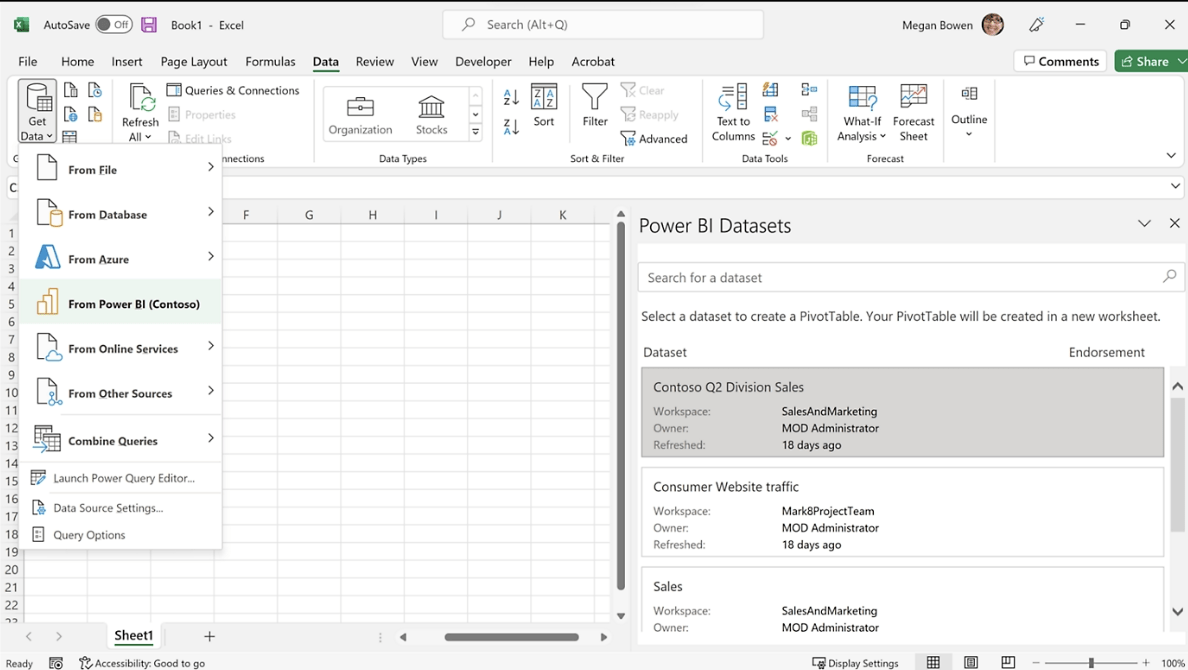
The only native integrations Excel has are for Power BI, MS Office apps, and a few data warehouses.
However, Excel offers Zapier integration, allowing you to integrate with 5,000+ apps in a click.
Pricing - Airtable vs Excel vs Rows
Rows Pricing
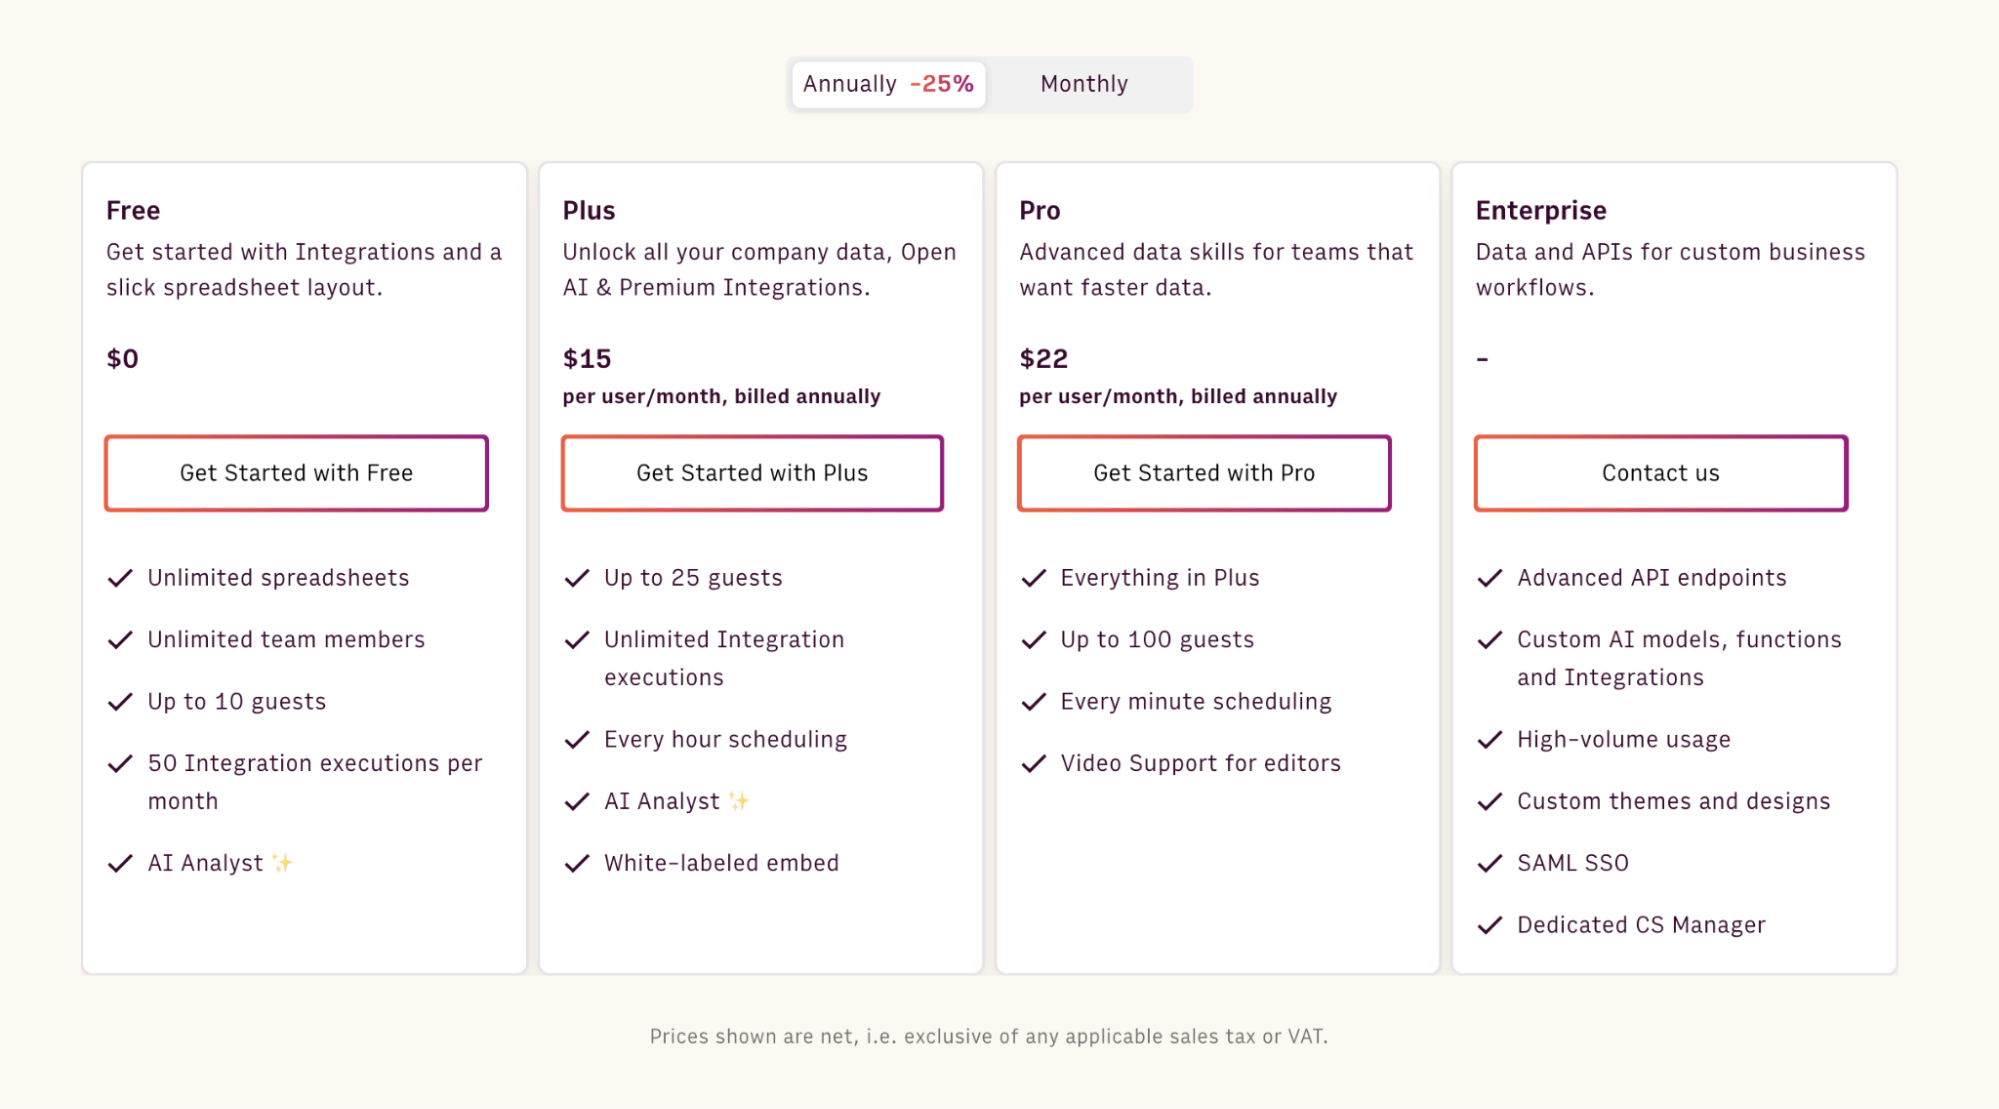
Rows offers a generous free plan where you can onboard unlimited members, up to 10 guests, and execute up to 50 integration tasks per month. If you want premium features and increased limits, Rows also offers 3 paid plans to choose from:
Plus: $15/month/member, up to 25 guests, unlimited integration tasks & daily data refresh.
Pro: $22/month/member, up to 100 guests, unlimited integration tasks & hourly data refresh.
Enterprise: Custom price for advanced API usage and workflows.
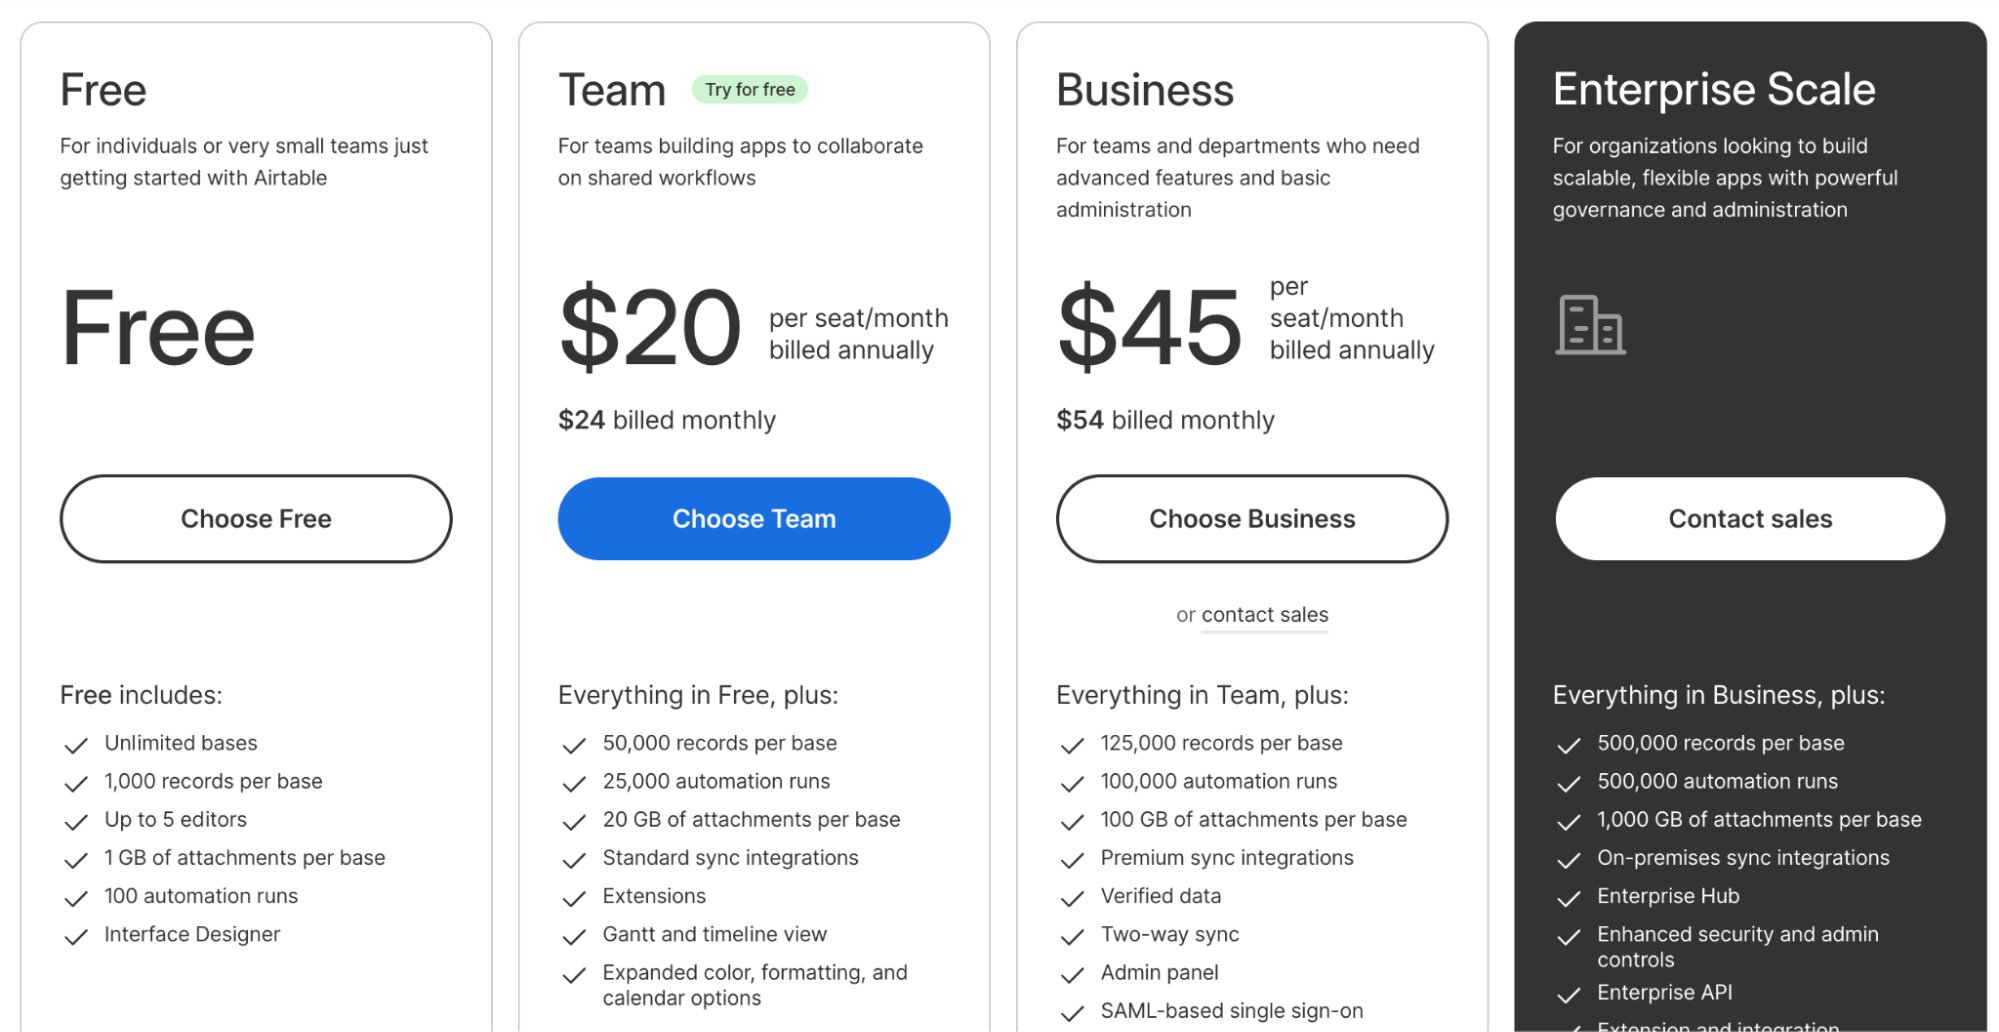
Airtable Pricing
Airtable offers a generous free version limited to 1,000 records. This proves costly to a growing business with an ever-expanding database. However, Airtable is still an excellent choice for visualizing various data types.
It has three paid plans:
Team: $24 per seat per month
Business: $54 per seat per month
Enterprise: Custom pricing
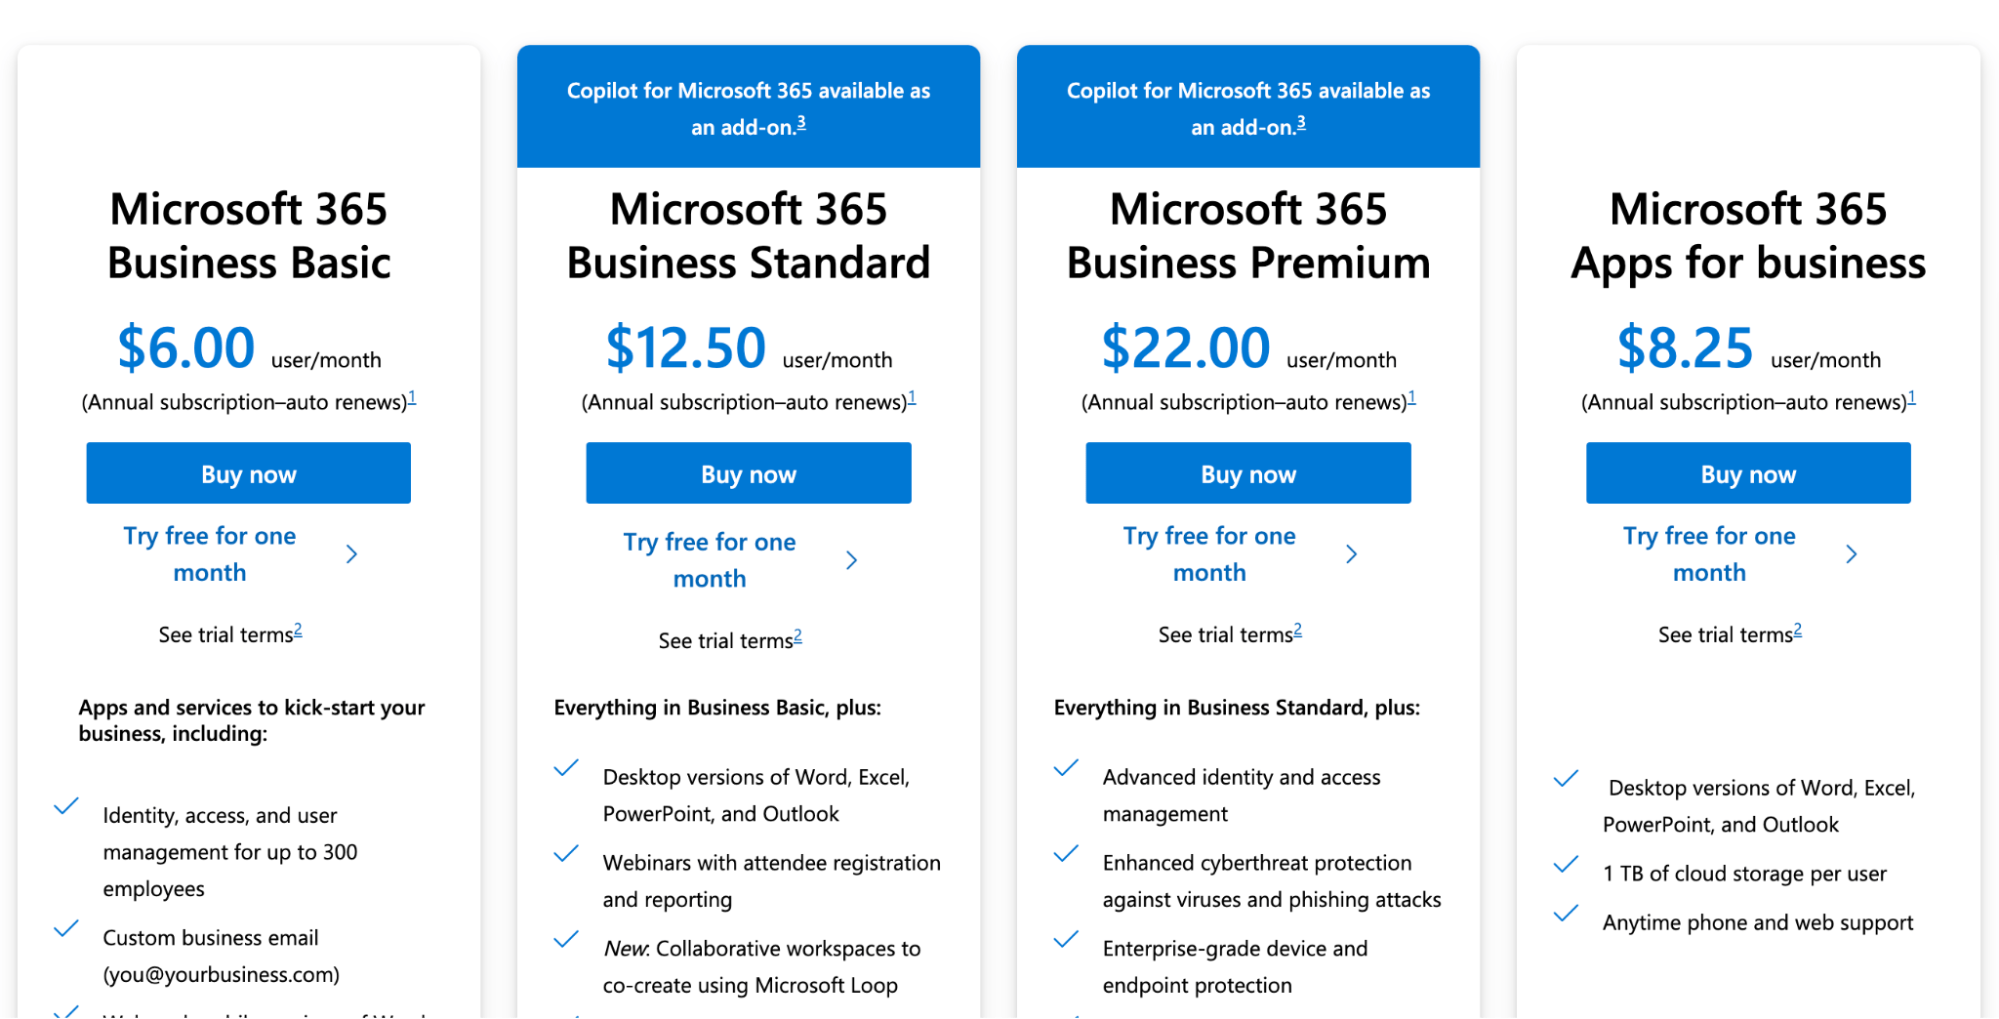
Excel Pricing
Microsoft Excel (web-only) is available as a standalone app and is free for personal use.
The offline version comes as part of the Microsoft 365 suite and has two subscription categories for personal and professional use:
For Home
Personal: $6.99 per month
Family: $9.99 per month
For Business
Basic: $6 per user per month
Standard: $12.50 per user per month
Premium: $22 per user per month
In Airtable vs Excel vs Rows, Airtable has the most expensive pricing point. The cost skyrockets as you include more team members or even add more rows and columns.
Comparably, Rows and Excel offer decent pricing and are affordable for fast-growing startups.
What are Customers saying?
Rows Reviews
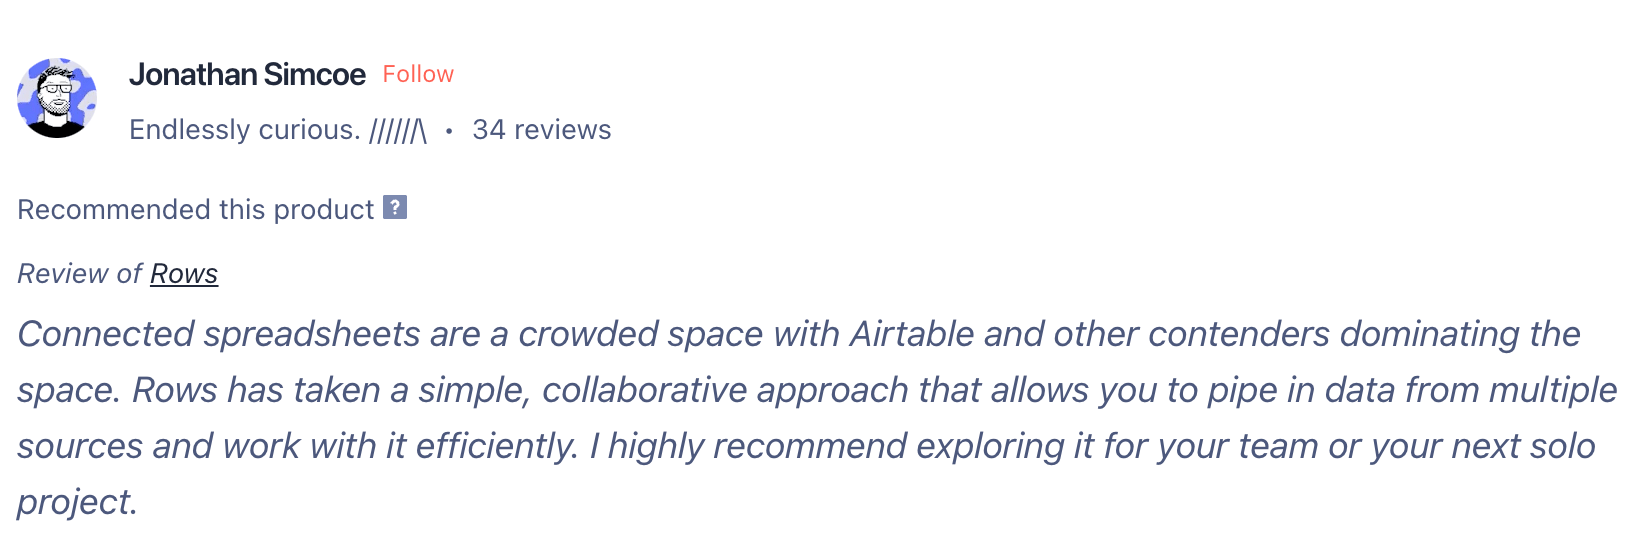
Rows makes it easy to collaborate with your team members on multiple spreadsheets.
“Connected spreadsheets are a crowded space with Airtable and other contenders dominating the space. Rows has taken a simple, collaborative approach that allows you to pipe in data from multiple sources and work with it efficiently. I highly recommend exploring it for your team or your next solo project.”
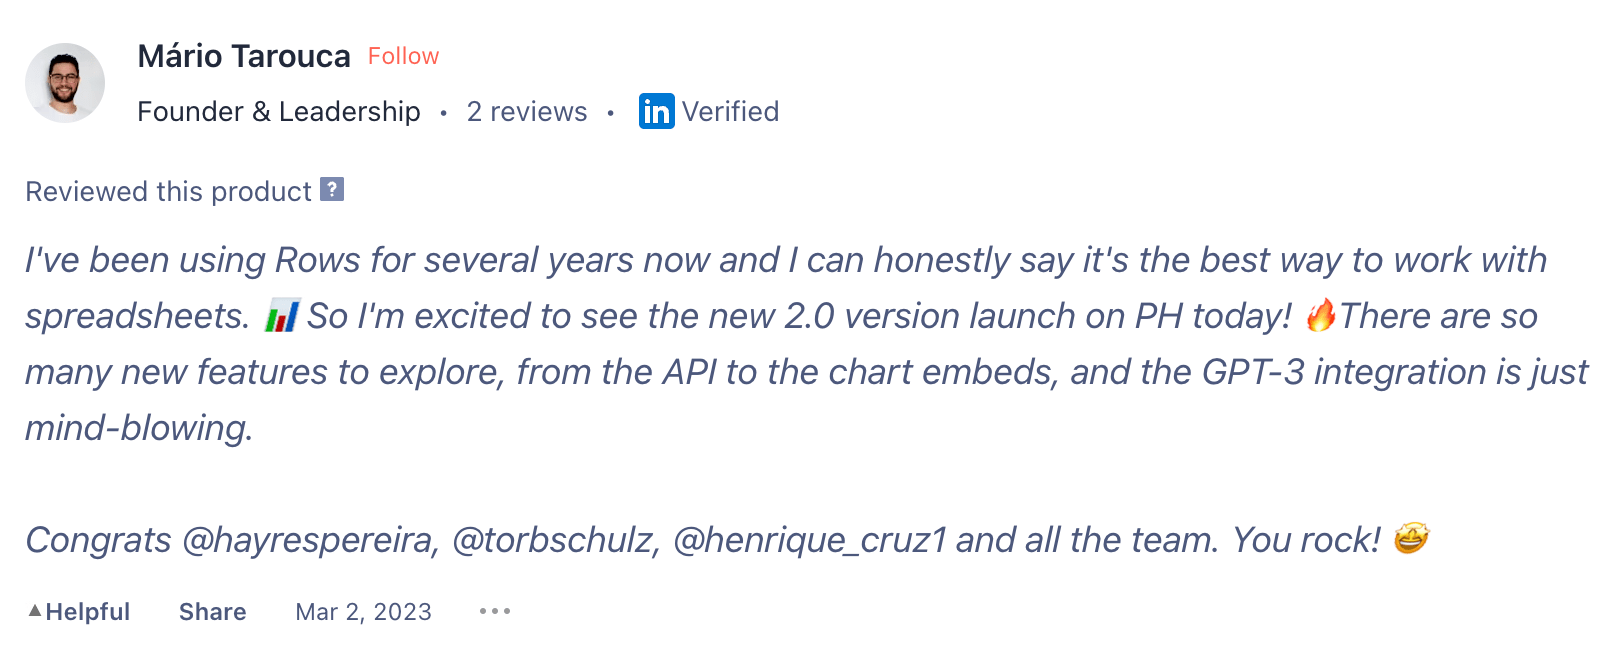
Users are happy with the variety of features Rows offers and its AI capabilities.
“I've been using Rows for several years now and I can honestly say it's the best way to work with spreadsheets. 📊 So I'm excited to see the new 2.0 version launch on PH today! 🔥There are so many new features to explore, from the API to the chart embeds, and the GPT-3 integration is just mind-blowing.” - Product Hunt.
The knowledge base Rows offers for every feature and integration is commendable, and users love it.
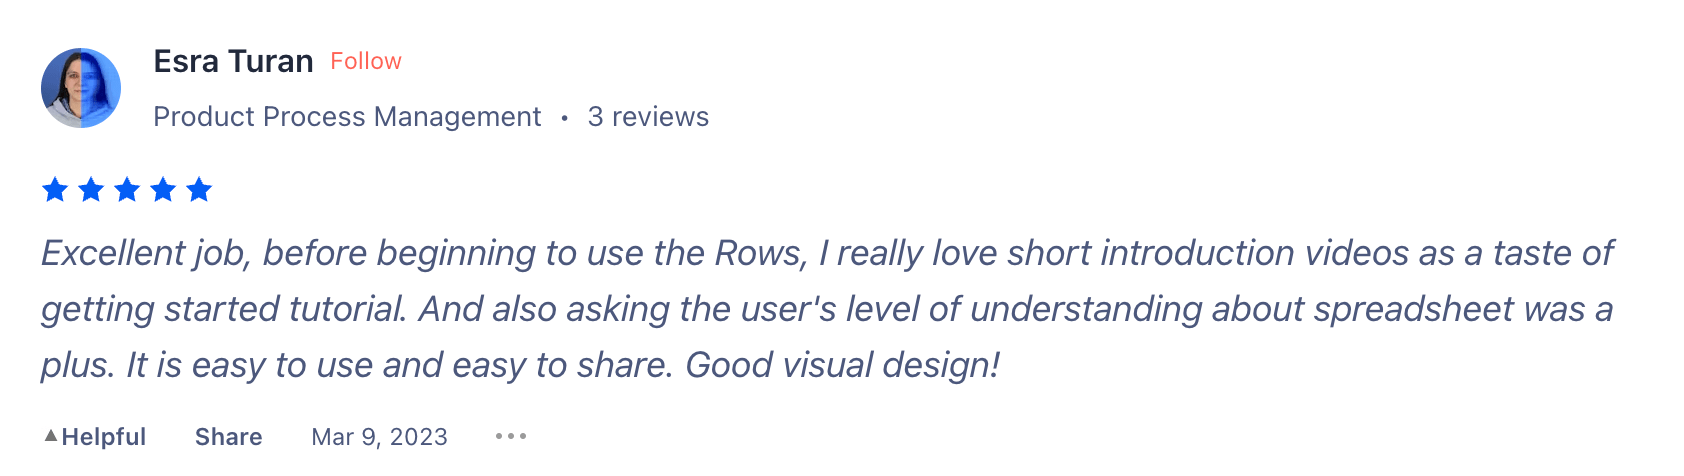
“Excellent job, before beginning to use the Rows, I really love short introduction videos as a taste of getting started tutorial. And also asking the user's level of understanding about spreadsheets was a plus. It is easy to use and easy to share. Good visual design!” - Product Hunt.
Your new AI Data Analyst
Extract from PDFs, import your business data, and analyze it using plain language.
Try Rows (no signup)Airtable Reviews
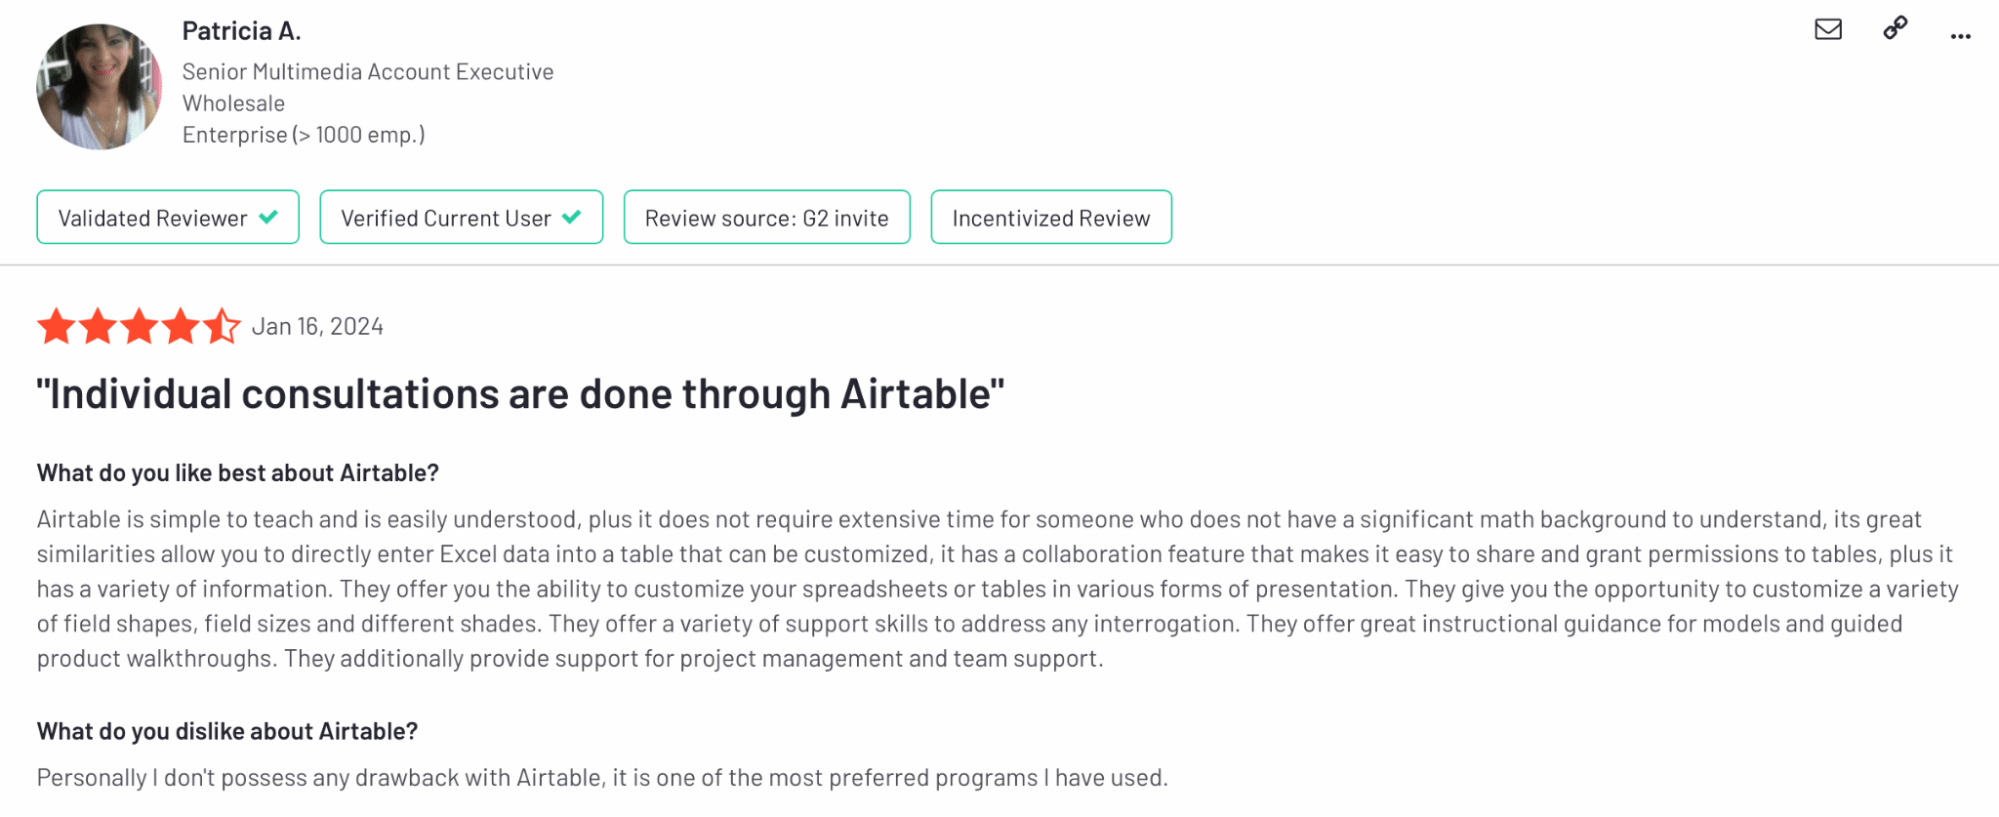
Users love how Airtable ditches the traditional spreadsheet format to offer a tweakable and flexible alternative for managing data and workflows.
To my surprise, despite the familiar interface of Excel, many users (500+) choose Airtable for data management due to its intuitiveness, customizations, and lowered prerequisite of learning formulas and processes that comes with Excel.
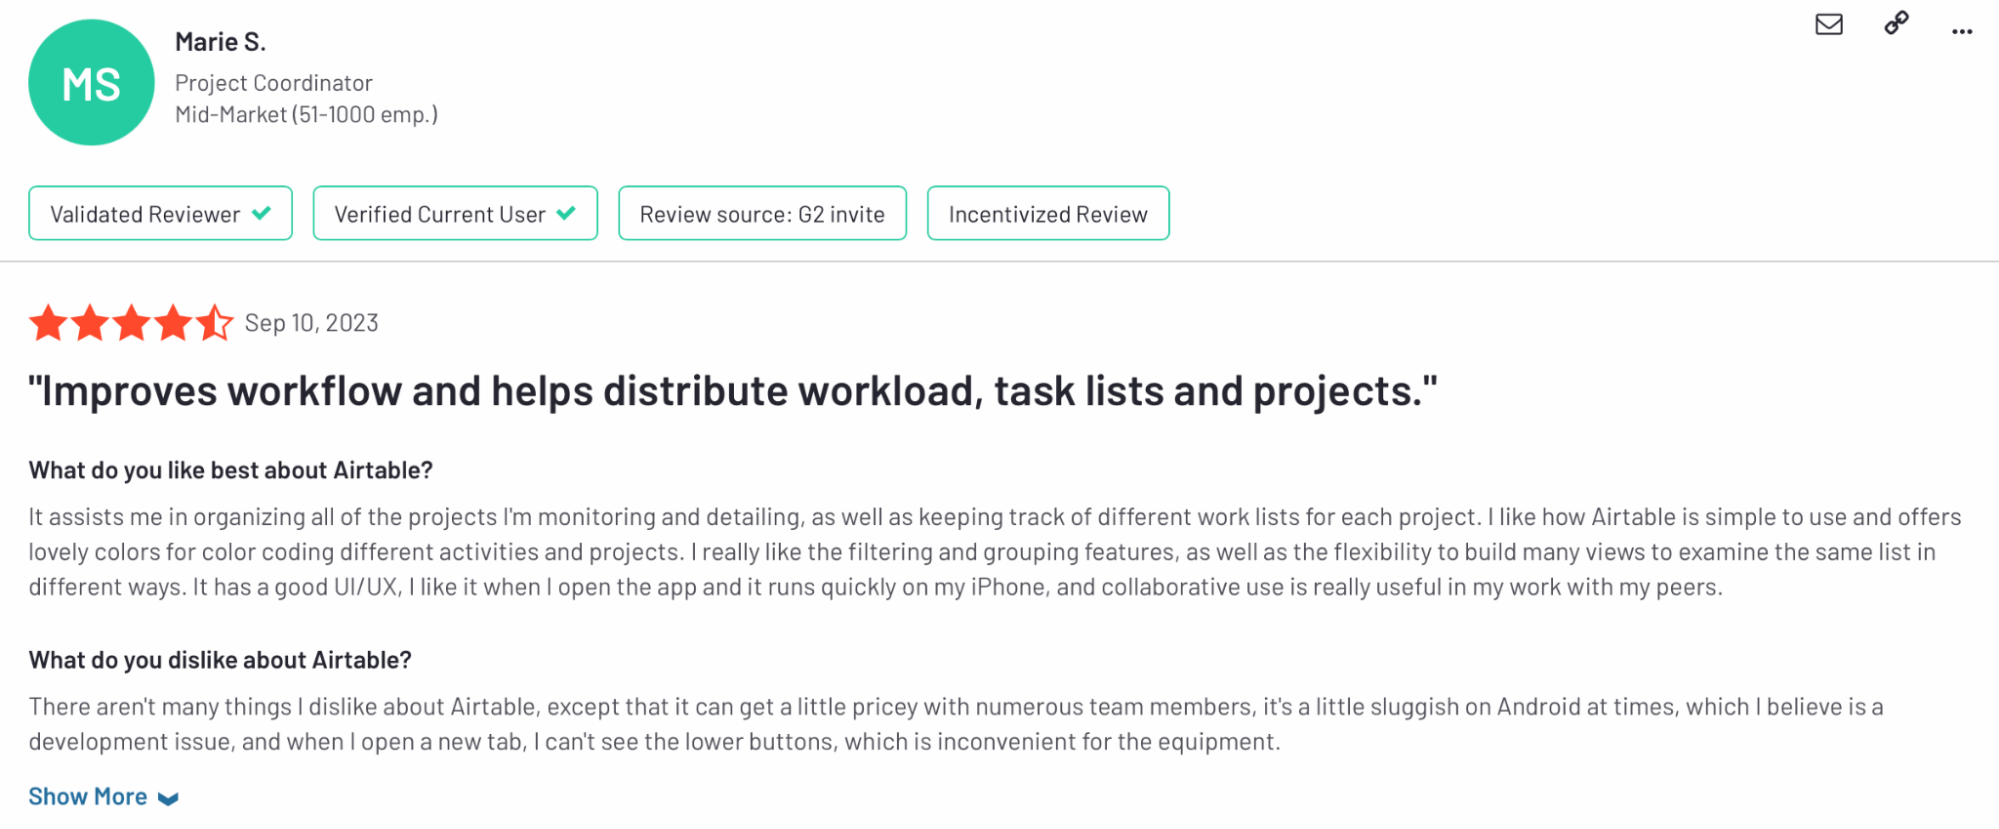
A common drawback we found in most reviews was that Airtable is pricey when you onboard your team. Plus, it’s not readily accessible on Android devices.
Excel Reviews
Excel has been used for decades, and people have become familiar with its interface. So, we’ll ignore the learning curve noise for ones and focus on key user reviews.
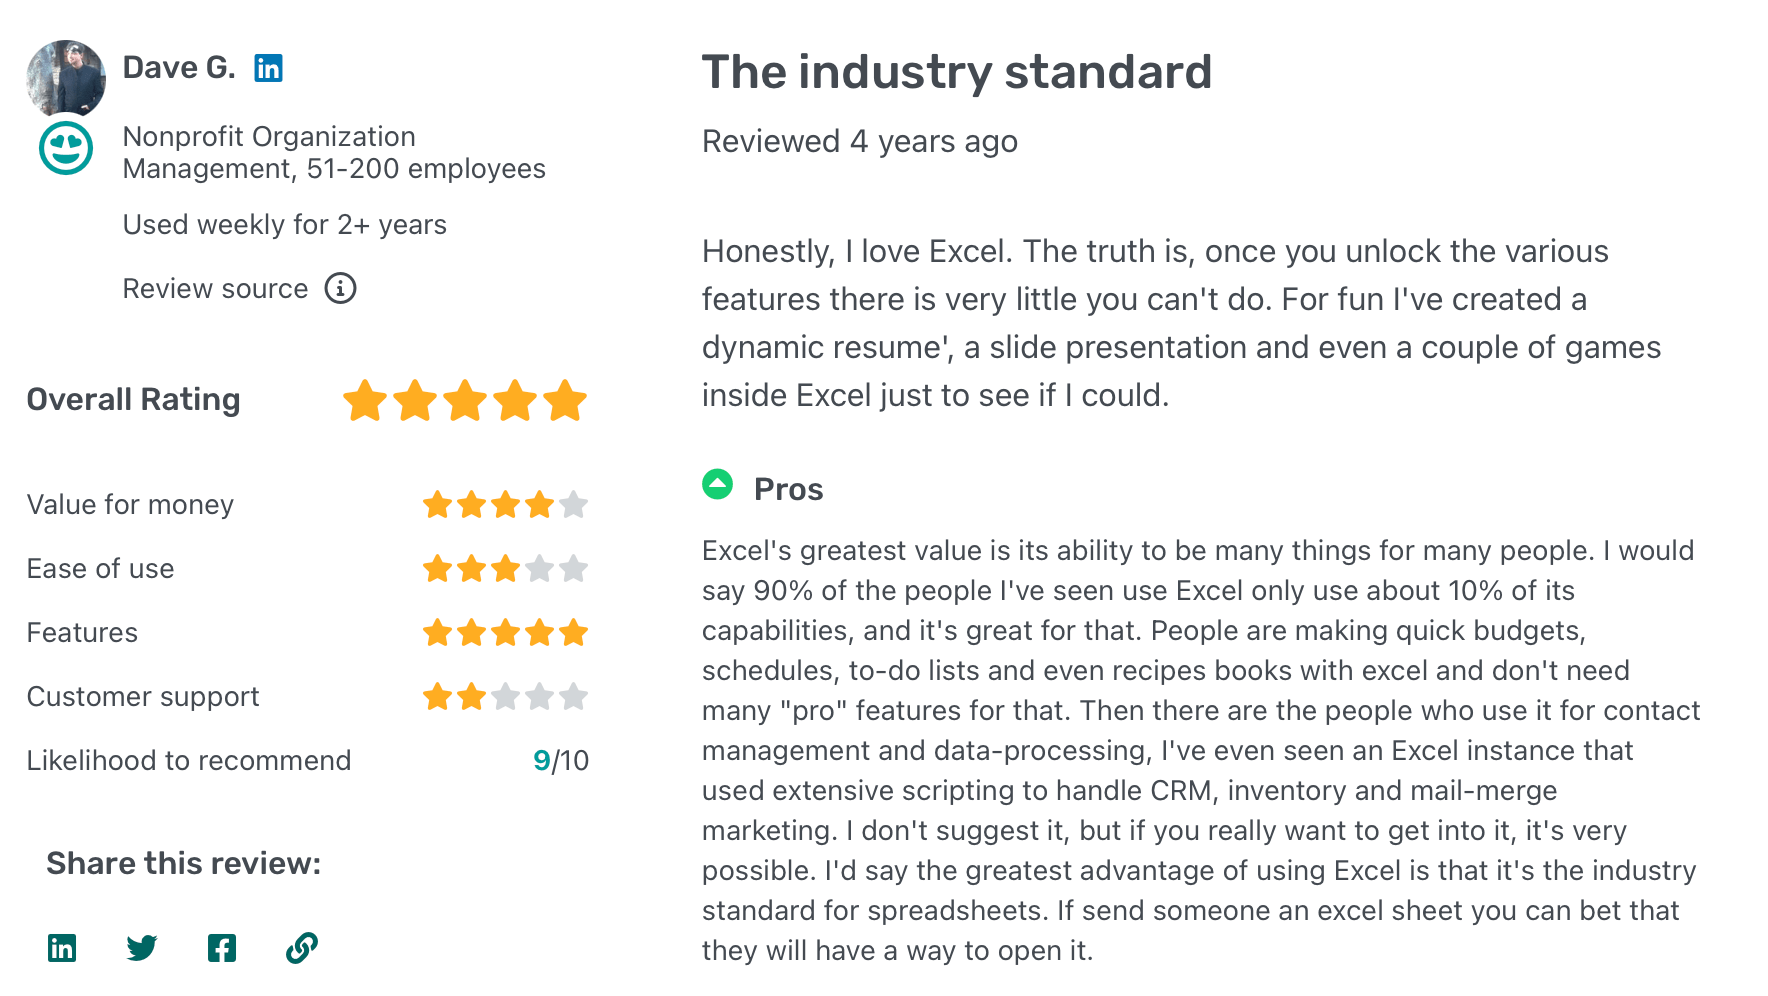
Firstly, reviewers find Excel to be a standalone app for contact management, accounting, making quick budgets, schedules, to-do lists, and more. That’s because Excel can do these and much more without pinning you with limits or ‘pro’ features for the job.
Much of why Excel is still a cost-effective data management solution for the masses.
Automation can be tricky in Excel. Unlike Airtable’s no-code automation builder, Excel’s Macros require some technical know-how. A simple error in automation can be a pain to resolve. Meanwhile, Excel has no error-detection features for recognizing human errors in data entry or building Macros; it’s too manual and requires human intervention in every step.
Wrapping Up
With this detailed comparison, you’ll be able to choose the spreadsheet software that best suits your business needs.
Here’s a quick recap:
Rows’ AI capabilities, integrations, and unique features makes it one of the best spreadsheet software in the market. It can help you:
Make data analysis easier by leveraging AI, even for non-data-friendly users.
Build charts, graphs, and more elements that help you with data visualization.
Integrate with data warehouses, finance, marketing, and many more apps to import and export data.
Airtable is the best match for you if your priority is building customizable apps and automations over data analysis and visualization.
Microsoft Excel is a good spreadsheet software for companies dealing with large datasets and complex calculations.
If you or your team don’t have the time to try all three spreadsheet tools, go to Rows.com, import data, automate your report, and see if it's the right match!
Related Reading