Introducing the AI Spreadsheet Benchmark


Today we’re announcing the first modern spreadsheet benchmark for the AI age. We call it the AI Spreadsheet Benchmark. We used this new benchmark to compare Rows against four other data tools, including spreadsheets and AI data analysis platforms. On this report you will find an evaluation on:
Our AI spreadsheet: Rows.com.
The two incumbents: Excel Copilot and Google Sheets with Gemini
Two newcomers that launched after ChatGPT: Julius and Shortcut
This is just the first edition. We are committed to making it a transparent, public and recurring analysis. The AI Spreadsheet Benchmark will track how the category evolves. Spreadsheets are the #1 tool used by business people to read, write and model data. We will then use it to push Rows beyond the frontier of what an AI spreadsheet can do.
Methodology: 53 questions, real-world dataset
Our public dataset includes a table of GDP per capita from the World Bank and a table of world capitals, published on Hugging Face. We designed 53 questions to reflect the everyday tasks people actually do in spreadsheets:
Arithmetic and quick calculations: from simple sums to slightly more complex math.
Data analysis: summaries, pivots, merging tables, classification tasks.
Data manipulation: adding or editing columns, formatting, and managing spreadsheet elements.
Visualization and model creation: turning raw data into charts, or building simple predictive models.
The questions include simple lookups like “What was the GDP per capita for Germany in 2010”. Other questions are open-ended data analysis that might require real-word information that is not directly available in the dataset like “Summarize the growth in GDP per capita in the last 10 years for OECD countries in a table” (the list of OECD countries is not in the dataset). And there are more complex questions still, like model creation.
Each question was run three times on every platform. The runs happened between the 8th and the 12th of September, 2025. We measured performance across four key dimensions:
First-try accuracy (Pass@1st): Did the tool get it right the first time? This is the single most important metric. In real life, people expect answers on the first try. Nobody wants to spend time nudging an AI until it eventually gets it right.
Third-try accuracy (Pass@3rd): Could the tool get it right within three tries? This is a more generous measure of accuracy that helps us understand the “ceiling” of intelligence for each platform.
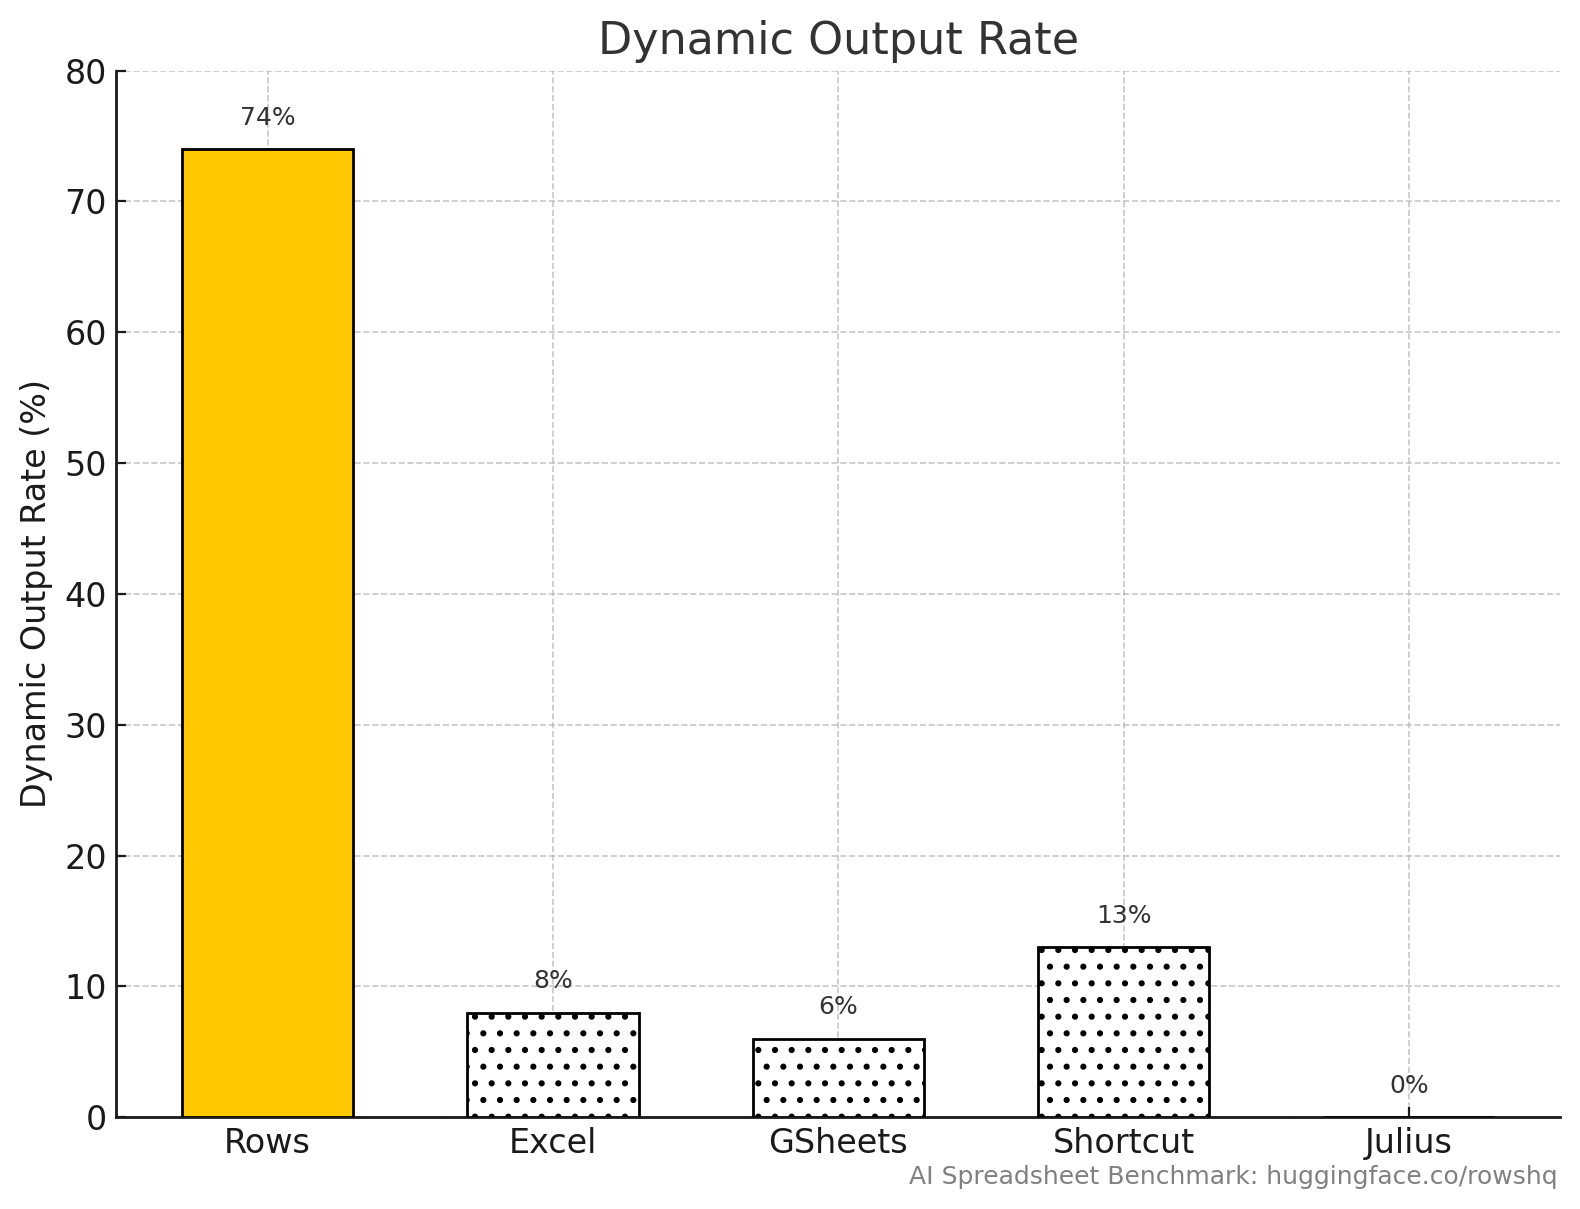
Dynamic output: After Pass@1st, this is the second most important metric. It measures if the AI answer is “dynamic” or “stale”. A dynamic answer is linked to the underlying spreadsheet data, and will recalculate automatically if inputs change. It can be a dynamic formula, a table with a python script, or a chart that is feed from a range. A “stale” answer is hardcoded once and disconnected, for example a table with literal values or an image of a chart. This is critical for real spreadsheet work, where users build models, run scenarios, and constantly adjust inputs. A more dynamic answer also means it’s easier to inspect, as you have the formula or code or settings of the generated spreadsheet elements. We believe it’s a key reason why people will continue to use spreadsheets instead of asking all questions to LLMs directly.
Speed: How fast did the tool produce results? We tracked both mean and median answer times.
Evaluations
Rows consistently outperformed every other spreadsheet and AI data analysis tool we tested. In the 53 benchmark questions, Rows showed not only higher accuracy, but also a unique ability to generate dynamic answers — results that remain linked to the underlying data and automatically recalculate when inputs change.
Overall Accuracy
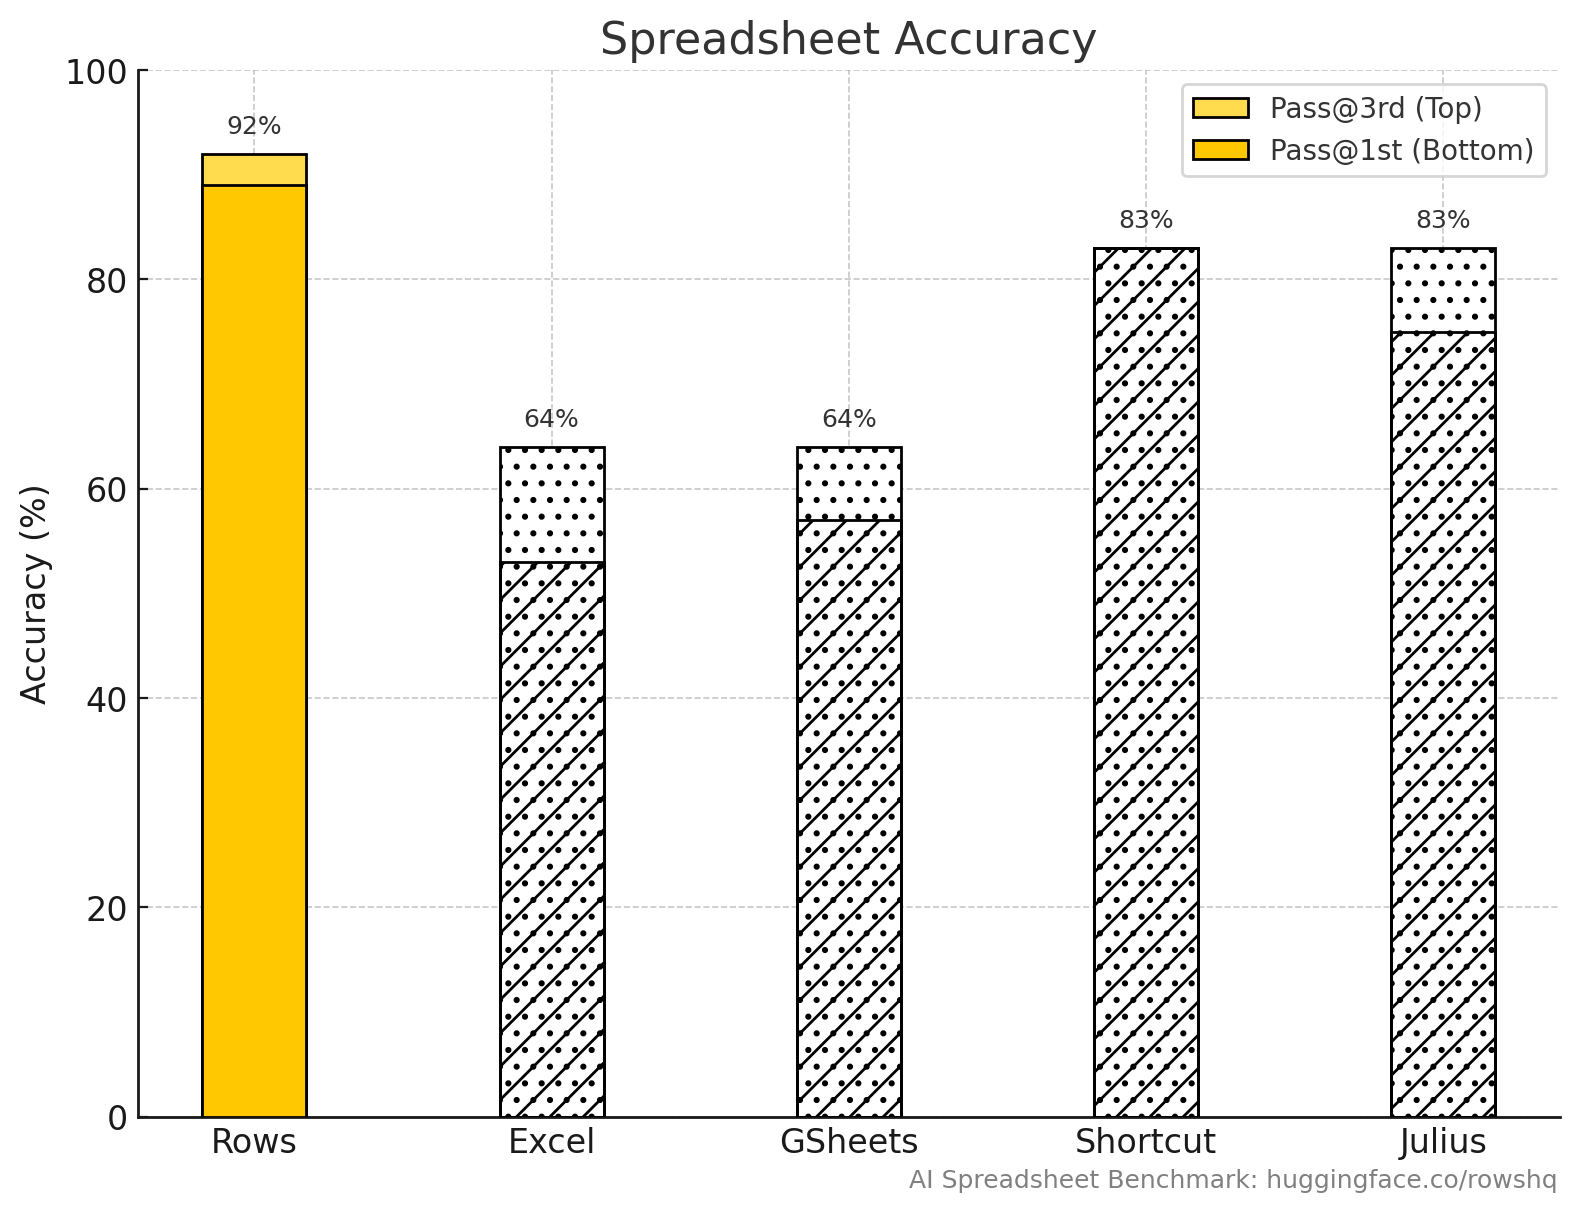
First-try accuracy (Pass@1st): Rows scored 89%, well above Excel (53%) and Google Sheets (57%), and ahead of both newcomers, Shortcut (83%) and Julius (75%).
Third-try accuracy (Pass@3rd): Rows score improved to 92%, maintaining a strong lead over the incumbents (64% each) and distancing it from both newcomers (both 83%).
Dynamic output: Rows was the only tool to deliver consistently dynamic outputs, with 74% of answers being fully adaptive. All other tools defaulted to static, hardcoded outputs, and had low scores: Excel (8%), Google Sheets (6%), Shortcut (13%), and Julius (0%).
Speed:Google Sheets (10s median) and Excel (32s) were faster, reflecting simpler environments. Rows’ median time of 138s reflects the added complexity of producing live, adaptive results.
Accuracy in different Task Categories

Rows leads the accuracy across all types of tasks, including where intelligence, adaptiveness, and reliability really count.
Advanced analysis: These were the hardest questions in the benchmark, tasks that go beyond formulas and into areas like scenario modeling, clustering, or building new relationships between datasets. They represent the frontier of what AI can do inside spreadsheets. While this area is still an active field of research, Rows and Shortcut already stand out with consistent results (60%), showing that it can tackle problems that incumbents and newcomers alike fail to handle reliably.
Arithmetic operations: All tools were competent, but Rows scored 100%.
Classic data analysis: 89% Pass@1st, far ahead of Excel (54%) and Sheets (57%).
Model creation: Rows was the only tool to consistently succeed (100%). Neither Excel nor Sheets managed a single correct run.
Spreadsheet management tasks: These include tasks like sorting, deleting or renaming tables, or apply formatting rules. Rows again scored 100%, while incumbents struggled (Excel 33%, Sheets 67%).
Dynamic vs Stale Outputs
Let’s now look at how much each product is generating elements that the user can take ownership of.
Rows proved to be far more reliable and intelligent than Excel and Google Sheets. The incumbents may return answers quickly, but they are often wrong, incomplete, or simply pasted as static text or numbers. For example:
When asked to calculate GDP growth, Excel and Sheets often produced a single number, disconnected from the table. If the source data changed, the answer would stay frozen.
Rows, by contrast, created a new column with formulas, ensuring the growth rates updated automatically as the data changed.
Shortcut and Julius are strong on raw accuracy, with Shortcut in particular achieving 83% Pass@1st. But both fail to integrate AI into the spreadsheet environment. Their approach mirrors a Python notebook: run a script, paste static results, stop there.
Rows architecture bridges these worlds. It has the power of a Python notebook and the live recalculation engine of a spreadsheet. The result is a tool that adapts instantly: tweak a filter, add a row, update an assumption, and the analysis refreshes in real time.
What’s next
Today’s step is just the first edition of the AI Spreadsheet Benchmark, and we’ll be running it again next quarter to track progress.
We’re also making everything public. You can download the dataset and evaluation questions directly from Hugging Face, replicate the challenges yourself, and design your own assessments. Please share your findings with us or publish them. Transparency helps raise the standards for everyone.
We’re building the world's smartest AI spreadsheet, one that is adaptive, reliable, and powerful enough to handle real work. Try it yourself today at rows.com.

