About Google Analytics 4 Purchase Journey Report
Unlock the full potential of your Google Analytics 4 (GA4) data with our comprehensive GA4 Purchase Journey Report template. Designed to give you a clear and actionable view of your customer’s path to purchase, this template is an essential tool for digital marketers, eCommerce managers, and data analysts.
What is the GA4 Purchase Journey Report Template?
Our GA4 Purchase Journey Report template is a powerful spreadsheet tool that utilizes data from GA4 to provide a detailed breakdown of your entire purchase funnel. From initial sessions to final purchases, this template offers an in-depth analysis of each stage of the customer journey, helping you identify key trends and areas for optimization.
Key Features
- Complete Purchase Funnel Visualization: Track every step of the customer journey including sessions, product views, add-to-cart actions, checkout initiations, and completed purchases.
- Traffic Source Analysis: Understand which traffic sources are driving the most value by breaking down the purchase funnel by different channels.
- Device Category Breakdown: Gain insights into user behavior across mobile, tablet, and desktop devices to tailor your strategies accordingly.
- Date Range Flexibility: Analyze data over custom date ranges to identify trends, measure campaign performance, and make data-driven decisions.
Benefits of Using the GA4 Purchase Journey Report Template
- Optimize Marketing Strategies: By understanding which channels and devices are most effective, you can allocate your marketing budget more efficiently and drive higher ROI.
- Improve User Experience: Identify drop-off points in the funnel and make necessary adjustments to enhance the customer experience and increase conversions.
- Data-Driven Decisions: Make informed decisions based on comprehensive data analysis, helping you to stay ahead of the competition.
- Ease of Use: Our user-friendly template requires no advanced technical skills, allowing you to quickly gain valuable insights without the need for extensive data manipulation.
How It Works
- Connect Your GA4 Data: Easily integrate your GA4 account to pull in real-time data into the template.
- Customize Your Analysis: Use filters to segment data by traffic source, device category, and date range.
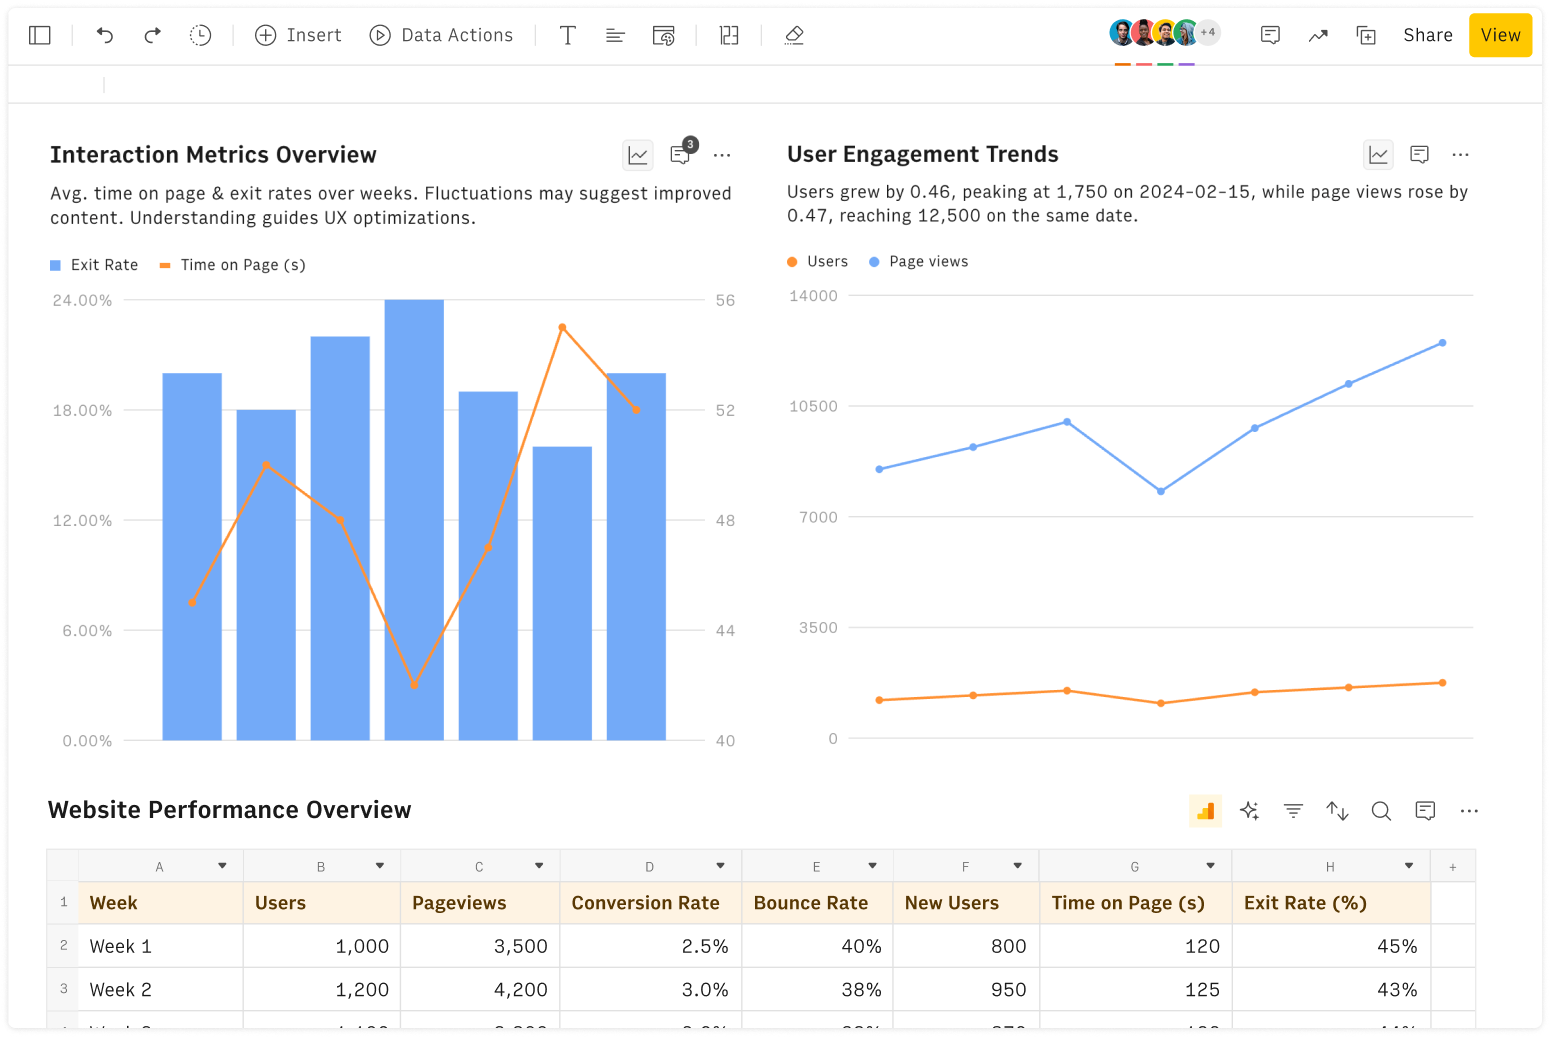
- Visualize and Interpret Data: Utilize built-in charts and graphs to visualize your data and gain actionable insights.
- Make Informed Decisions: Use the insights gained to optimize your marketing strategies, improve user experience, and drive more conversions.
Why Choose Our GA4 Purchase Journey Report Template?
- Expertly Designed: Created by SEO and analytics experts to ensure you get the most relevant and actionable insights.
- Time-Saving: Skip the hassle of building complex reports from scratch and start analyzing your data immediately.
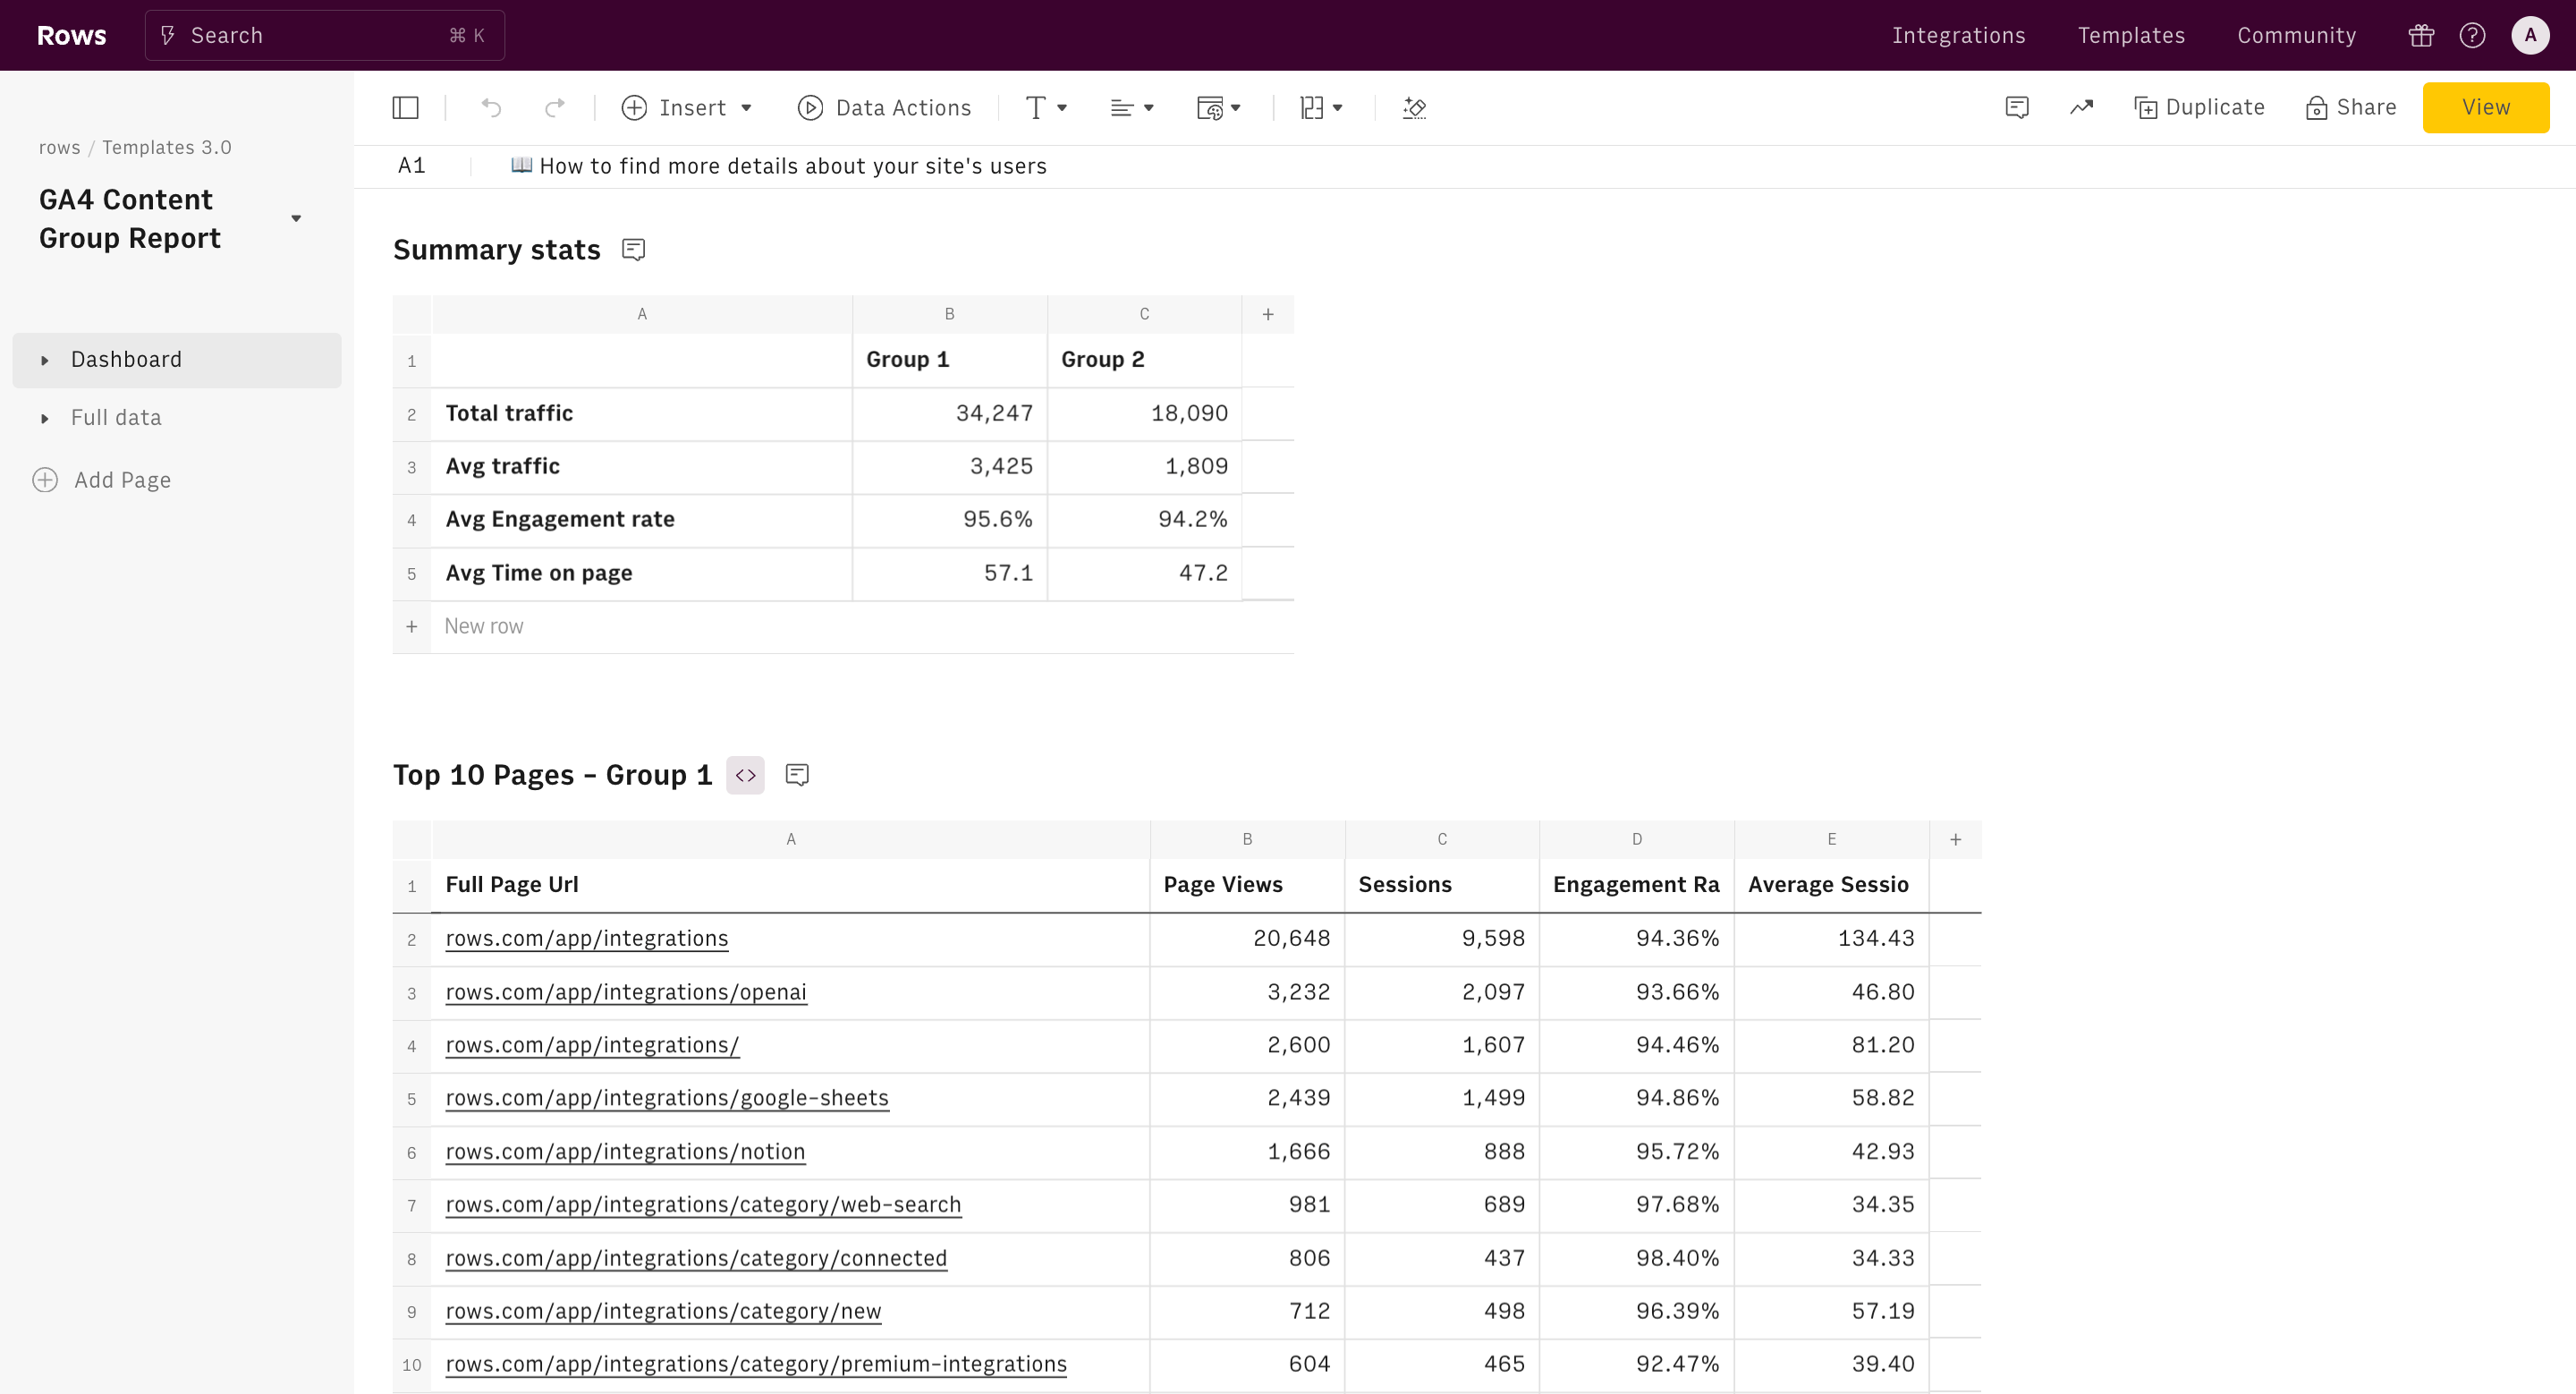
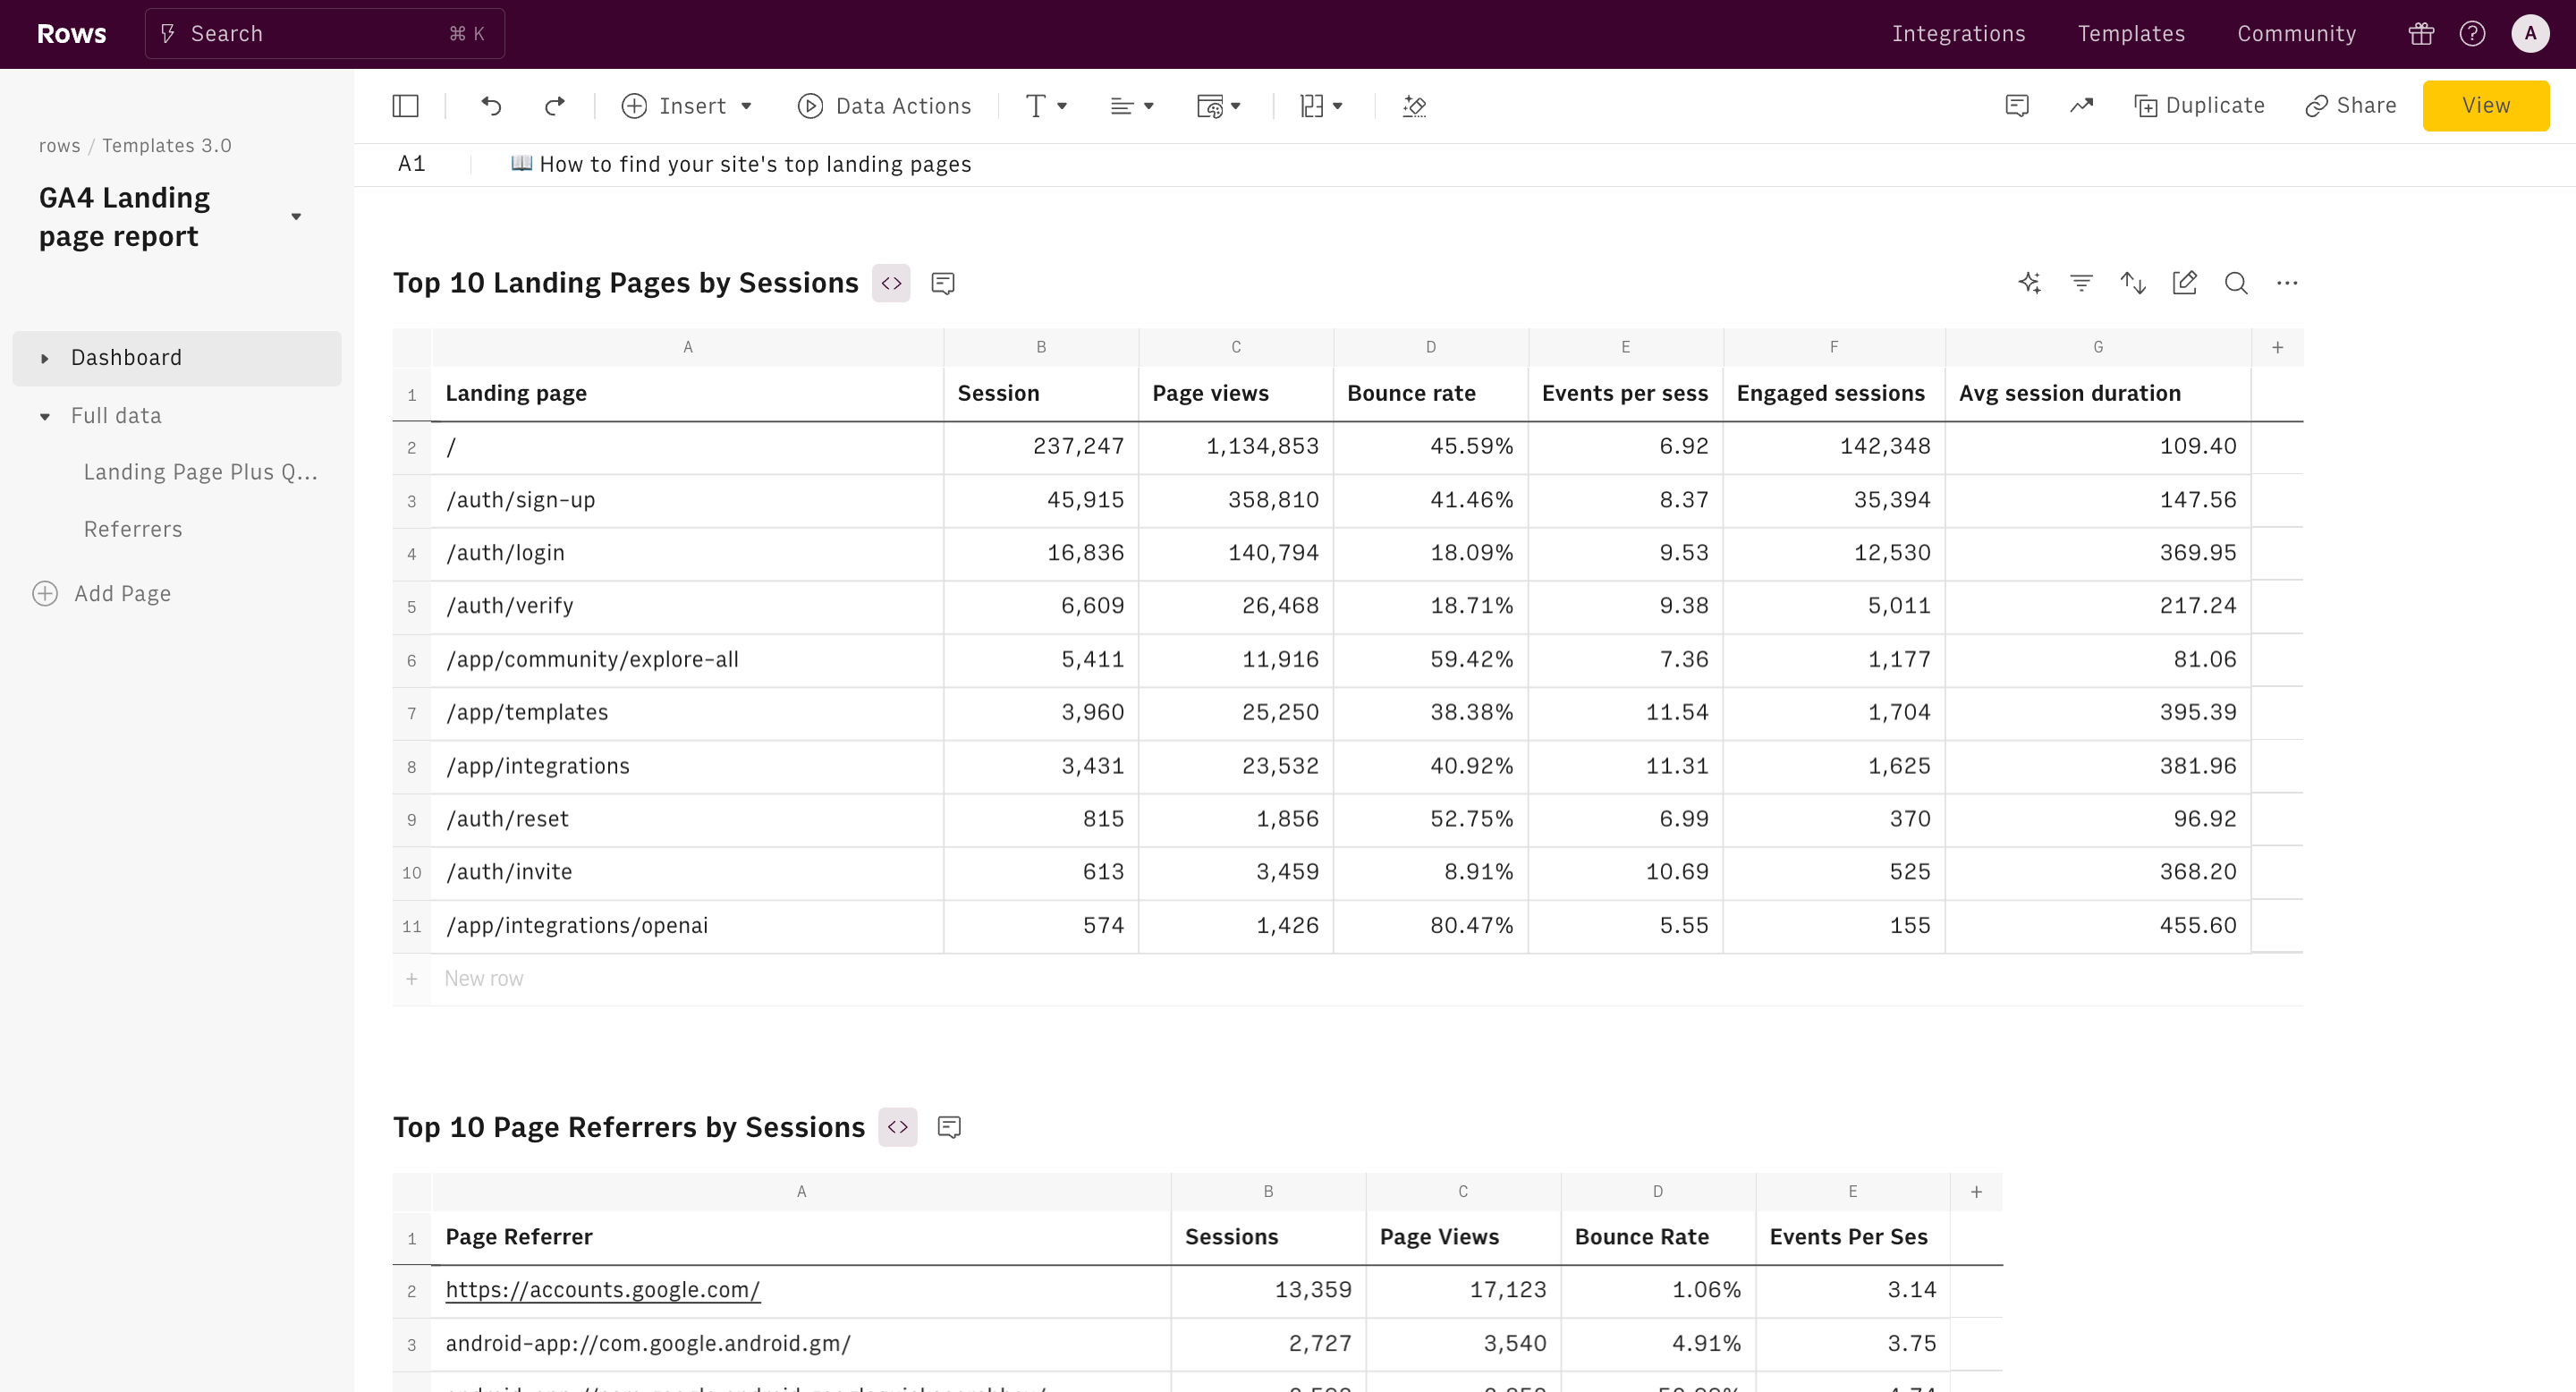
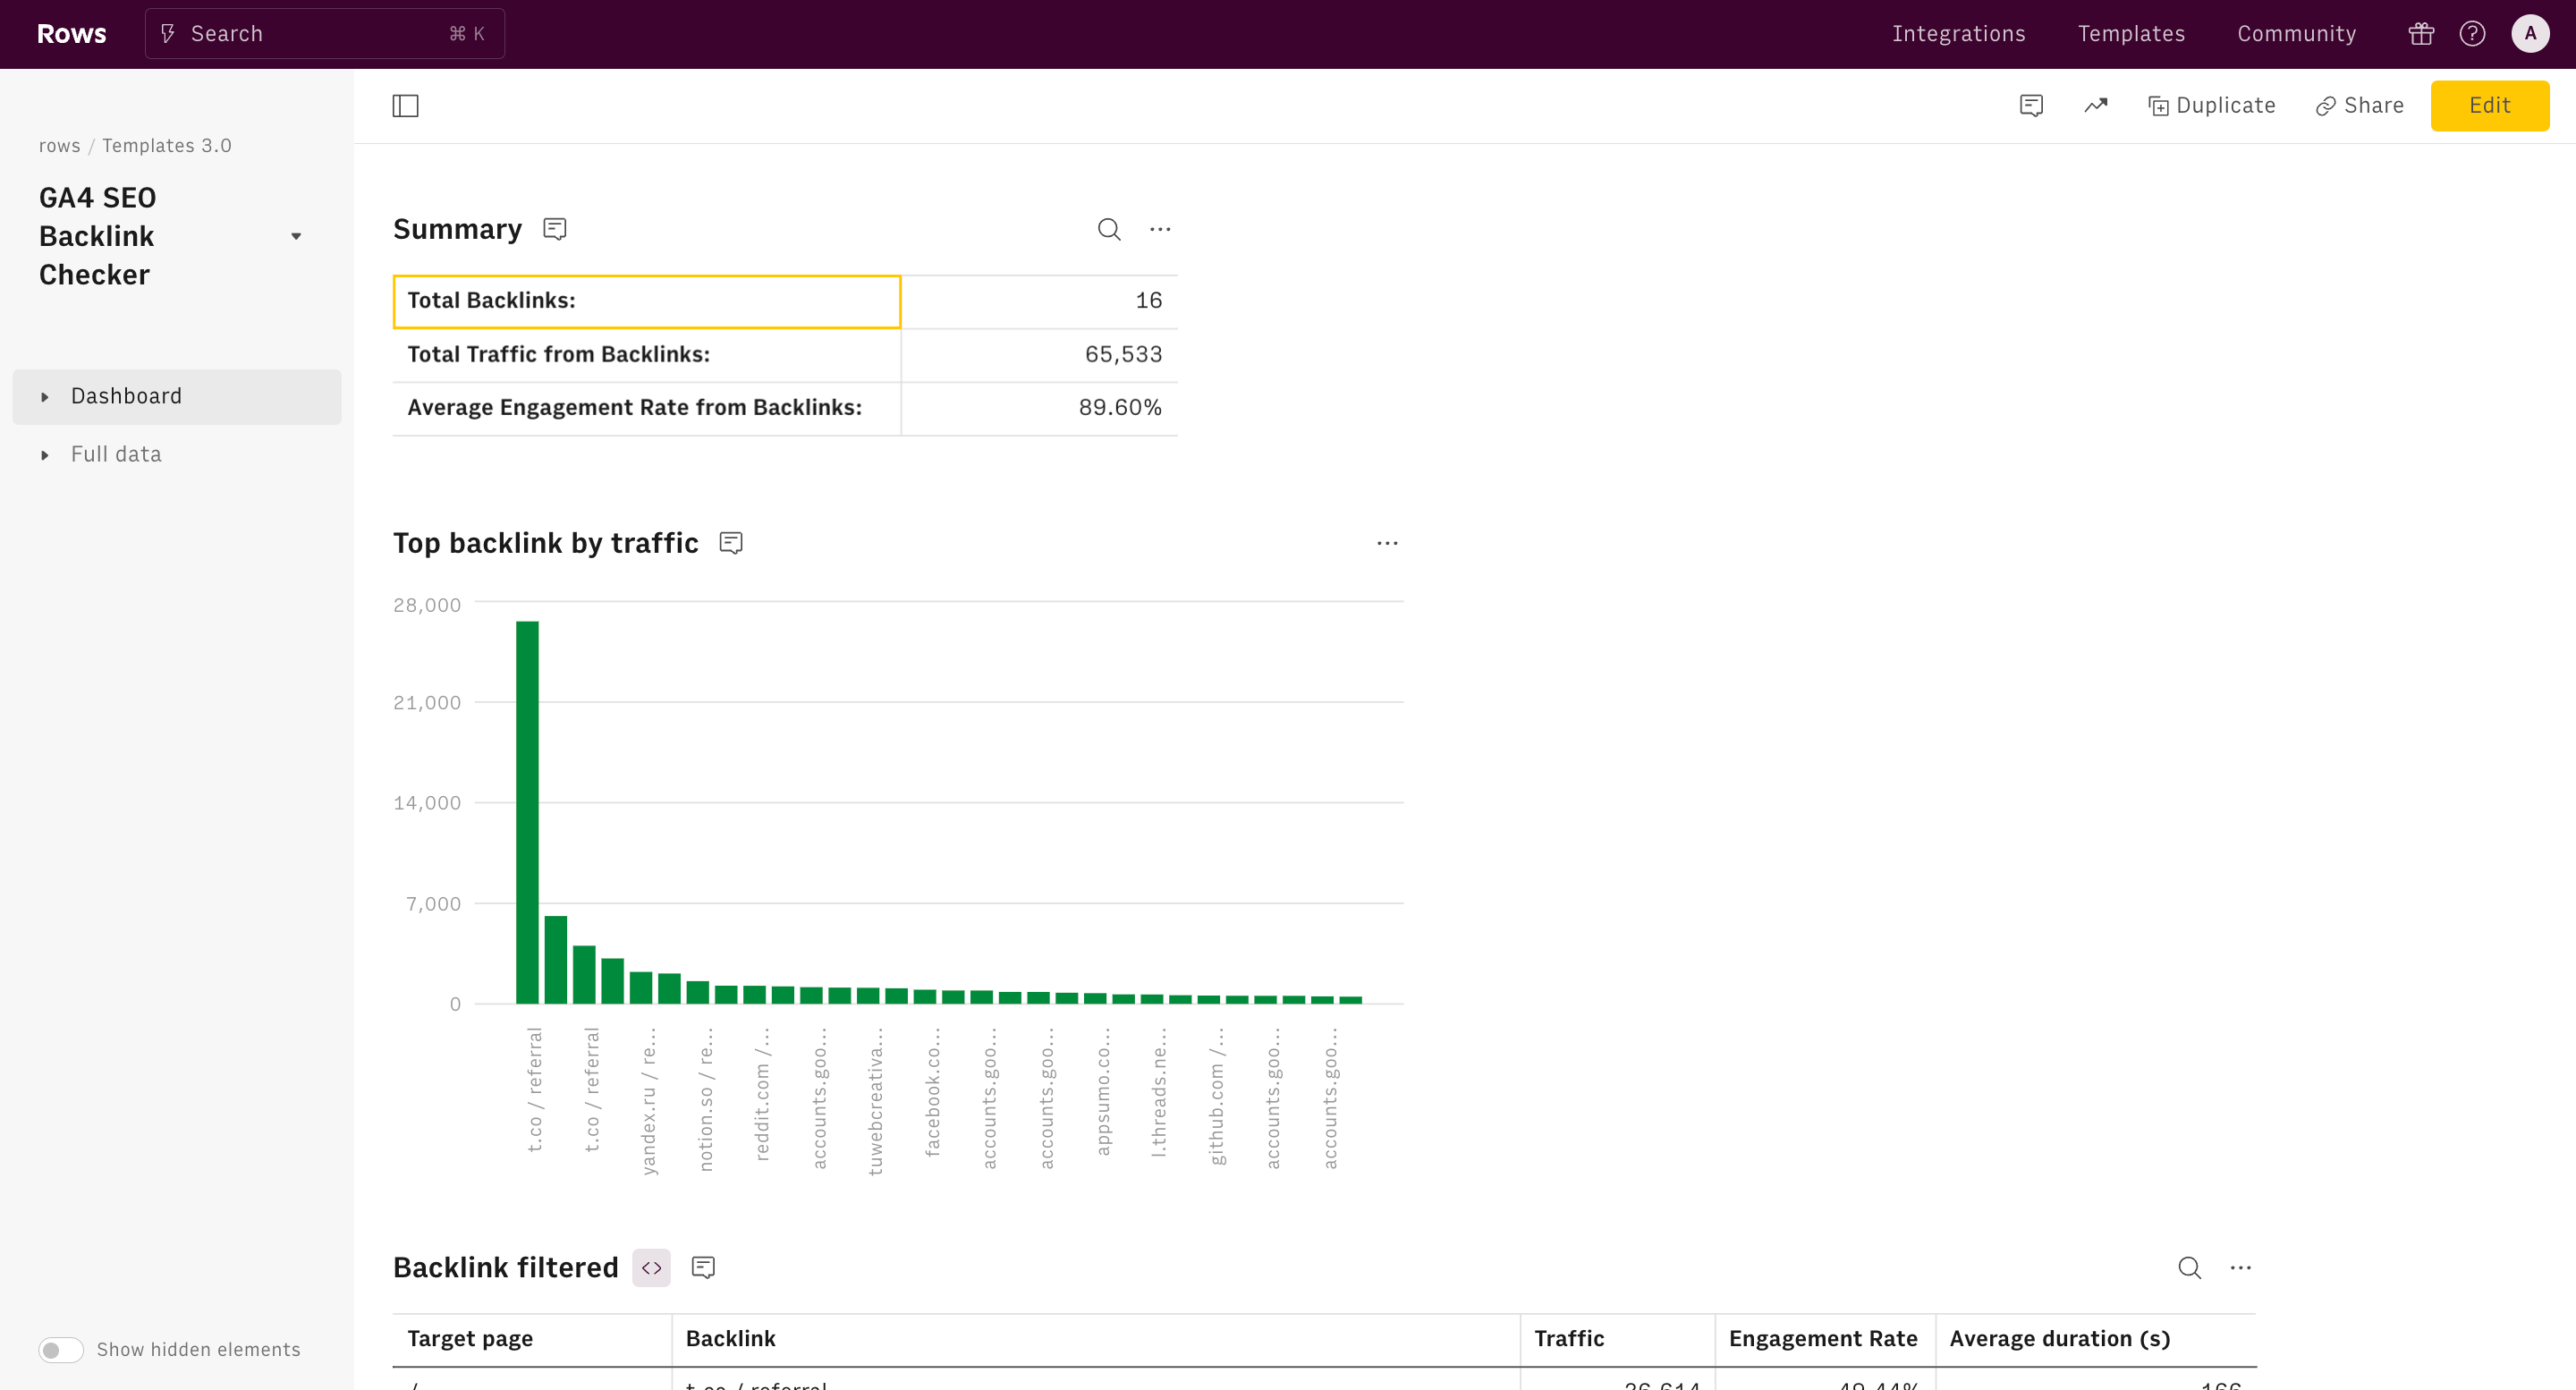
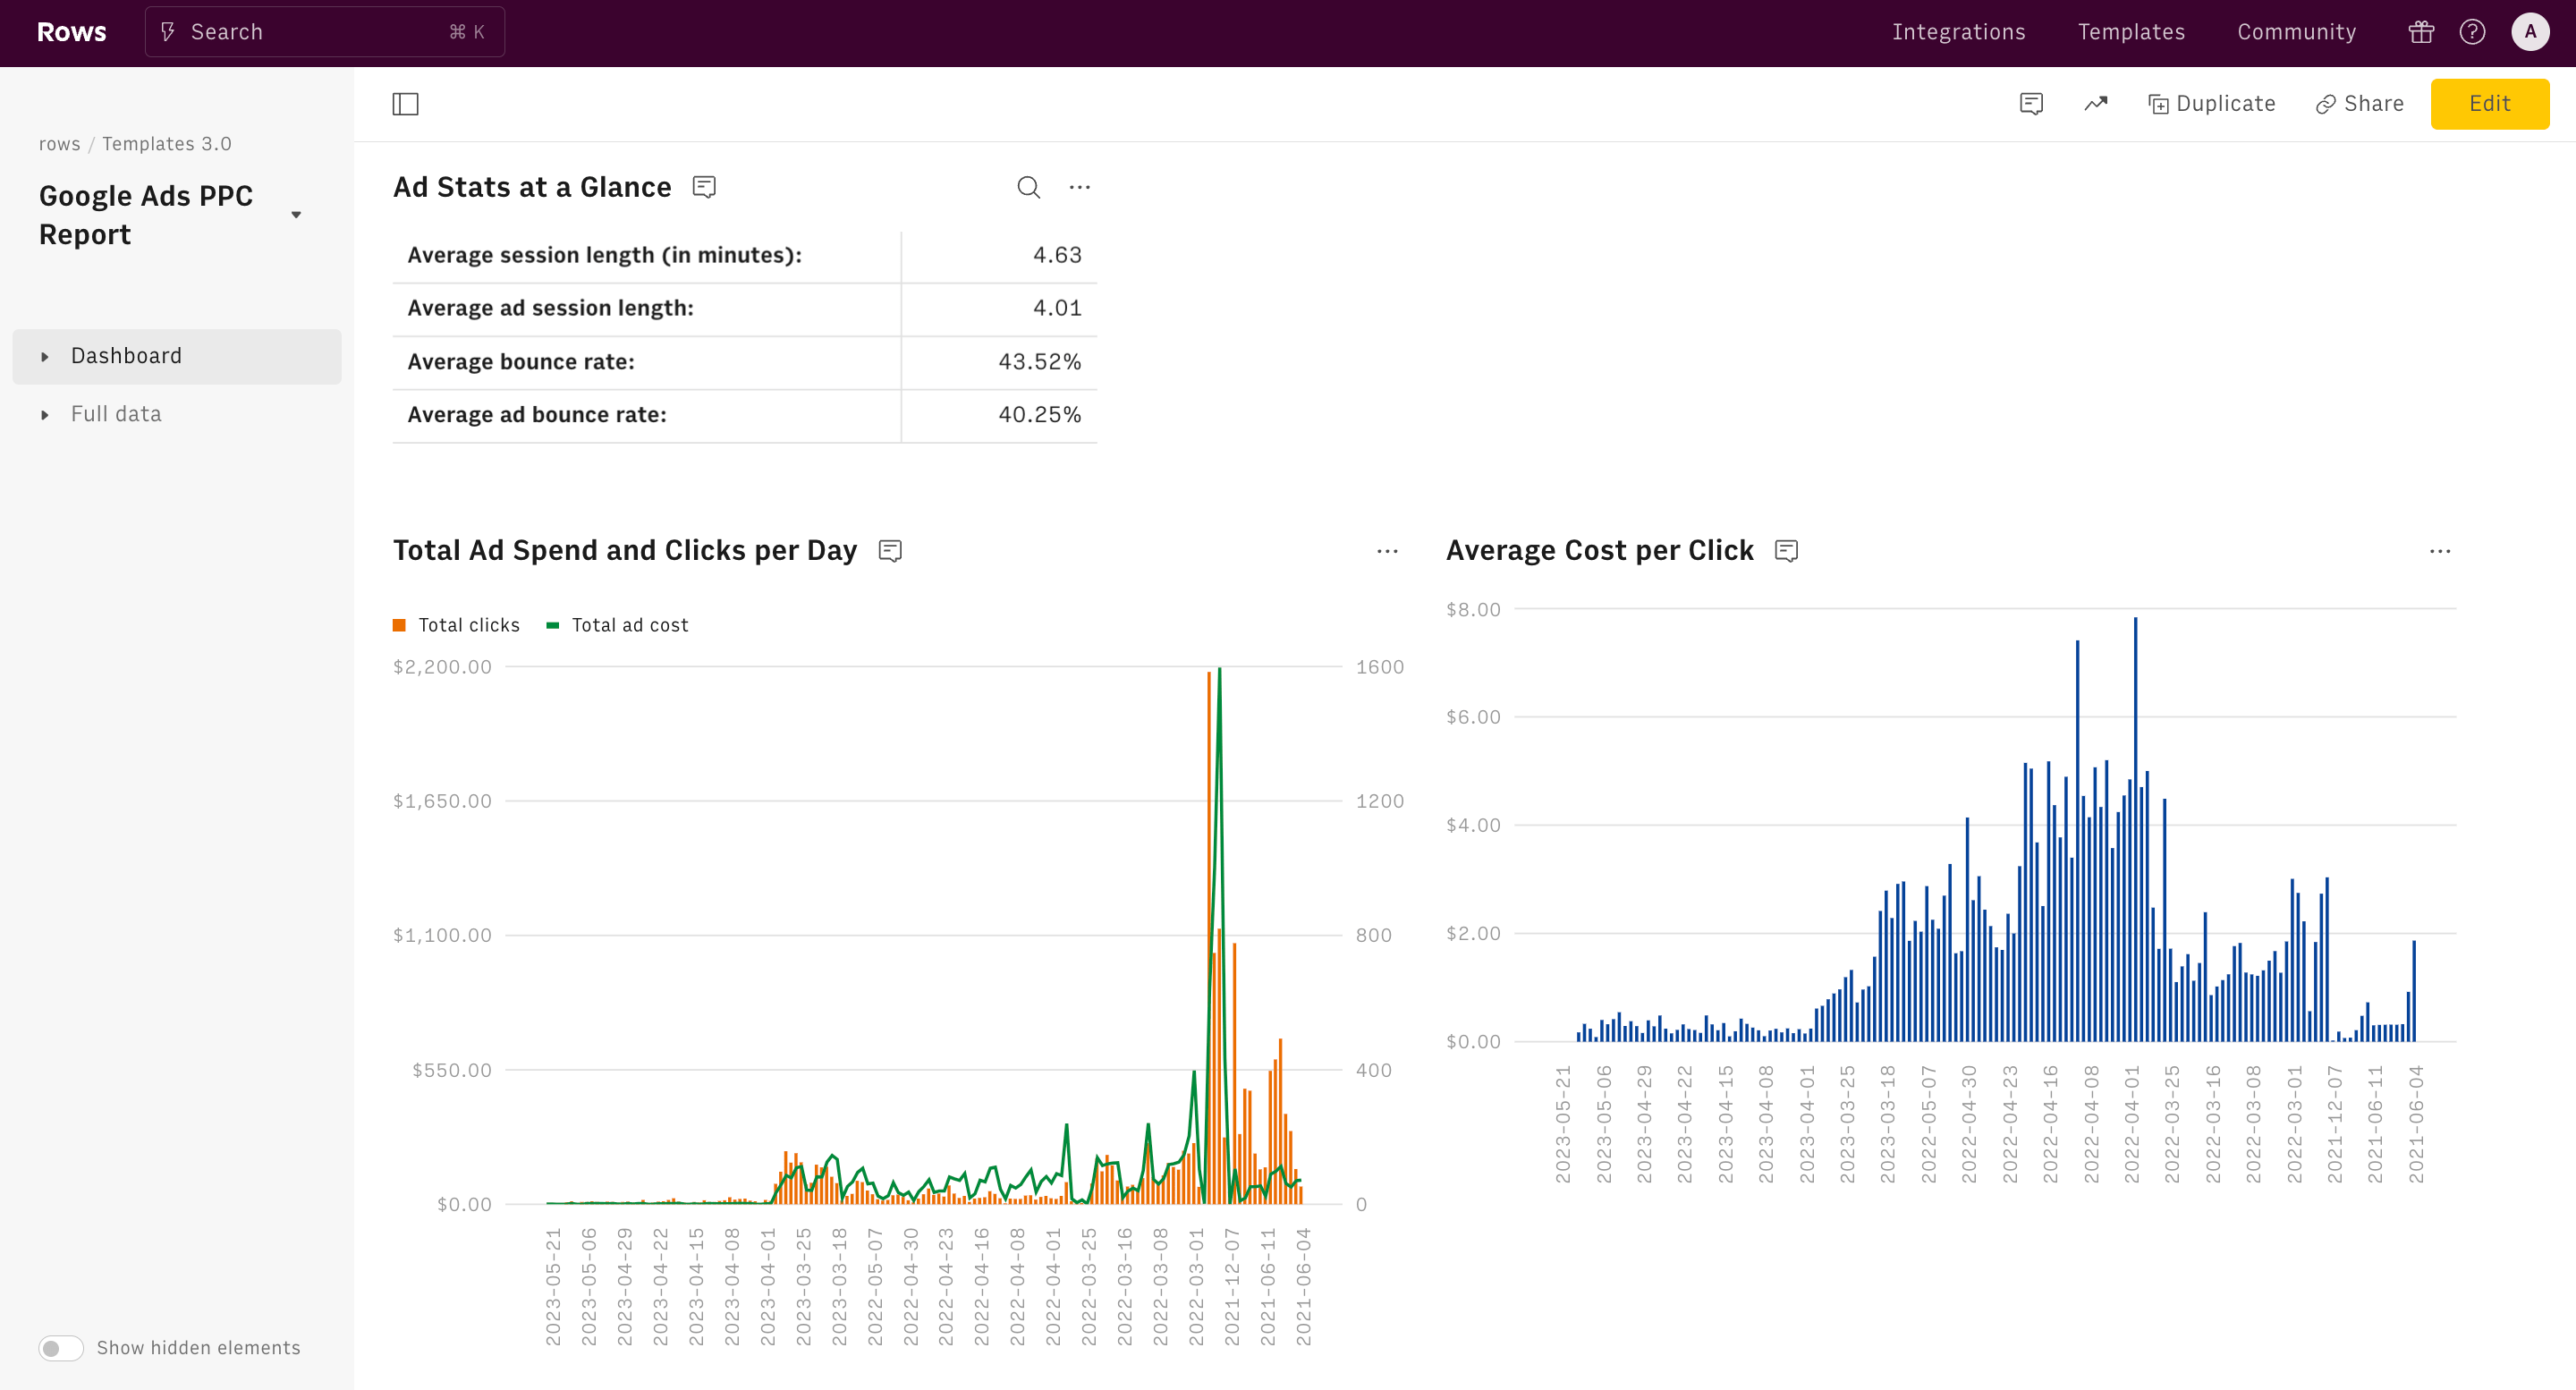
- Multiple Views and Breakdowns: Enjoy the convenience of having multiple views and breakdowns with charts simultaneously, without the need to tweak and interact with complex dashboards.
- Customizable: Tailor the template to fit your unique business needs and goals.
Ready to take your data analysis to the next level? Use our GA4 Purchase Journey Report template now and start uncovering the insights hidden within your GA4 data. Make informed decisions, optimize your marketing efforts, and boost your conversions with ease.
How it works
How it works
Get started
Click on 'Use template' and start using it right away. No forms, no signup. Your data first.
Connect your Google Analytics account
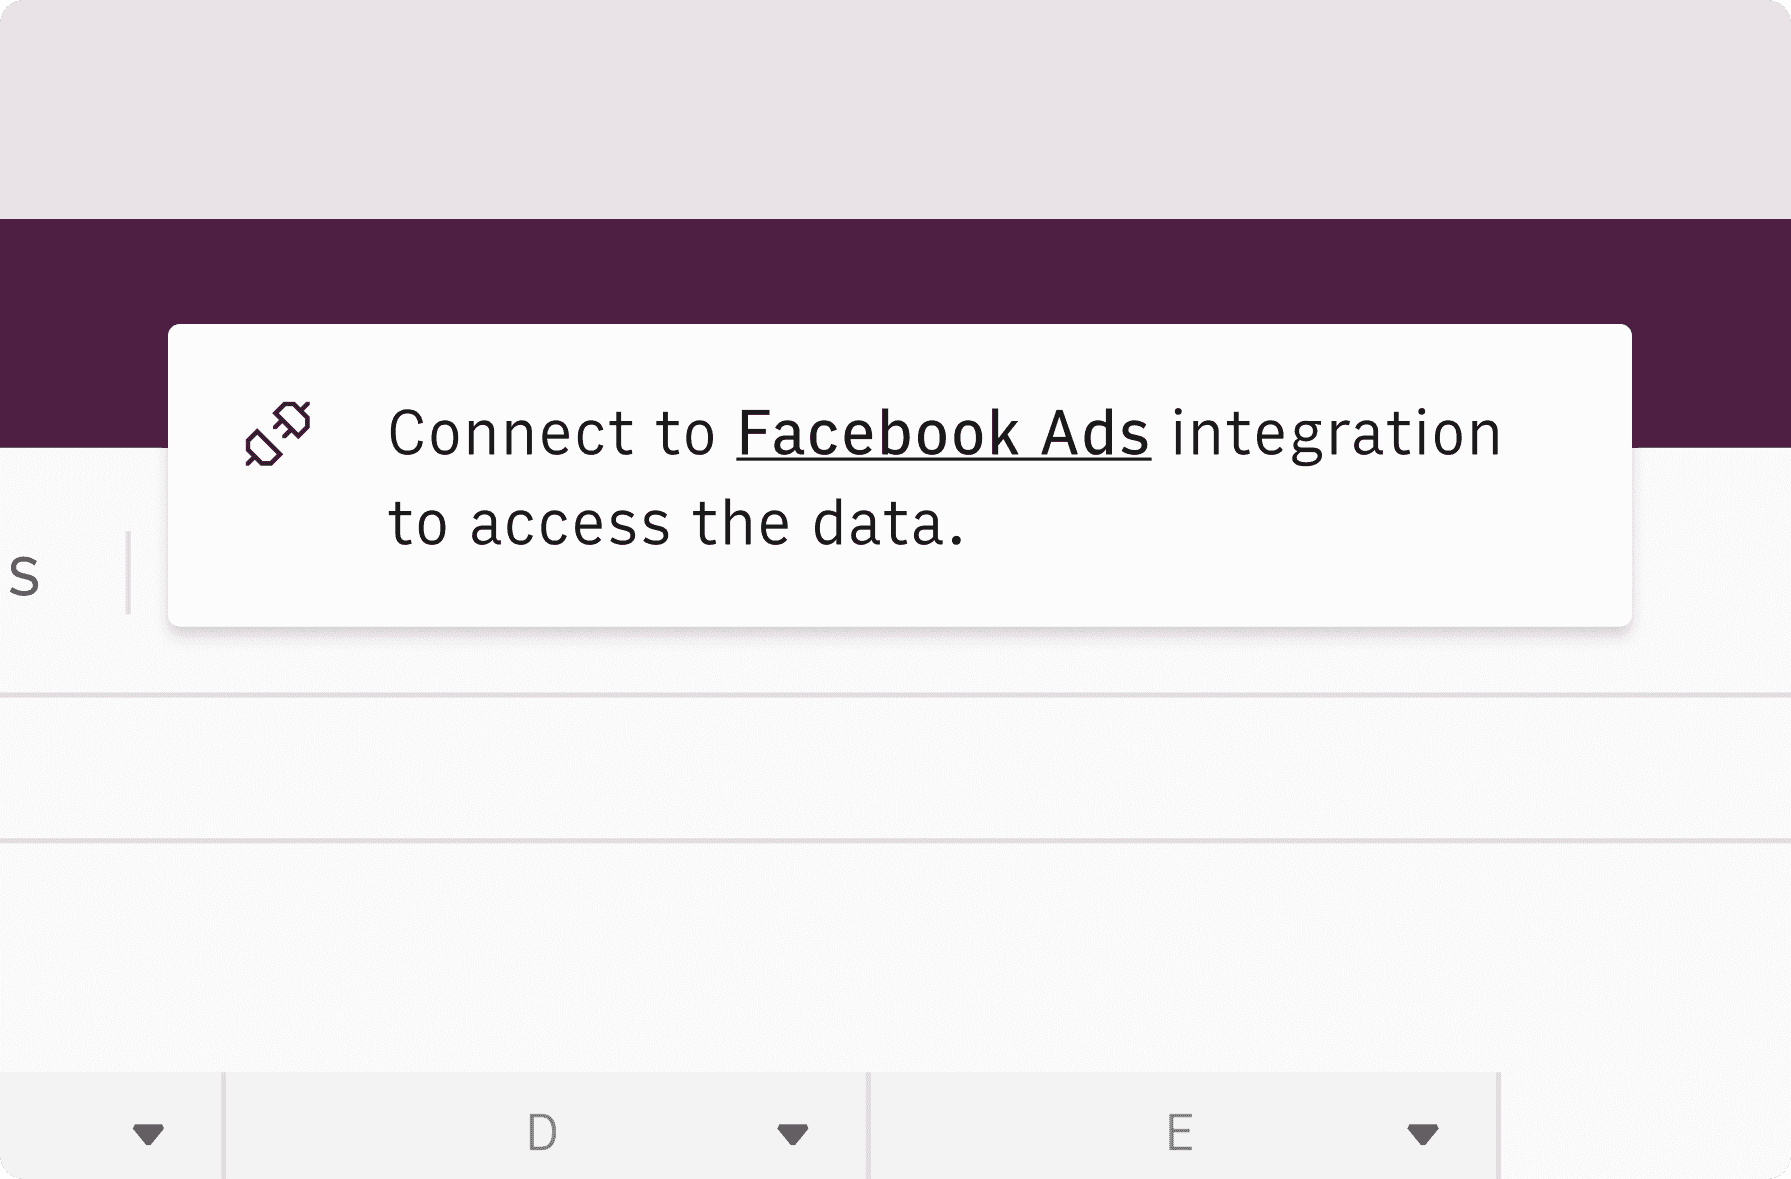
Once landed on the spreadsheet, follow the instructions to connect the required integration and pick your account.
Customize the template and schedule refresh
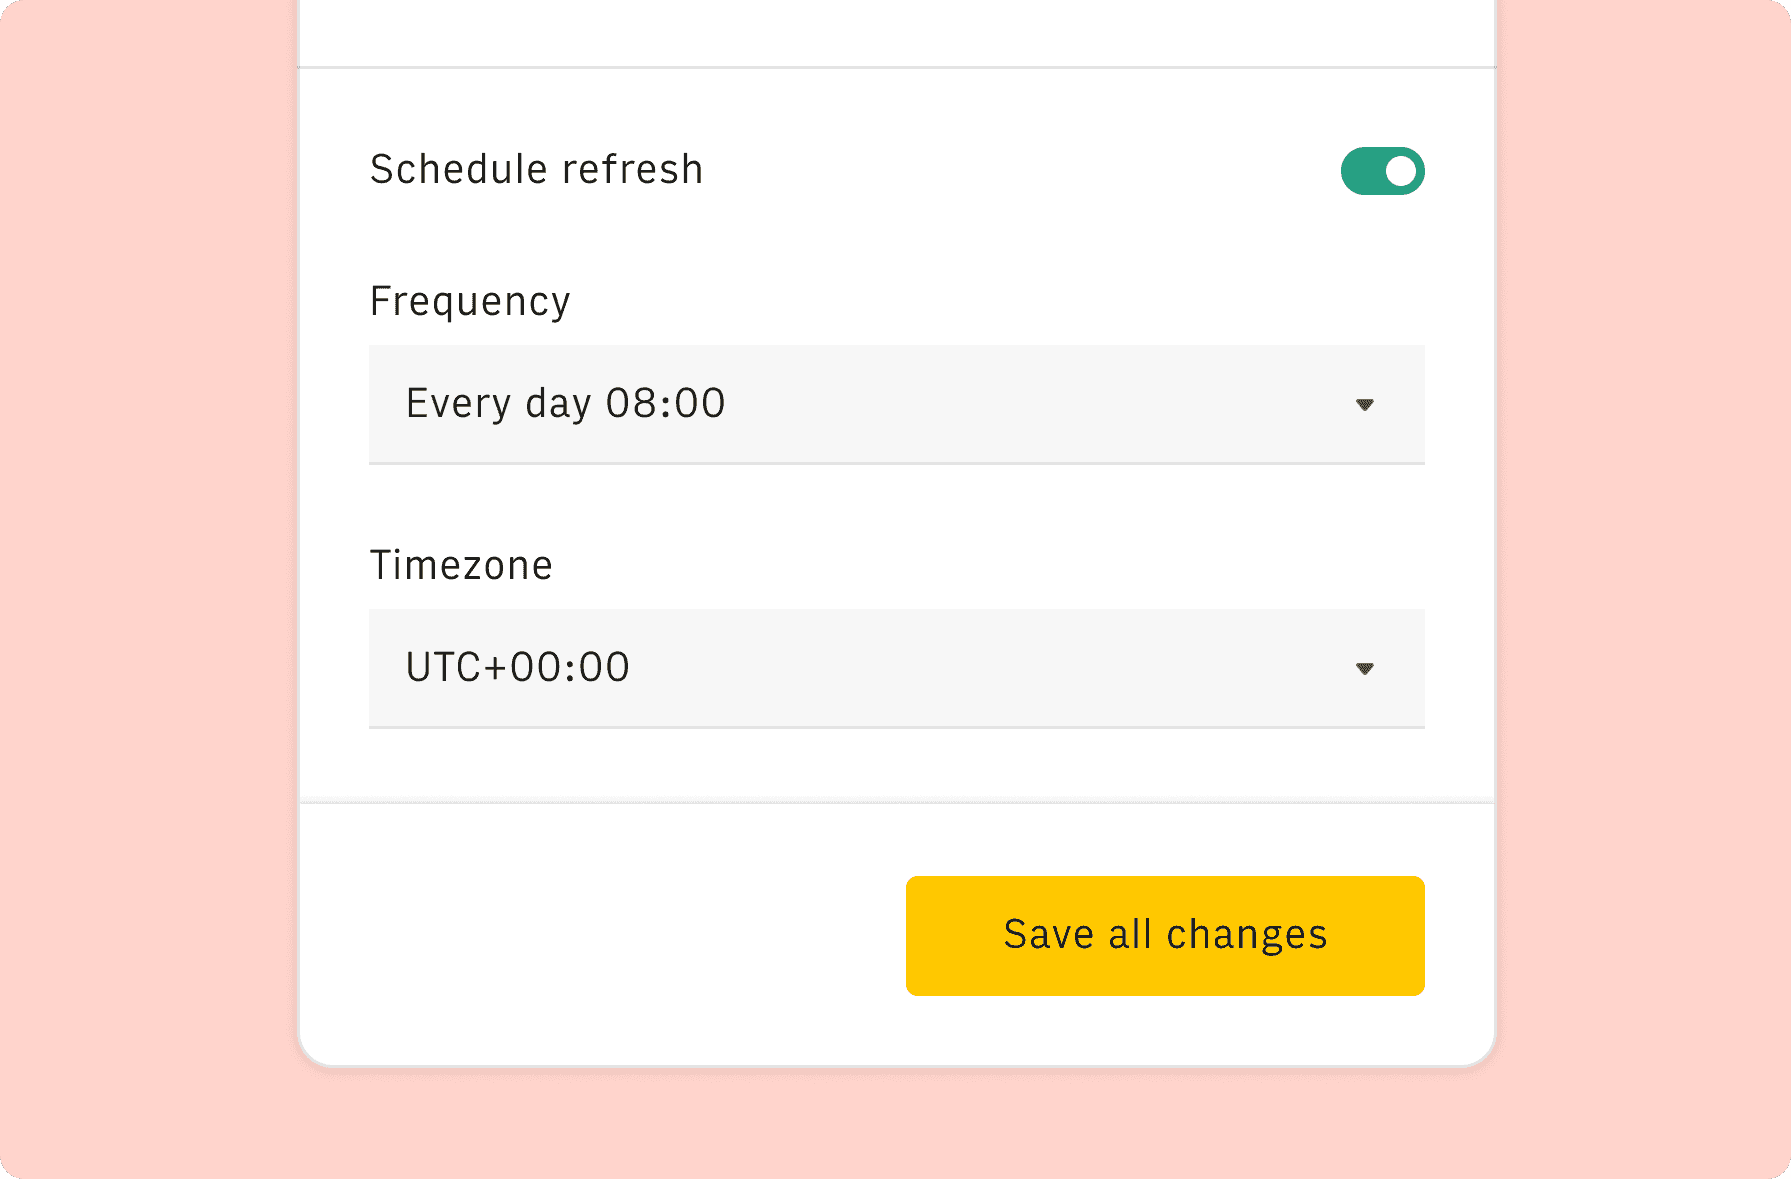
Once the integration has been connected, all tables will update automatically with your own data. Click on 'Edit Source' to change the retrieved data and automate the data refresh. You can then insert a chart or a pivot table, add a column or personalize formats, using all the regular functions and shortcuts that make spreadsheets great.
Embed tables and charts
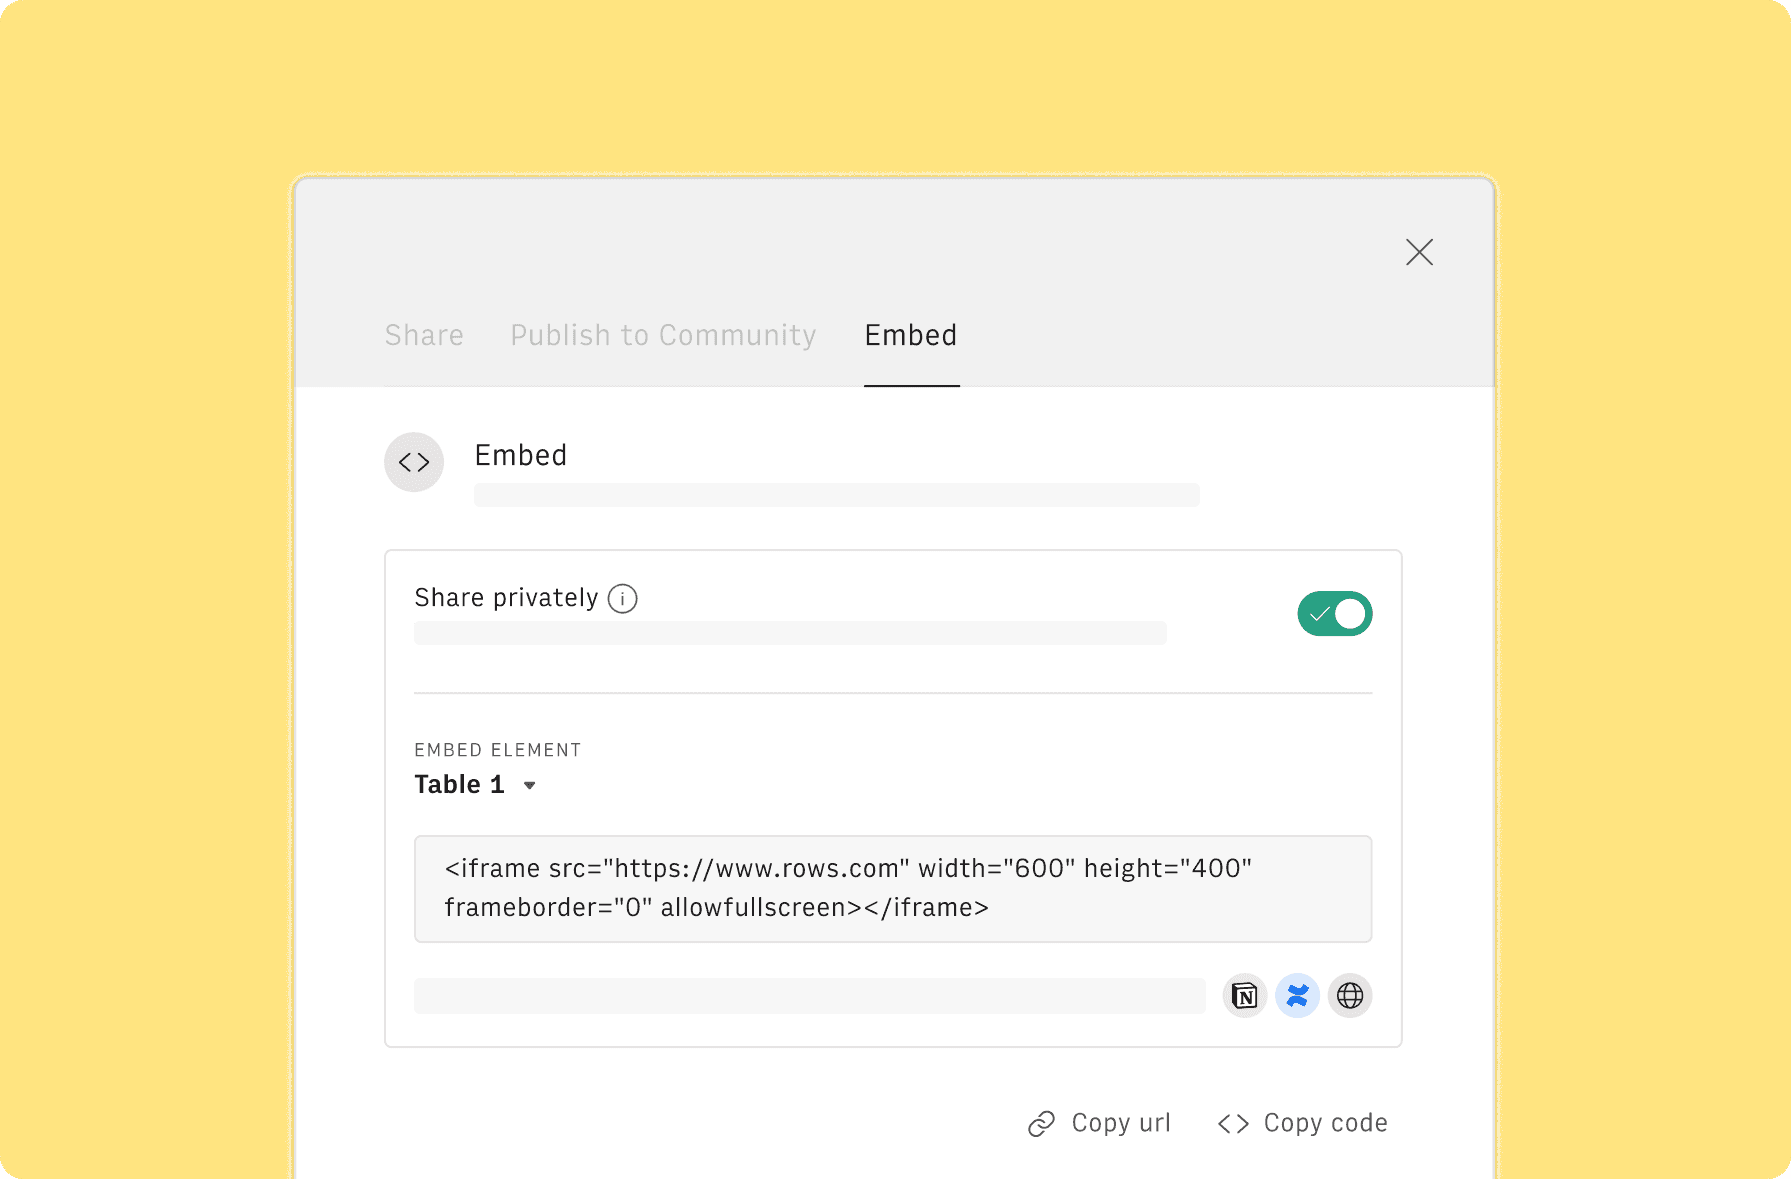
Click on the option menu to embed tables and chart on your Notion, Confluence or any other iframe-ready documents.
Questions and answers
Can I use Rows for free?
More than a Google Analytics 4 Purchase Journey Report
Rows is your new AI Data Analyst. It lets you extract from PDFs, import your business data, and analyze it using plain language.
Signup for free
Import your business data
Extract from PDFs and images, import from files, marketing tools, databases, APIs, and other 3rd-party connectors.
Know moreAnalyze it with AI
Ask AI✨ any question about your dataset - from VLOOKUPs to forecasting models - and surface key insights, trends, and patterns.
Know moreCollaborate and Share
Seamlessly collaborate and share stunning reports with dynamic charts, embed options, and easy export features.
Know more

