Google Analytics 4 Demographics Report
Get a breakdown of your website users by the main demographics variables, such as gender, age, language and interest.

 100% spreadsheet
 Connected to your data
 Daily+ refresh
 Embed everywhere
About Google Analytics 4 Demographics Report
The Google Analytics 4 Demographics Report is designed to empower your data-driven decisions by providing in-depth insights into your website's audience.
This template simplifies navigating through various GA4 data points and insights, providing simultaneous views of the key demographic variables of your website's active users in a clear, digestible format.
The detailed demographic breakdowns enable you to make informed decisions that enhance user experience and drive engagement. Whether you're a marketer, analyst, or business owner, this template is tailored to help you understand your visitors better and optimize your strategies accordingly.
What You’ll Find in This Template
Our template integrates with Google Analytics 4, ensuring you have access to the your website data. It comprises the following components:
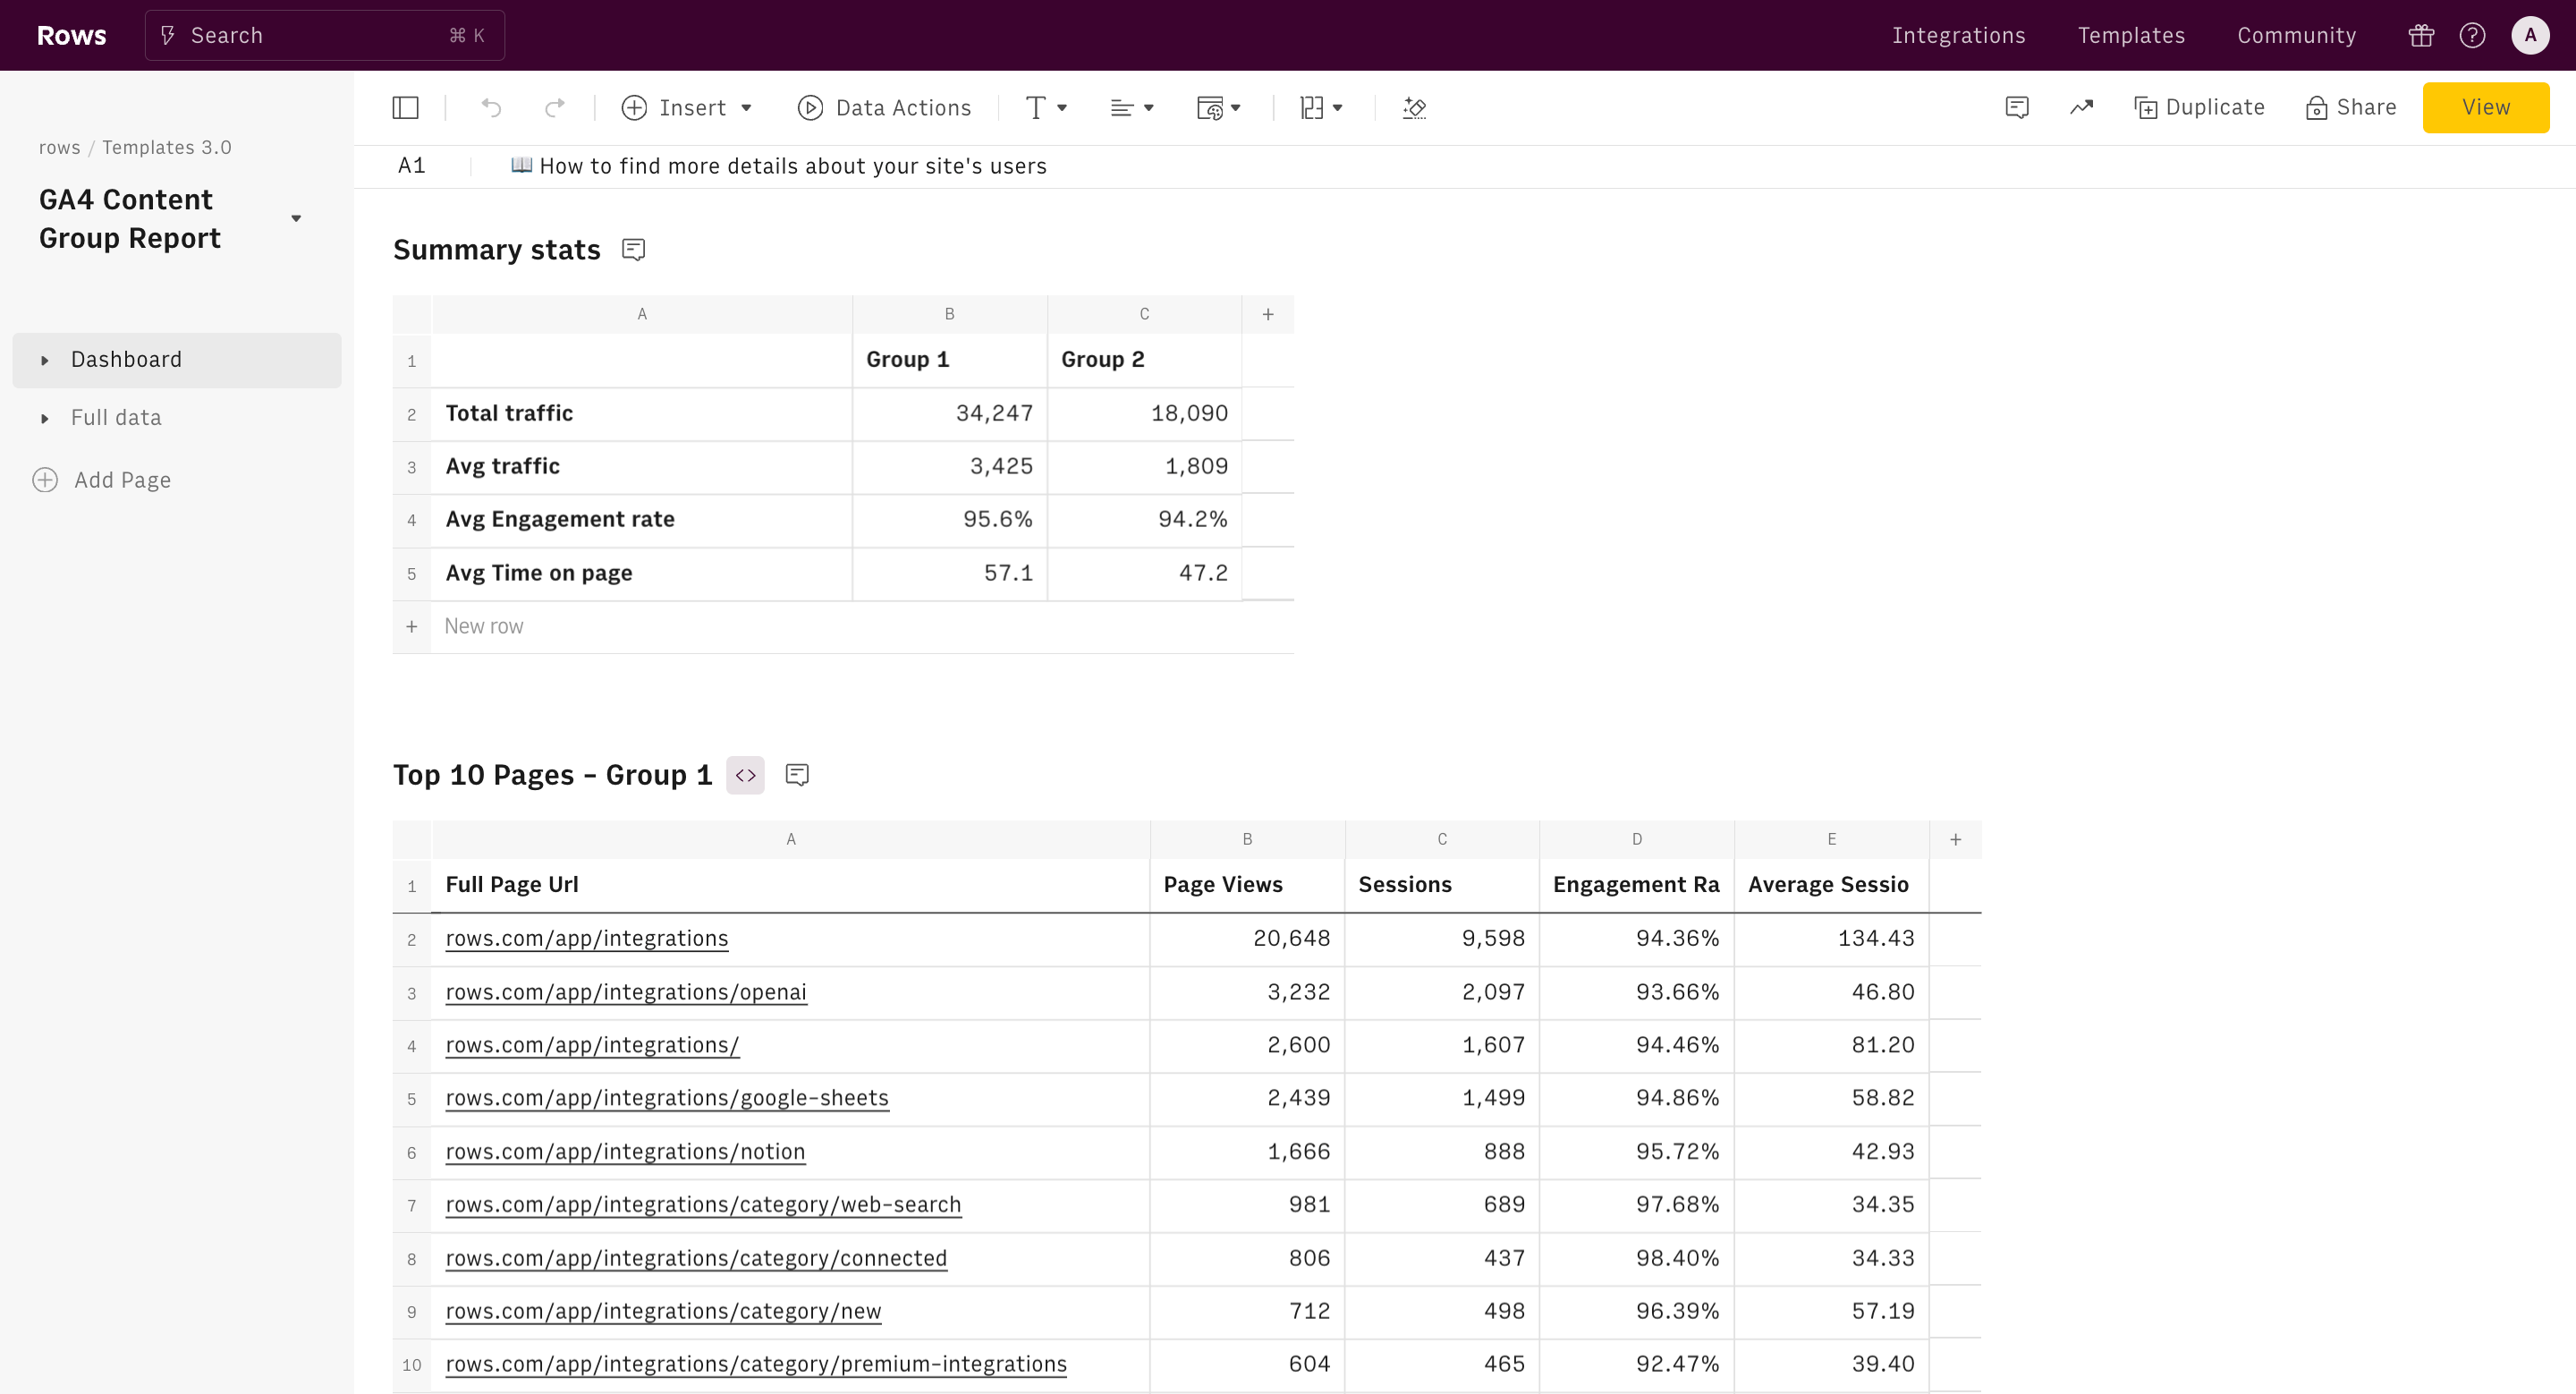
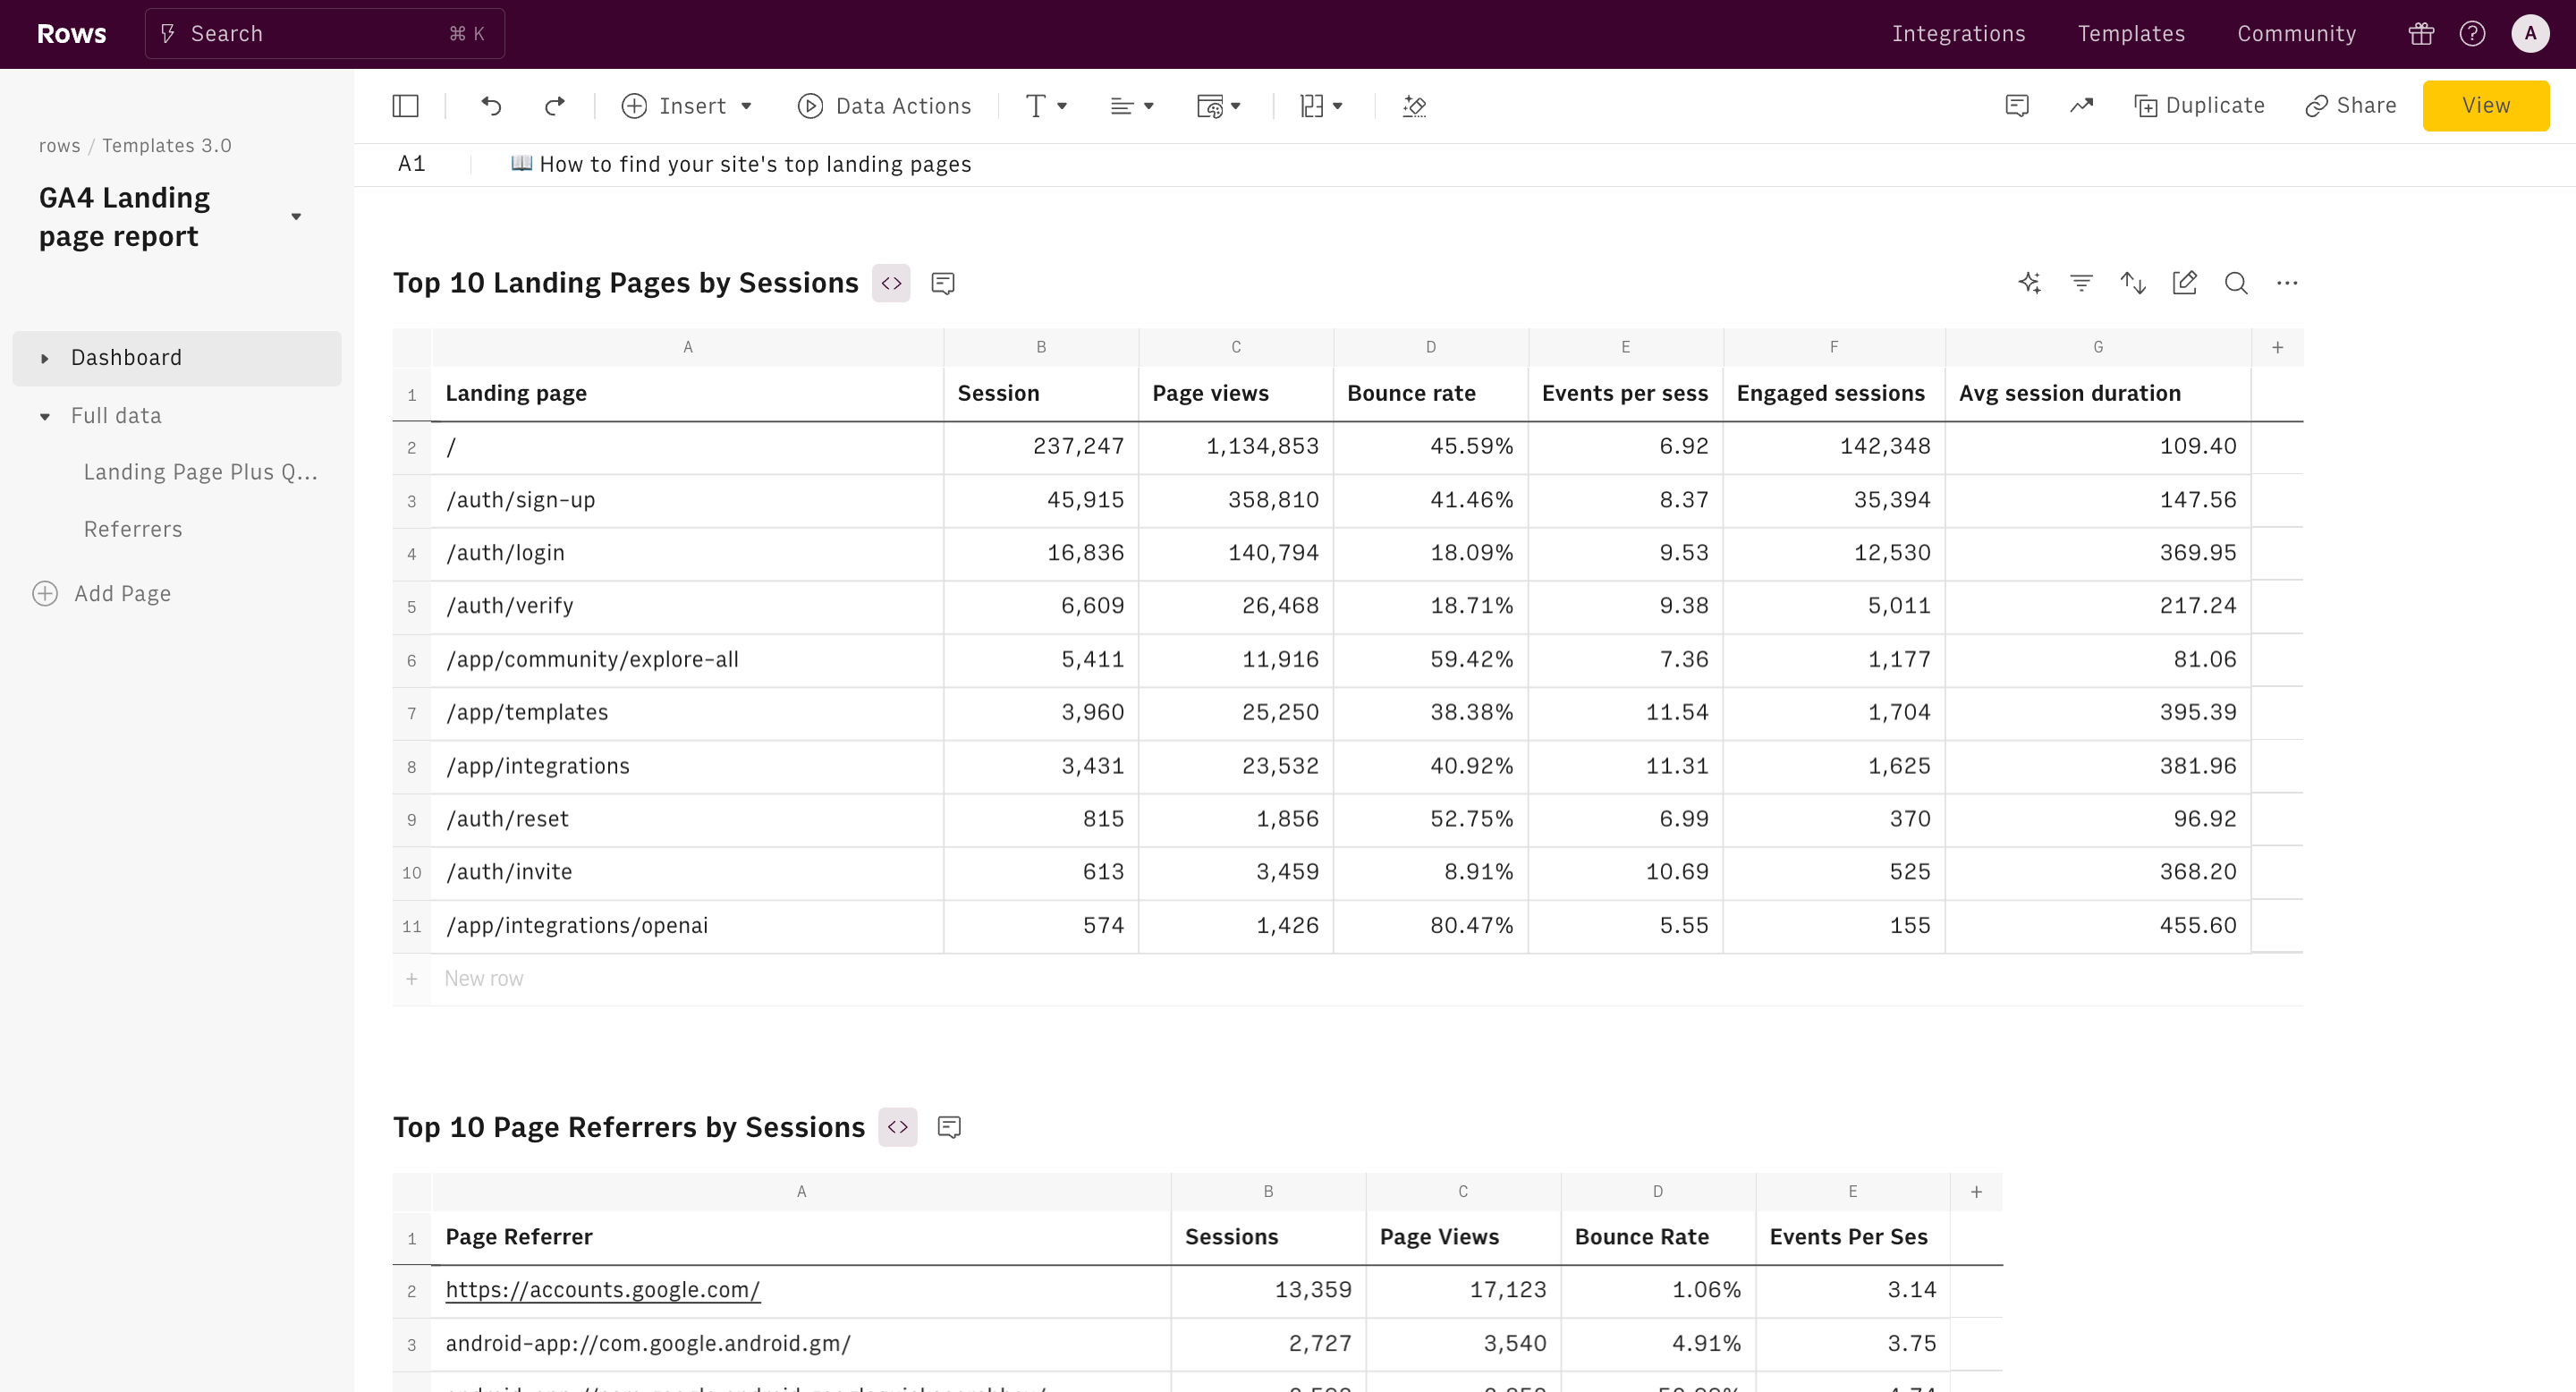
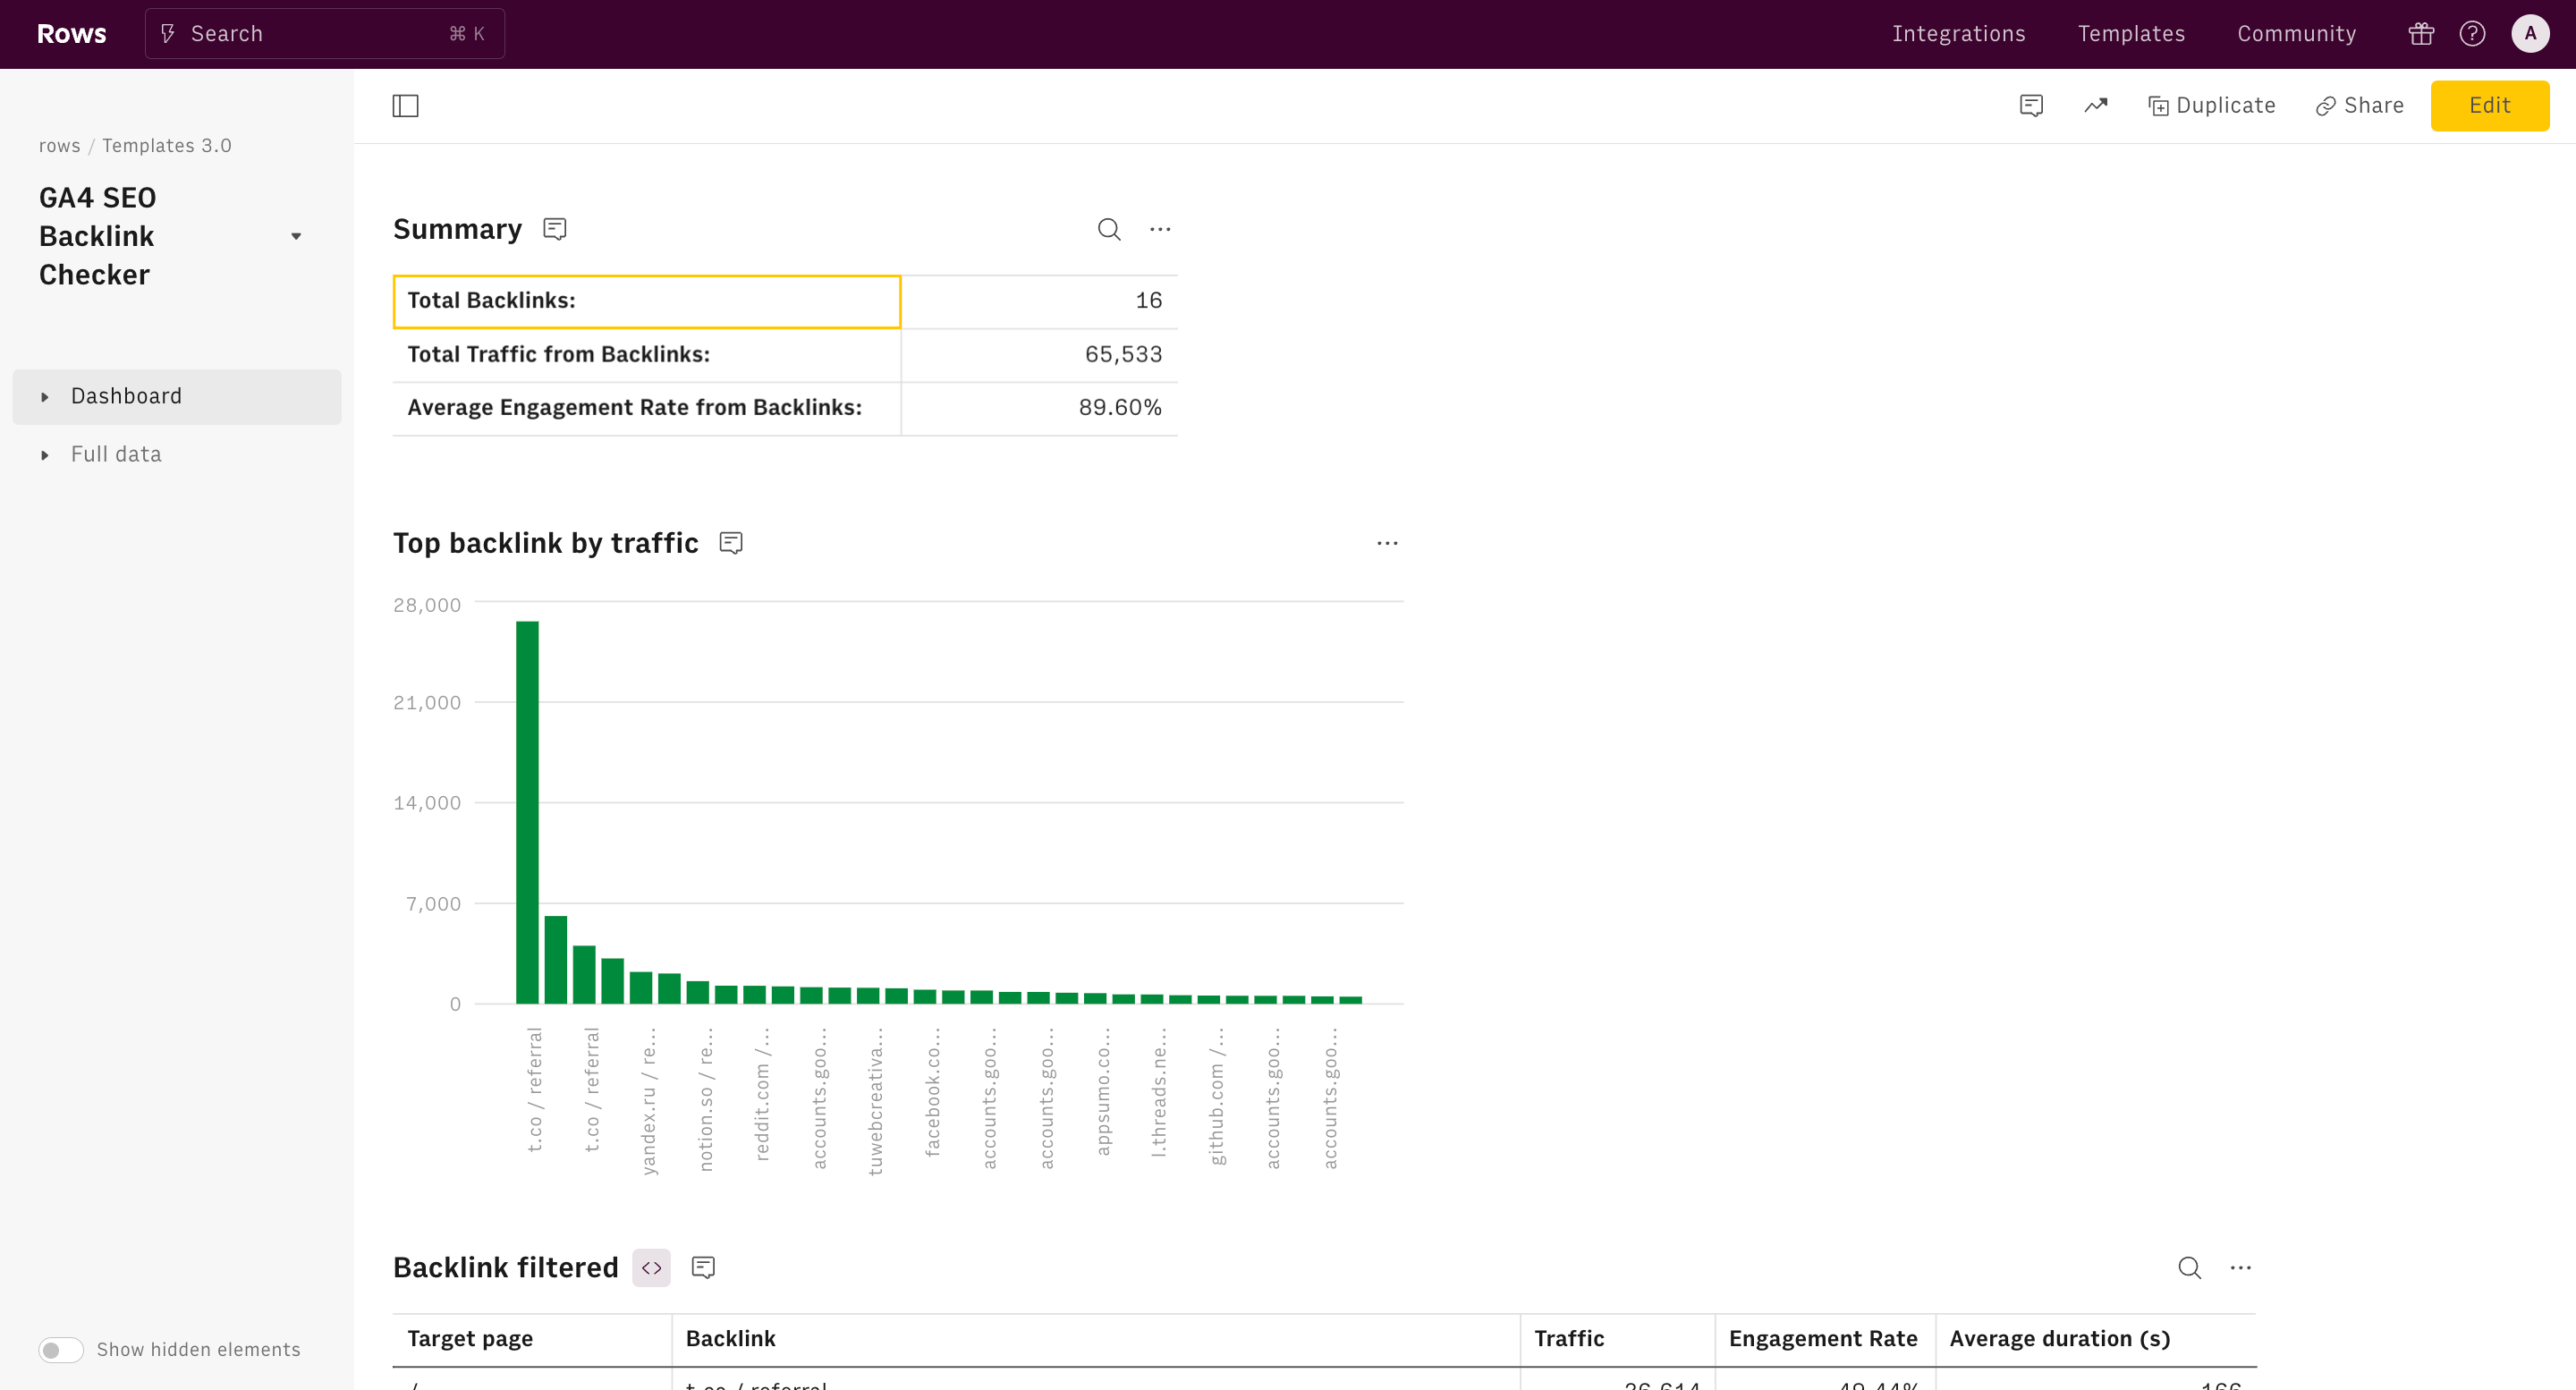
Breakdown of Total Traffic: Gain a clear picture of your website’s performance with detailed breakdowns of active users.
Age Distribution: Understand the age groups that are most engaged with your content. This information is crucial for tailoring your marketing strategies to meet the needs of different demographics.
Gender Insights: Discover the gender distribution of your audience. Use this data to create more targeted and effective marketing campaigns.
Interests Analysis: Learn about the interests and preferences of your visitors. This helps in crafting content and offers that resonate with your audience’s passions and hobbies.
Language Distribution: Identify the primary languages spoken by your users. This is particularly useful for businesses targeting a global audience or considering multilingual content strategies.
Ideal Persona and Practical Use Cases
Our Google Analytics 4 Demographics Report Template is ideal for digital marketers, business analysts, content creators, and e-commerce managers who are keen on understanding their audience to refine their strategies.
If you're a digital marketer aiming to create more targeted ad campaigns, a business analyst looking to report on user engagement trends, a content creator wanting to tailor content to audience preferences, or an e-commerce manager seeking to optimize product offerings for different demographic segments, this template is for you.
Practical Use Cases:
- Digital Marketing Campaigns: Use age and gender data to create highly targeted ads that resonate with specific demographic groups, increasing your campaign's effectiveness.
- Content Strategy: Tailor your blog posts, videos, and other content to the interests and languages of your audience, boosting engagement and user retention.
- Product Development: Analyze demographic data to identify trends and preferences, helping you develop products that meet the needs of your target market.
- Customer Experience: Enhance your website’s user experience by understanding the language preferences of your audience, ensuring that your content is accessible and engaging for a global user base.
- Market Expansion: Use demographic insights to identify new market opportunities and potential areas for business growth, allowing you to expand your reach effectively.
By leveraging the comprehensive insights provided by our template, you can make informed, strategic decisions that drive growth and success for your business.
How it works


How it works
Get started
Click on 'Use template' and start using it right away. No forms, no signup. Your data first.
Connect your Google Analytics account
Once landed on the spreadsheet, follow the instructions to connect the required integration and pick your account.
Customize the template and schedule refresh
Once the integration has been connected, all tables will update automatically with your own data. Click on 'Edit Source' to change the retrieved data and automate the data refresh. You can then insert a chart or a pivot table, add a column or personalize formats, using all the regular functions and shortcuts that make spreadsheets great.
Embed tables and charts
Click on the option menu to embed tables and chart on your Notion, Confluence or any other iframe-ready documents.


Questions and answers
Can I use Rows for free?
More than a Google Analytics 4 Demographics Report
Rows is your new AI Data Analyst. It lets you extract from PDFs, import your business data, and analyze it using plain language.
Signup for free

Import your business data
Extract from PDFs and images, import from files, marketing tools, databases, APIs, and other 3rd-party connectors.
Know moreAnalyze it with AI
Ask AI✨ any question about your dataset - from VLOOKUPs to forecasting models - and surface key insights, trends, and patterns.
Know moreCollaborate and Share
Seamlessly collaborate and share stunning reports with dynamic charts, embed options, and easy export features.
Know more