If you’re interested in Rows the chances are you’ve used some kind of other spreadsheet application before. You might be asking yourself, “should I use this instead of Excel?” “Do I have to learn a whole bunch of new stuff”, “How easy is it to switch?”
To get your bearings, it helps to compare Rows functionality to the equivalent functionality in other spreadsheets applications. We’ll do that in a moment, but first off, we need to address a burning question:
What should you learn first and why?
If you know your way around Google Sheets or Microsoft Excel, you’ll get the hang of Rows pretty quickly. Even if you’re a spreadsheet novice, we’ve tried to make the learning process as simple as possible.
However, regardless of your experience level, there are a few key topics that are worth reading up on, because they’re fairly unique to Rows.
| Topic | Why You Should Learn It |
|---|---|
| “Live” view and “Edit” view | Sharing a spreadsheet in Rows is not like sharing a spreadsheet in other applications. You have much greater control over what people can see and do in the “live” view. This is because you can use Rows to build responsive, mobile-friendly applications that people can access on multiple devices. What to read: |
| Templates and Integrations | You can use our templates and integrations to connect your core business tools and APIs. Templates, in particular, are a great introduction to the top use cases that Rows was designed for and they contain example implementations of our more popular integrations. What to read: |
| {Data} cells and Data Tables | Did you know that you can pull data from Google Analytics store an entire report in one cell? It’s a pretty unusual concept, but it makes perfect sense once you understand how{data} cells work. You can think of{data} cells as a place to park external data before you turn that data into something useful. You can then convert this raw data into an easy-to-readData Table , which lets you eyeball the data and focus on the data points that you’re interested in.What to read: |
Comparing Excel and Google Sheets to Rows
Here, we'll look at the standard spreadsheet features as well as special features that aren't easy to compare one-to-one.
Standard Features
First, let’s take a look at the standard features you would expect in a spreadsheet application and how Rows compares to Google Sheets or Excel.
Basic spreadsheets and tables
Rows is a spreadsheet application, so of course, we have the standard features you might be familiar with in other types of spreadsheet software. However, we also have a different concept for how a spreadsheet is organized.
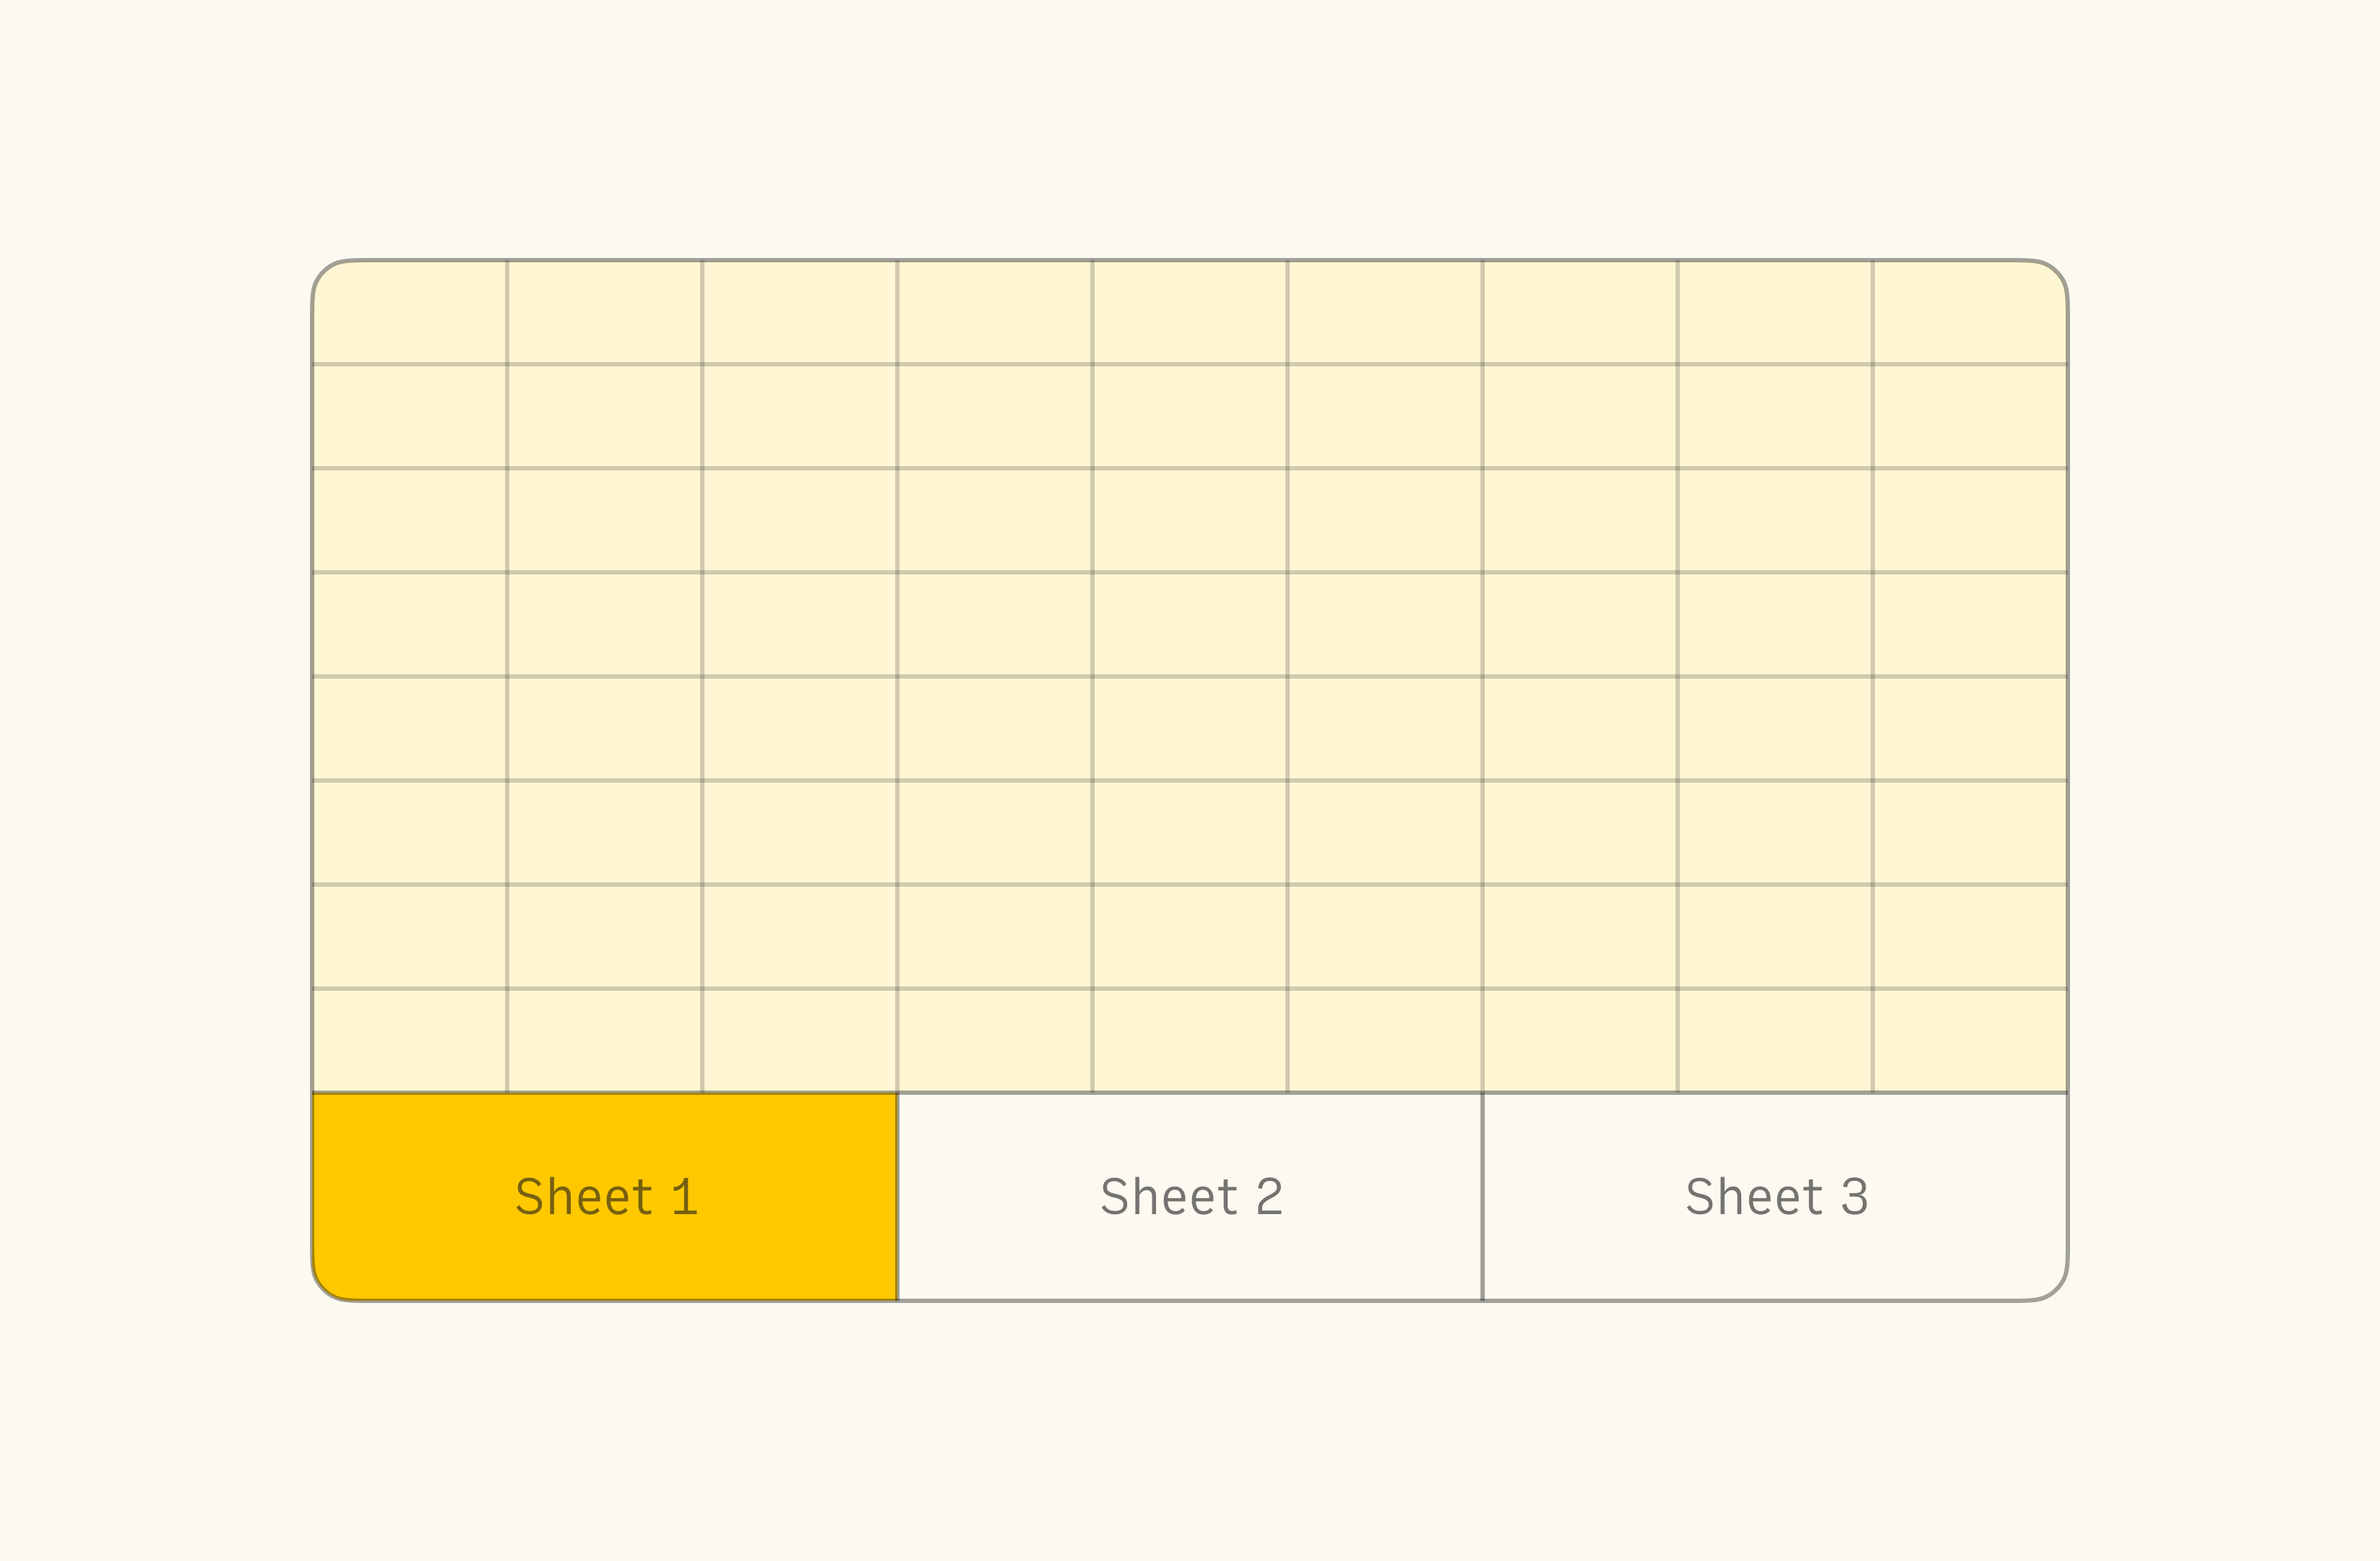
In Excel and Google Sheets
- A spreadsheet is made up of sheets, organized on different tabs (In Microsoft Excel, a spreadsheet is called a “Workbook”).
- Each new sheet is essentially a giant table—you start off with 26 columns and 1000 rows or more.

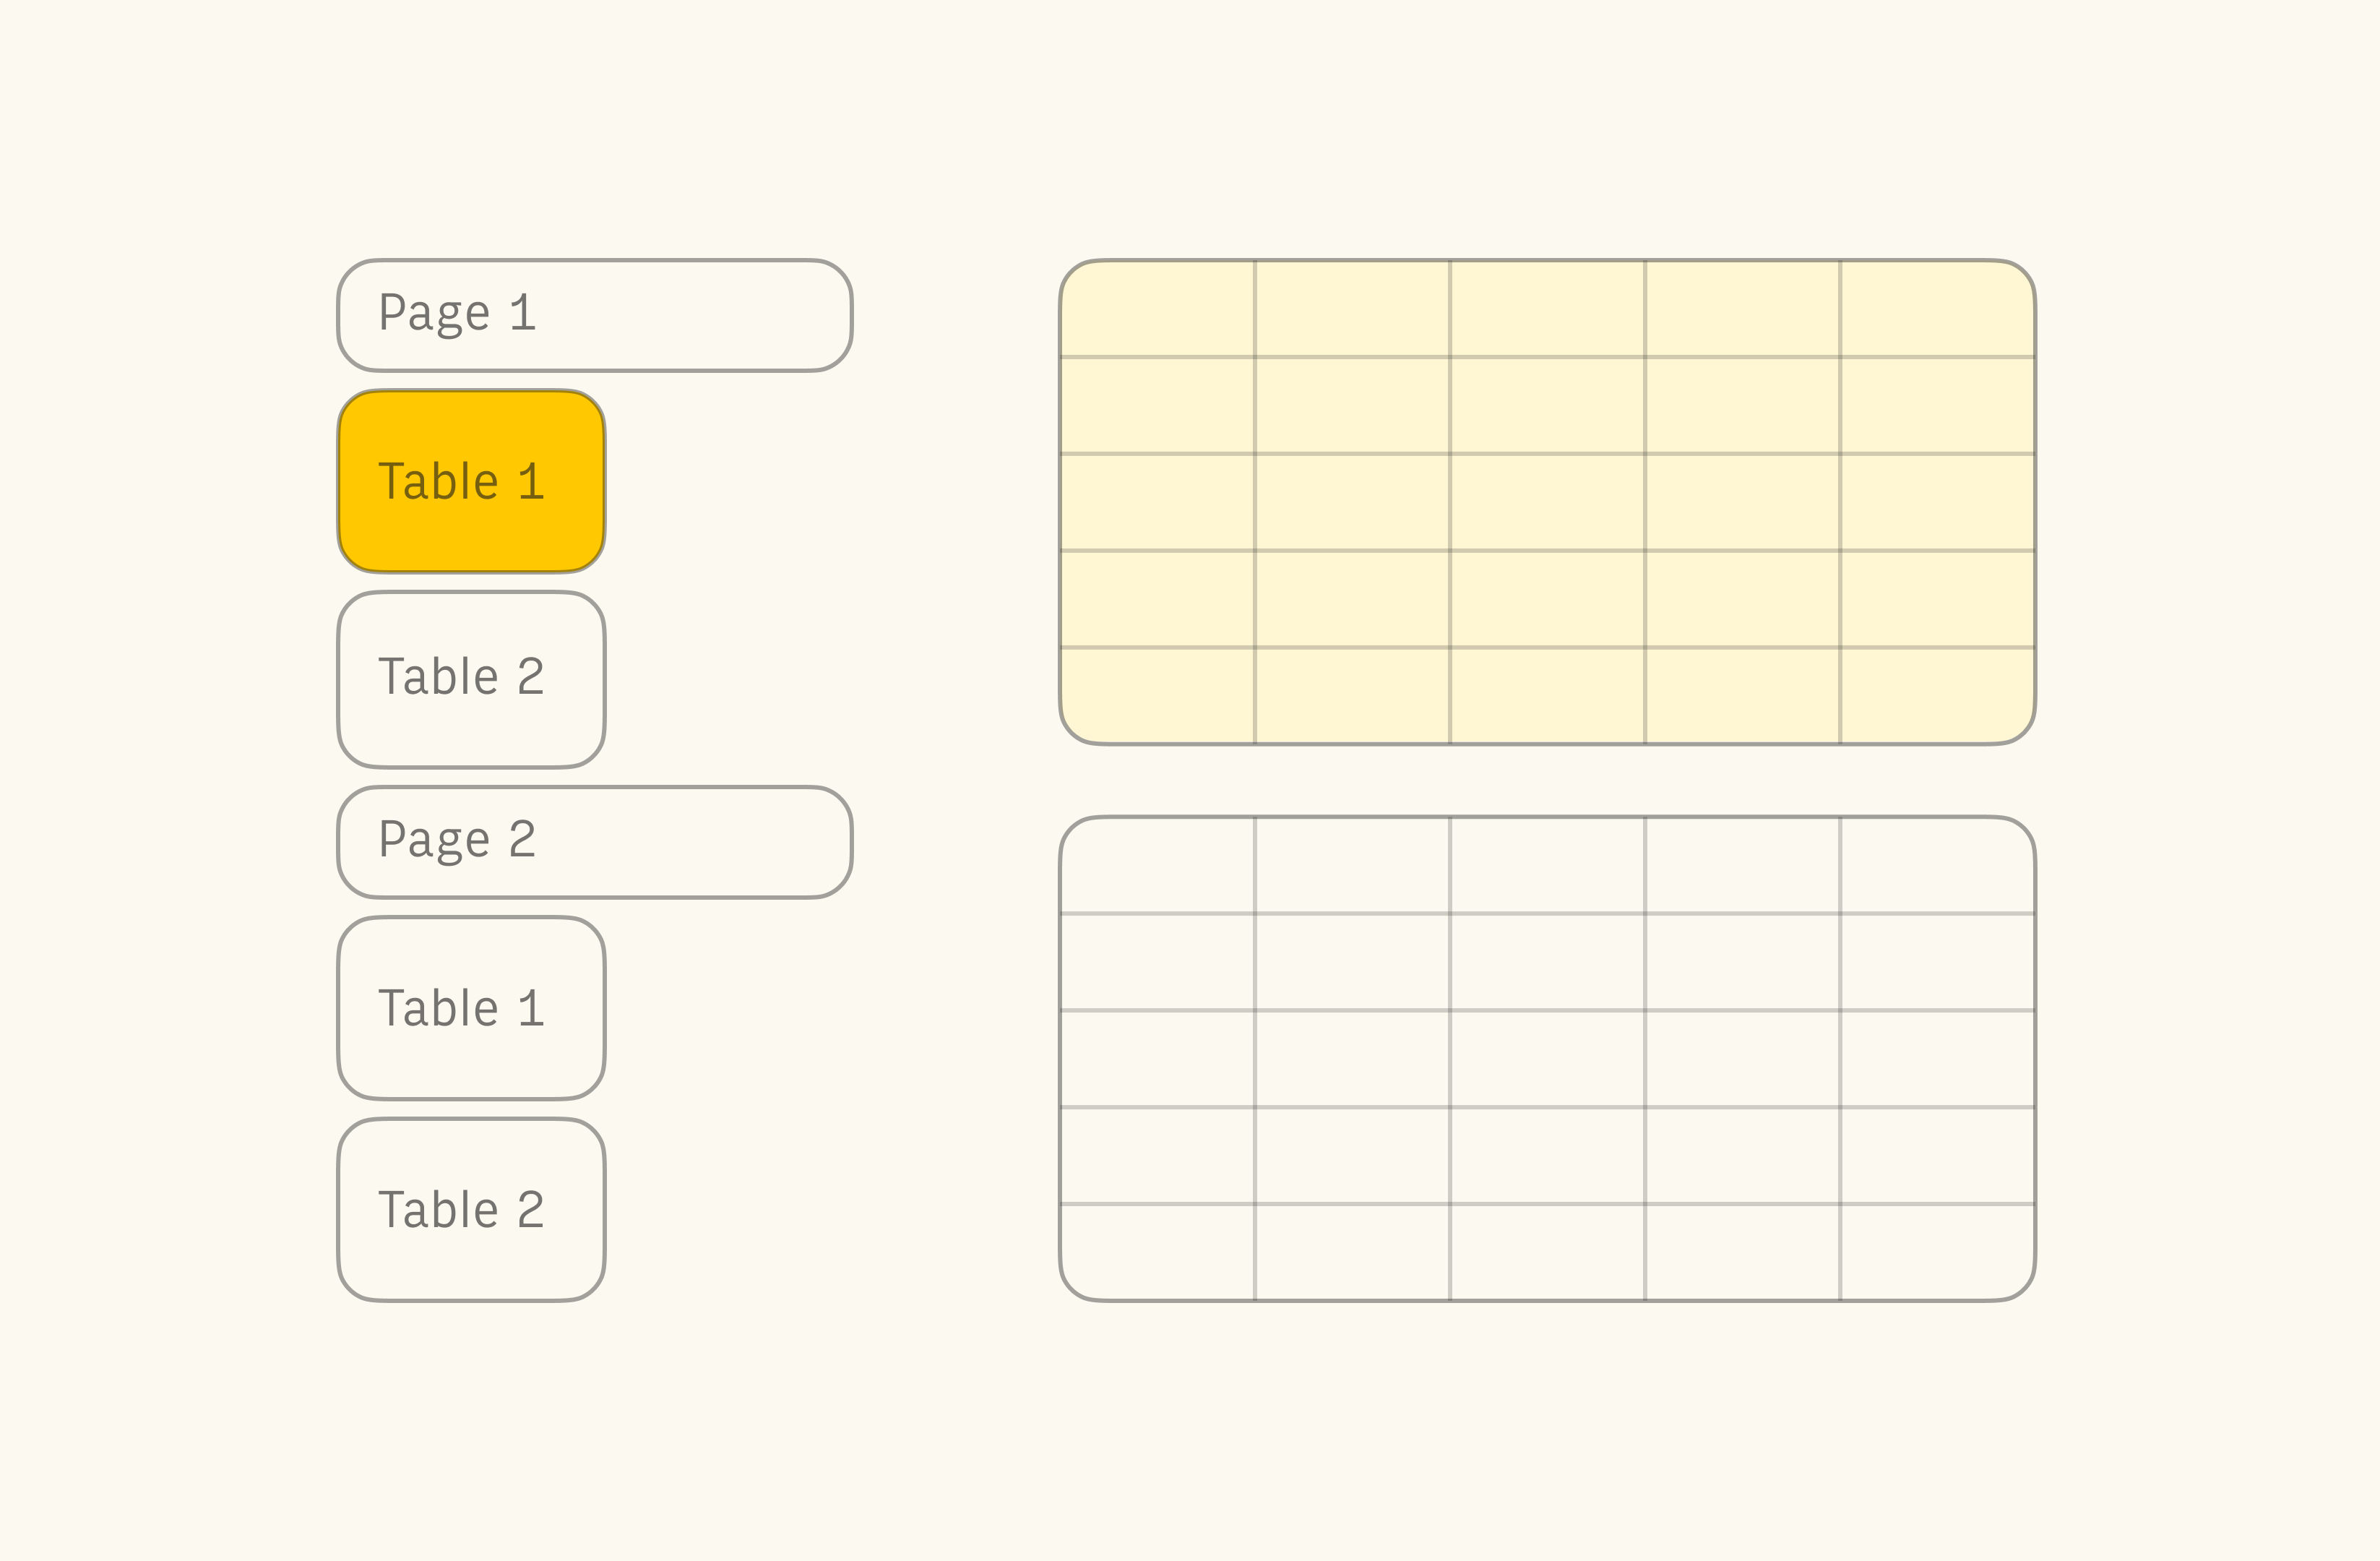
In Rows
- A spreadsheet is made up of Pages and Tables.
- Each new table starts small —you start off with 5 columns x 5 rows (you can think of these as our version of a “sheet”).
- You can group related tables into pages like you would find in a PDF, Word document or even similar to the navigation you find in most websites.

Functions and formulas
If you’re already familiar with functions and formulas, you’ll find all the standards in Rows too. FromSUM, to VLOOKUP to IFERROR, they’re all here. However, we also have some functions that you won't find anywhere else. These functions relate to our secret sauce: integrations.
In Excel and Google Sheets
- You get standard functions such as mathematical, statistical, date and time, and lookup functions.
- You can also use a handful of generic functions for getting external data such as
IMPORTHTMLorWEBSERVICE.
In Rows
- You get most of the standard functions that you get in Google Sheets or Excel.
However, we don’t yet have functions such asREGEXMATCHARRAYFORMULA. - You also get a rich set of functions for pulling data from external sources such as
AD_CAMPAIGNS_ANALYTICS_GOOGLE, SEND_EMAILorGET_FOLLOWERS_INSTAGRAM. - You can use the AUTOFILL function to automatically copy the same function down to bottom row of a neighbouring table.
It also adapts automatically when more rows are added to the table.
Collaboration and Access Control
Rows comes with the concept of the “workspace” which you might know from other applications such as Trello or Slack. This is a handy way to manage access to different projects or types of spreadsheets. This is generally different to how you share spreadsheets in Google Sheets or Microsoft Excel. But this isn’t the only difference.
In Excel and Google Sheets
Since Excel is a desktop application, the following applies to Google Sheets and Microsoft Excel Online only.
- Bulk sharing is done in folders outside of the spreadsheet application. For example, to give a group of people access to a set of Google Sheets spreadsheets, you need to put them in a shared folder on Google Drive.
- You can share a sheet with specific people with different permission levels.
- You can “publish” a read-only version of the spreadsheet for the general public to access.
- You can share a spreadsheet with “anyone with the link”.
In Rows
- You don’t need a separate file system to manage your spreadsheets—Rows has its own file system called a "Workspace".
Once you give people access to a workspace, they can see all spreadsheets in the workspace. - You change who has access to the workspace or to a specific folder or spreadsheet and set different permission levels.
- You can invite “anyone with the link” to collaborate on a spreadsheet.
- You can share a view of the spreadsheet for the public to access or restrict it to anyone with the link.
- You can use sharing to turn the spreadsheet into a more robust, beautiful and mobile-friendly web app (what we call the "Live view").
- You also have fine-grained control over what people can see in the "Live” view of your spreadsheet as opposed to the “edit” view.
Forms and interactivity
We built Rows so that you could create simple interactive applications such as reporting dashboards or order forms. So it goes without saying that forms and interactivity is one of our key focus areas:
In Excel and Google Sheets
Google Sheets and Excel are quite different in this respect.
In Google Sheets, you can insert checkboxes but Google Sheets is generally used in tandem with Google Forms. You use Google Forms as a separate app to manage the fields and Google Sheets to store the data.
In Excel, you have a wide selection of so-called “form controls” which you can use to trigger macros and other actions, however, these are intended for local spreadsheets that you access in the Excel desktop application (rather than online forms).
In Rows
- You can create read-only Tables or fully interactive Forms and share them with users in “Live” view.
- The forms functionality is comparable to Google forms, but you don’t have to use a separate tool—you can use Rows to build the forms and store the data.
- You get a simple set of form controls such as text inputs, date pickers, dropdowns, checkboxes, and of course, buttons.
- As well as simply storing the responses, you can also use Rows to create more advanced forms that trigger downstream automation.
Charts and visualization
In Rows, you get most standard chart types but with less fine-grained control than you would in Microsoft Excel or Google Sheets. However, we think our charts look much nicer out of the box, because they’re designed to help you create professional-looking online reports.
In Excel and Google Sheets
- You get well over 10 different report types, with some rarer types used for statistical analysis.
- You have fine-grained control over design elements such as fonts, titles, series labels, axis ticks, spacing, and colors.
- You can embed linked charts in other document types such as PowerPoint presentations.
- Charts are overlaid on top of your spreadsheet grid — it’s up to you to place them in an appropriate location or copy them into a presentation application such as PowerPoint.
In Rows
- You get the basic chart types that are beloved by report builders and consumers alike: Line, bar, column, pie and scatter plot.
- You can change basic elements such as the range of the source data and the series to display.
- Charts are always aesthetically in harmony with the rest of the spreadsheet (with complementary colors and fonts).
- Charts are not overlaid spreadsheet grid, rather they are given their own section within a Page—Rows takes care of the presentation aspect for you.
- You can embed charts anywhere that allows for embedding, such as Notion, Confluence, Slite or Softr.
Integrations, Templates and Automation
The ability to pull data from one tool and share it with another has become a must-have feature for many data-driven teams. But this used to be really tough unless you had your own data engineer. Now, there are point-and-click tools to help with some of this, but they can still be pretty complicated. Rows on the other hand, has its own built-in integrations with many popular tools such as Google Analytics and Salesforce. This put us head and shoulders above other standard spreadsheet tools, and it’s what makes us unique.
In Excel and Google Sheets
- You can build integrations with other tools, but you need to know the Google Scripting language or VBA.
- There are a few tighter integrations with tools with the same parent company. For example, Google Sheets and Google Analytics or Microsoft Excel and Microsoft SQL Server.
- For online tools like Google Sheets, you can also use third-party tools such as Zapier and IFTTT to bring in data or trigger automation.
In Rows
- You can choose from a large library of in-house integrations without needing to rely on third-party tools.
- You can also use our special API functions to integrate with any other tools that offer a REST API.
- You can use templates that provide example implementations for most of our core integrations.
- You can run scheduled tasks with the SCHEDULE function.
- You can use the UPDATE function to create and manage databases.