What is Average Engagement Time
Average Engagement Time is a key metric in Google Analytics 4 (GA4) that measures the average duration users actively engage with your website or app.
In GA4, this metric is technically referred to as "userEngagementDuration" and represents the total amount of time (in seconds) your website or app was in the foreground of users' devices.
This metric offers a more nuanced view of user interaction compared to traditional time-based metrics. Unlike older metrics such as "Average Session Duration," which might include time when a user has your site open in a background tab, Average Engagement Time focuses on active interaction. It only counts the time when your site or app is actively being viewed or used, providing a more accurate representation of genuine user engagement.
For instance, if a user opens your website and actively browses for 5 minutes, then leaves the tab open but switches to other tasks for an hour before returning for another 2 minutes of active browsing, Average Engagement Time would only count the 7 minutes of active engagement, not the full hour-plus session duration.
This focus on active engagement makes Average Engagement Time particularly valuable for content-heavy websites, e-commerce platforms, and apps where user interaction is crucial. It helps you understand not just how long users stay on your site, but how much time they spend actively engaging with your content or features.
How to track Average Engagement Time
Tracking Average Engagement Time in GA4 is straightforward and built into the platform. All you need to do is:
- Open your GA4 property
- Navigate to the Reports section
- Go to the "Engagement" report

- Select "Average engagement time" metric in the first chart, which will plot it against the selected time frame (by default the last 28 days)

GA4 automatically tracks this metric, so no additional setup is required beyond proper implementation of the GA4 tracking code on your site or app.
To compute Average Engagement Time, GA4 uses the following formula:
Average Engagement Time = Total Engagement Time / Number of Sessions
Where Total Engagement Time is the sum of all time periods when the site or app was in the foreground of users' devices.
It's important to note that this calculation method means Average Engagement Time can be significantly influenced by both very short and very long engagement periods.
For a more comprehensive understanding, it's often useful to look at engagement time distributions or segment your data by factors like traffic source, device type, or user demographics.
Additionally, you can create custom reports in GA4 to dive deeper into engagement patterns.
For example, you might want to compare Average Engagement Time across different pages, sections of your site, or user segments. This can help identify which areas of your site are most engaging and which might need improvement.
How to track Average Engagement Time with Rows
As presented above, the Average Engagement Time is a metric included in Google Analytics 4 native console. However Rows offers a more flexible and powerful approach to track it. Let's go through it.
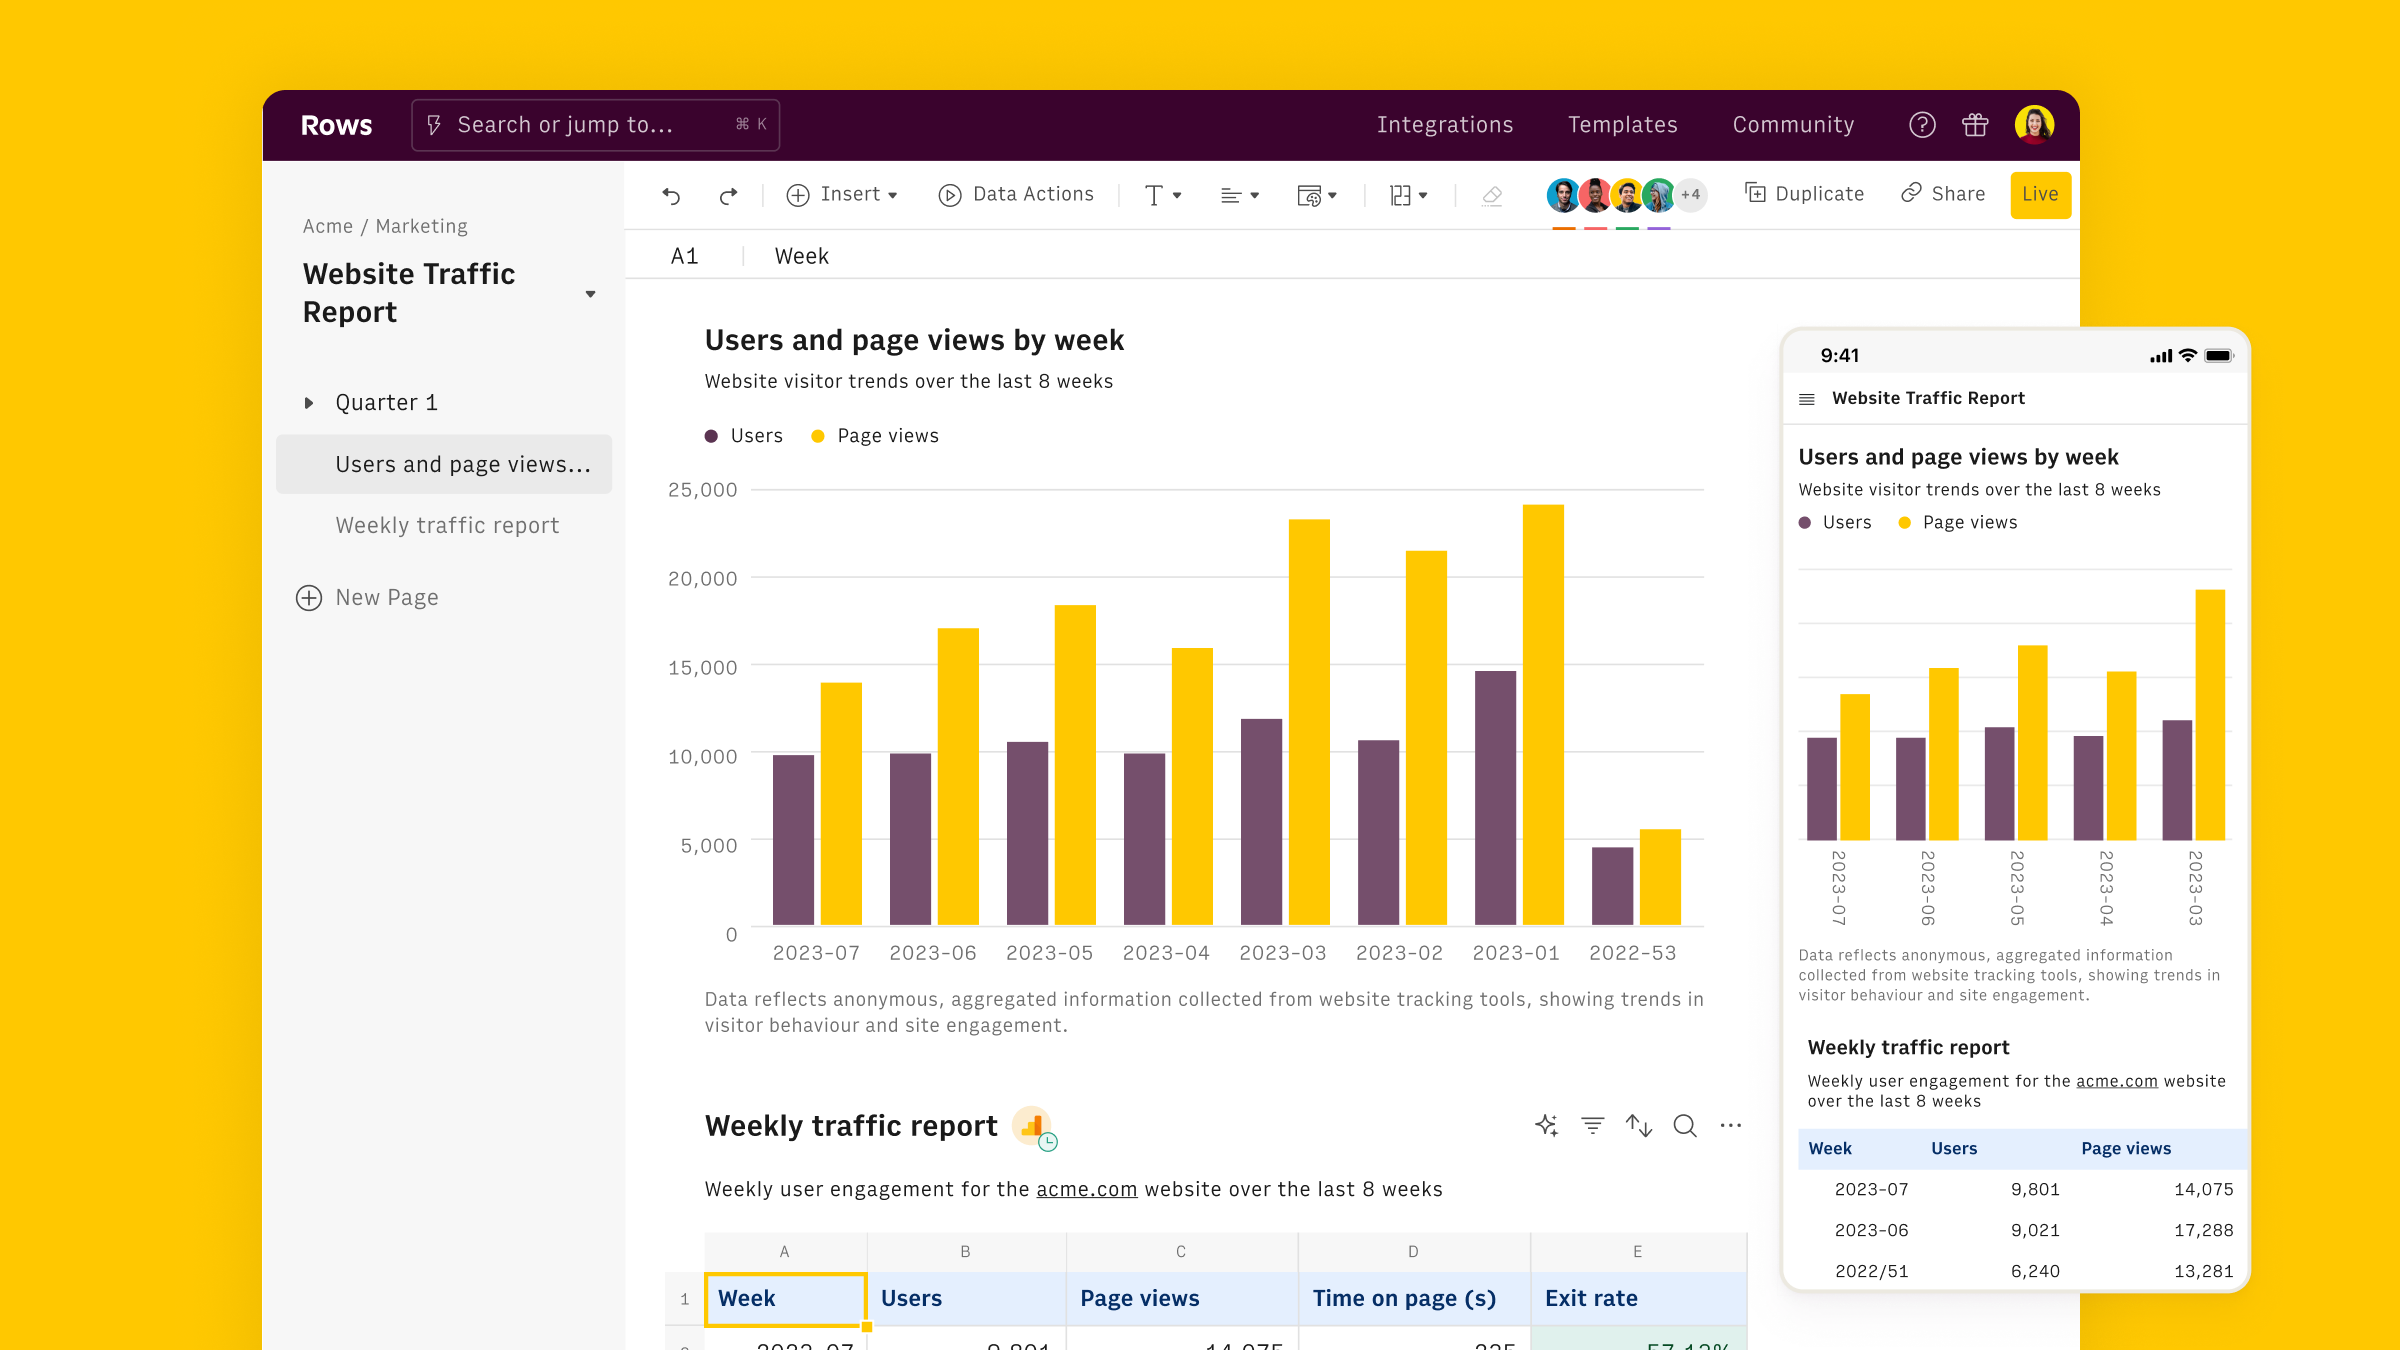
Rows is the easiest way to access, transform and share your business data. It works 100% as a spreadsheet, but lets you bring live data from 50+ sources, including GA4's User Stickiness, directly into your spreadsheet, thanks to built-in GA4 integration
This makes it extra easy to see which acquisition channel, or user segment, displays the highest engagement.
To get started:
Open a new spreadsheet in Rows
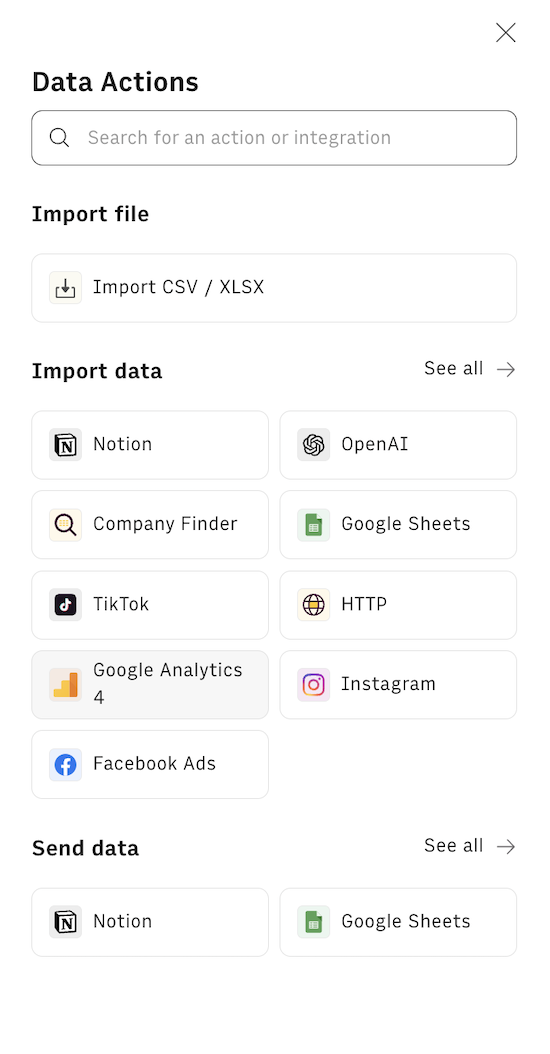
Use the Data Action menu to find Google Analytics 4 under the Import Data section
Connect your GA4 account by following the instructions - the typical oAuth procedure
Once back on the spreadsheet, pick the desired property from the dropdown and select Create Custom Data Request.
From the metrics dropdown select Engaged Sessions and User Engagement duration


Pick Date as dimension
Click on Get Data
A table will appear on the spreadsheet. To compute the Average Engagement Time we can use a formula column.
Click the + button in the top right corner of the table.
Add Average Engagement Time in the column title and input the ratio between the column where User Engagement duration is, C2, and Engaged Sessions column, B2 as follows: =C2/B2

The column is added to the table, automatically computing the Average Engagment Time for each considered date.
To get a head start, Rows offers templates specifically designed for marketing analytics, such as
- Google Analytics 4 User Report
- Google Analytics 4 Retention Report
- Google Analytics 4 Traffic Acquisition Report
- Google Analytics 4 User Acquisition Report
- Google Analytics 4 Journey Report
- Google Analytics 4 Demographics Report
- Website Analytics Dashboard
- Google Analytics 4 Event Conversions Report
- Google Analytics 4 Content Group Report
By combining these integrations and templates, you can create a powerful system for tracking and analyzing user behavior across all your digital marketing efforts.
Why to use Average Engagement Time
Average Engagement Time is a valuable metric for several reasons:
Content quality indicator: Longer engagement times often suggest that users find your content valuable and engaging. This is particularly useful for content-driven websites, blogs, or media platforms. By comparing Average Engagement Time across different pieces of content, you can identify which topics or formats resonate most with your audience.
User experience assessment: It can help identify pages or features that are particularly engaging or those that might need improvement. For example, if you notice that certain pages have significantly lower engagement times, it might indicate issues with content quality, page load speed, or user interface design.
Conversion optimization: Pages with higher engagement times may be good candidates for conversion rate optimization efforts. Users spending more time on a page are likely more interested in your offering, making these pages prime targets for strategically placed calls-to-action or lead generation forms.
Remember to analyze Average Engagement Time in context with other metrics like Bounce Rate, Pages per Session, and Conversion Rate for a comprehensive understanding of user behavior. For instance, a page with high Average Engagement Time but low conversion rate might indicate that users are interested in the content but struggling to take the desired action, suggesting a need for conversion rate optimization.