About Google Analytics 4 Retention Report
With our Google Analytics 4 Retention Report template you gain insights on your user retention. This easy-to-use spreadsheet template leverages data from GA4 to provide deep insights into your website's user retention. By analyzing Daily Active Users (DAU), Monthly Active Users (MAU), and Weekly Active Users (WAU) over time and by traffic source, as well as comparing New vs Returning users, you can make data-driven decisions to enhance user engagement and retention.
Understanding Active Users in GA4
In Google Analytics 4 (GA4), an active user is defined as any user who has an engaged session or when Analytics collects the following events: first_visit, user_engagement, or engagement_time_msec. An engaged session is one that lasts 10 seconds or longer, includes one or more conversion events, or includes two or more pageviews or screenviews. This metric helps in understanding how users interact with your site and the quality of those interactions.
DAU, MAU, and WAU in GA4
Daily Active Users (DAU): This metric represents the number of unique users who engage with your site or app in a single day. DAU is a crucial measure for tracking daily user engagement and understanding the immediate impact of your marketing efforts.
Monthly Active Users (MAU): MAU refers to the number of unique users who engage with your site or app over a 30-day period. This metric is valuable for assessing long-term user retention and growth trends.
Weekly Active Users (WAU): WAU counts the unique users who engage with your site or app in a week. This metric strikes a balance between the granularity of DAU and the broad overview provided by MAU, offering insights into weekly user engagement patterns.
DAU/MAU and DAU/WAU: Metrics of Retention
The ratios of DAU to MAU (DAU/MAU) and DAU to WAU (DAU/WAU) are essential metrics for evaluating user retention.
DAU/MAU Ratio: This ratio indicates the proportion of your monthly users who engage with your site daily. A higher DAU/MAU ratio suggests strong user retention and frequent engagement, implying that users find consistent value in your site.
DAU/WAU Ratio: This ratio measures the proportion of your weekly users who engage with your site daily. It helps to identify patterns in user behavior and engagement on a weekly basis, providing insights into the effectiveness of short-term strategies and campaigns.
Both metrics are critical for understanding user loyalty and the stickiness of your platform. They help in identifying the core group of users who are highly engaged and can be potential advocates for your brand.
Industry Benchmark
Understanding how your retention metrics compare to industry standards is vital. According to Sequoia Capital, the benchmark for a good DAU/MAU ratio is around 20% to 30%. This tweet by Sequoia Capital highlights that successful consumer apps generally maintain a DAU/MAU ratio in this range, indicating strong user engagement and retention. By aiming for these benchmarks, you can set realistic goals and measure your performance against top-performing applications in the industry.
Practical Use Cases and Ideal Personas
The Google Analytics 4 Retention Report template is a versatile tool designed for various practical use cases. For instance, digital marketing managers can use it to track the effectiveness of their campaigns over time, understanding which traffic sources yield the highest retention rates. Product managers can leverage the template to identify which features keep users returning, helping to prioritize development efforts. Additionally, content creators can analyze how different types of content perform in terms of user engagement and retention, guiding future content strategies.
This template is particularly useful for personas such as:
- Digital Marketing Managers: Looking to optimize marketing efforts by understanding user retention across different campaigns and traffic sources.
- Product Managers: Aiming to enhance product features based on user engagement and retention insights.
- Content Creators and Strategists: Seeking to identify which types of content drive the most engagement and returning users.
- Startup Founders and Entrepreneurs: Who need to monitor user retention closely to ensure the sustainability and growth of their user base.
- Data Analysts: Tasked with providing actionable insights on user behavior to inform business decisions.
By utilizing this template, these professionals can make informed decisions, ultimately leading to higher user retention and overall success for their websites or applications.
How it works
How it works
Get started
Click on 'Use template' and start using it right away. No forms, no signup. Your data first.
Connect your Google Analytics account
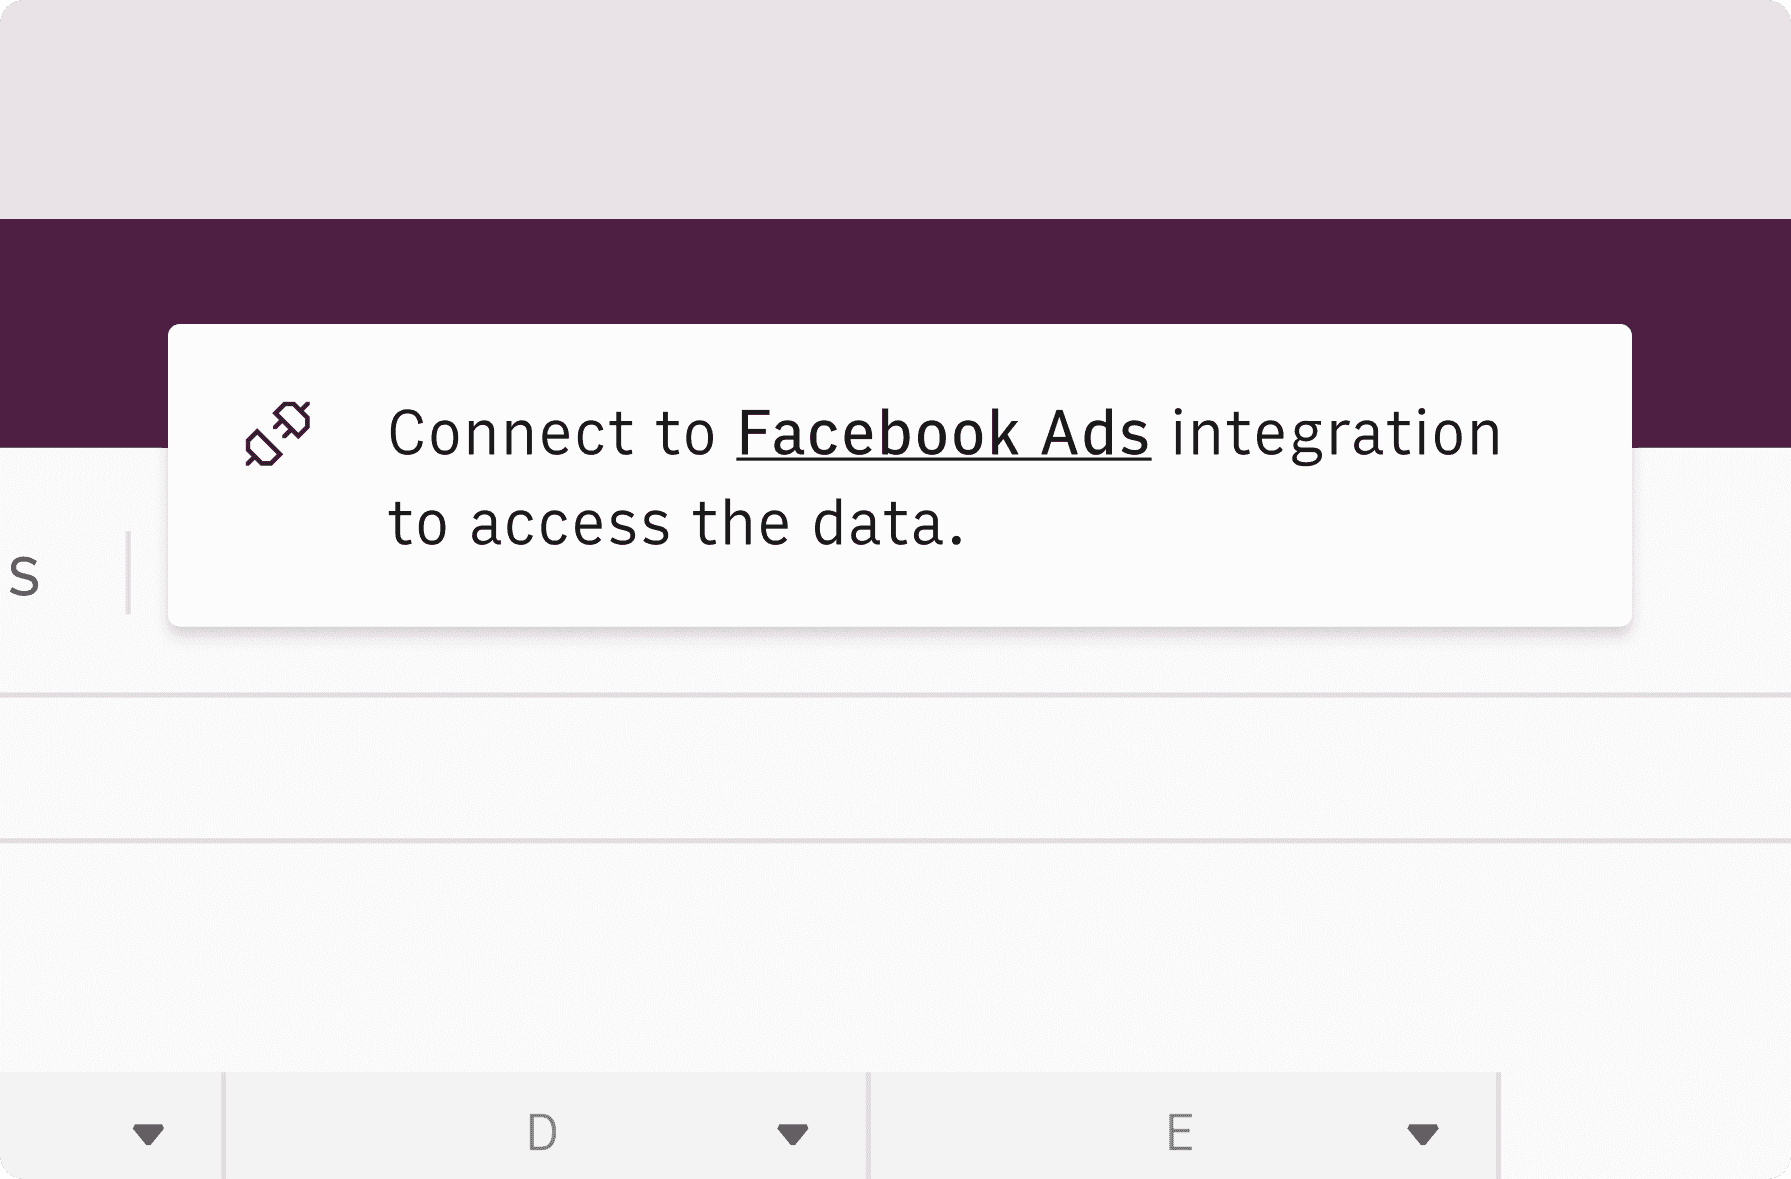
Once landed on the spreadsheet, follow the instructions to connect the required integration and pick your account.
Customize the template and schedule refresh
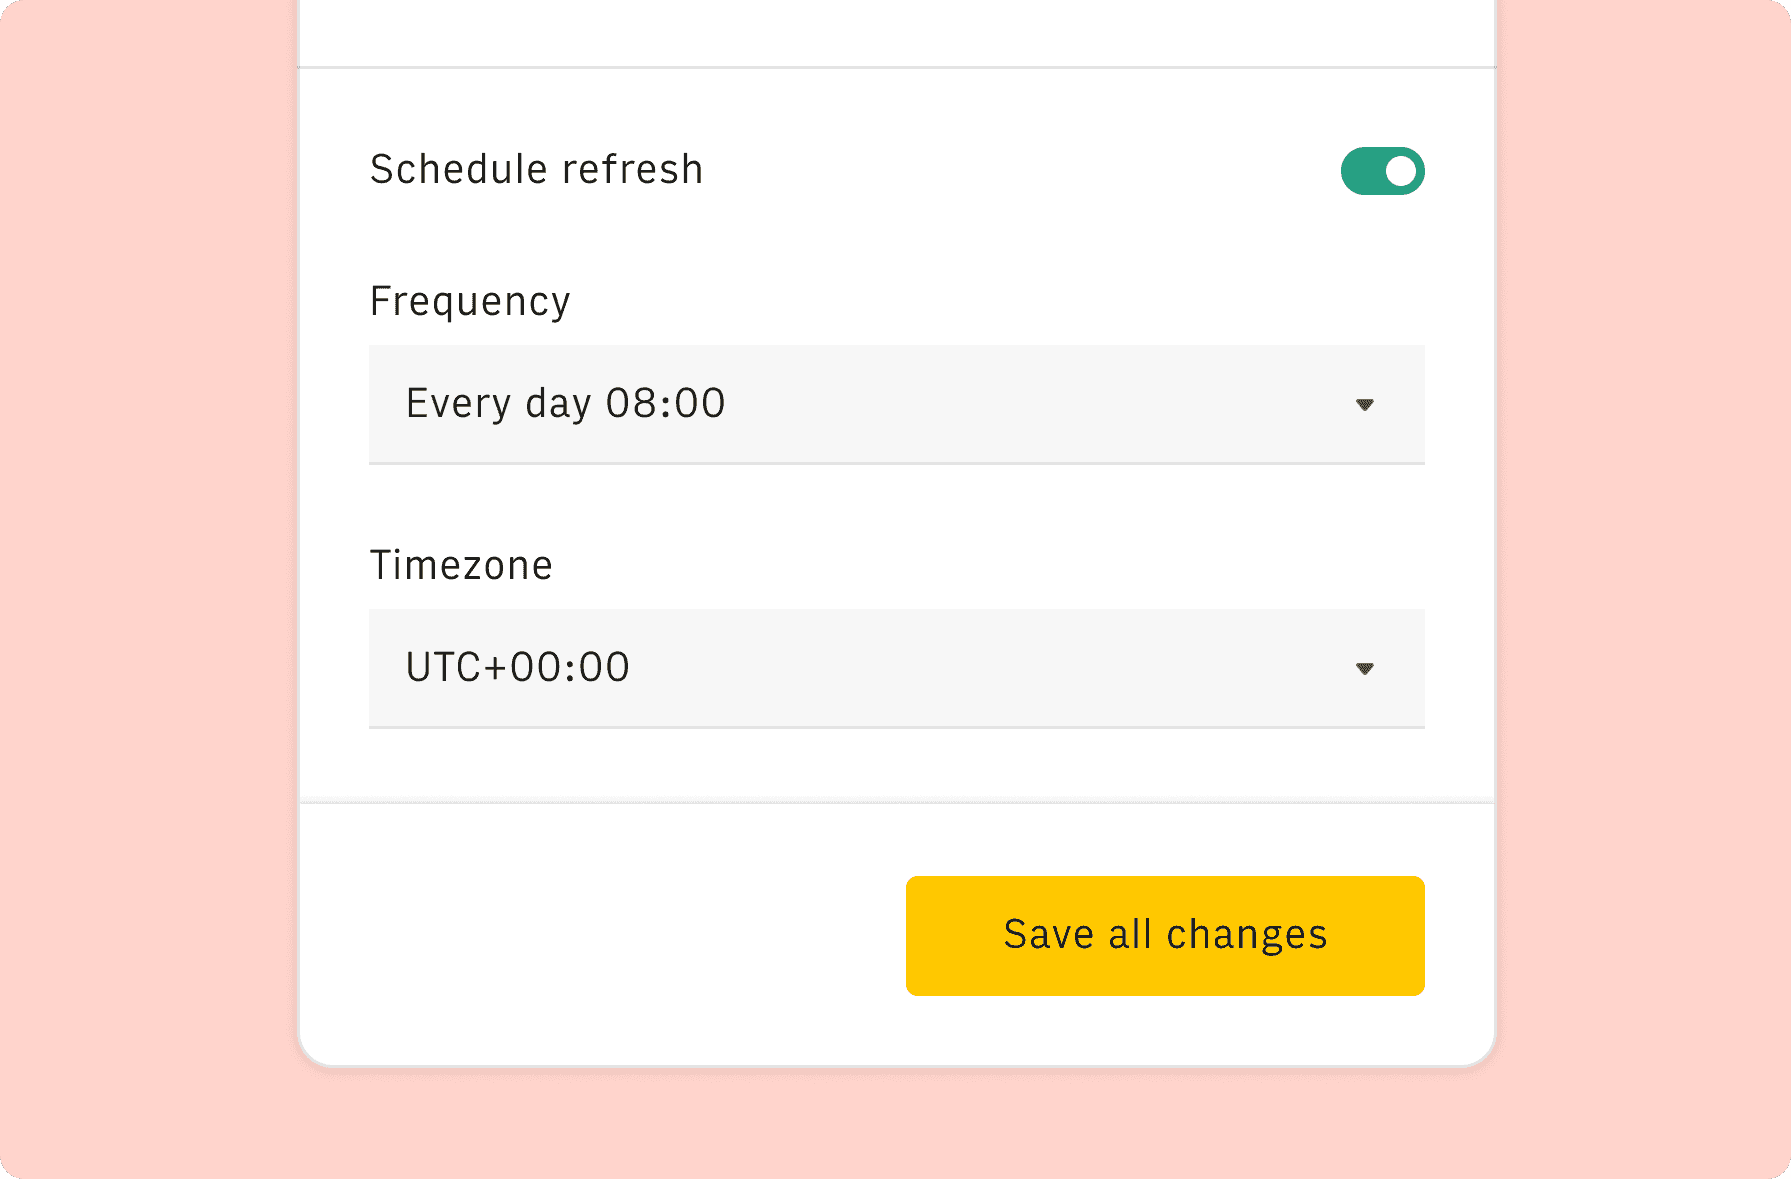
Once the integration has been connected, all tables will update automatically with your own data. Click on 'Edit Source' to change the retrieved data and automate the data refresh. You can then insert a chart or a pivot table, add a column or personalize formats, using all the regular functions and shortcuts that make spreadsheets great.
Embed tables and charts
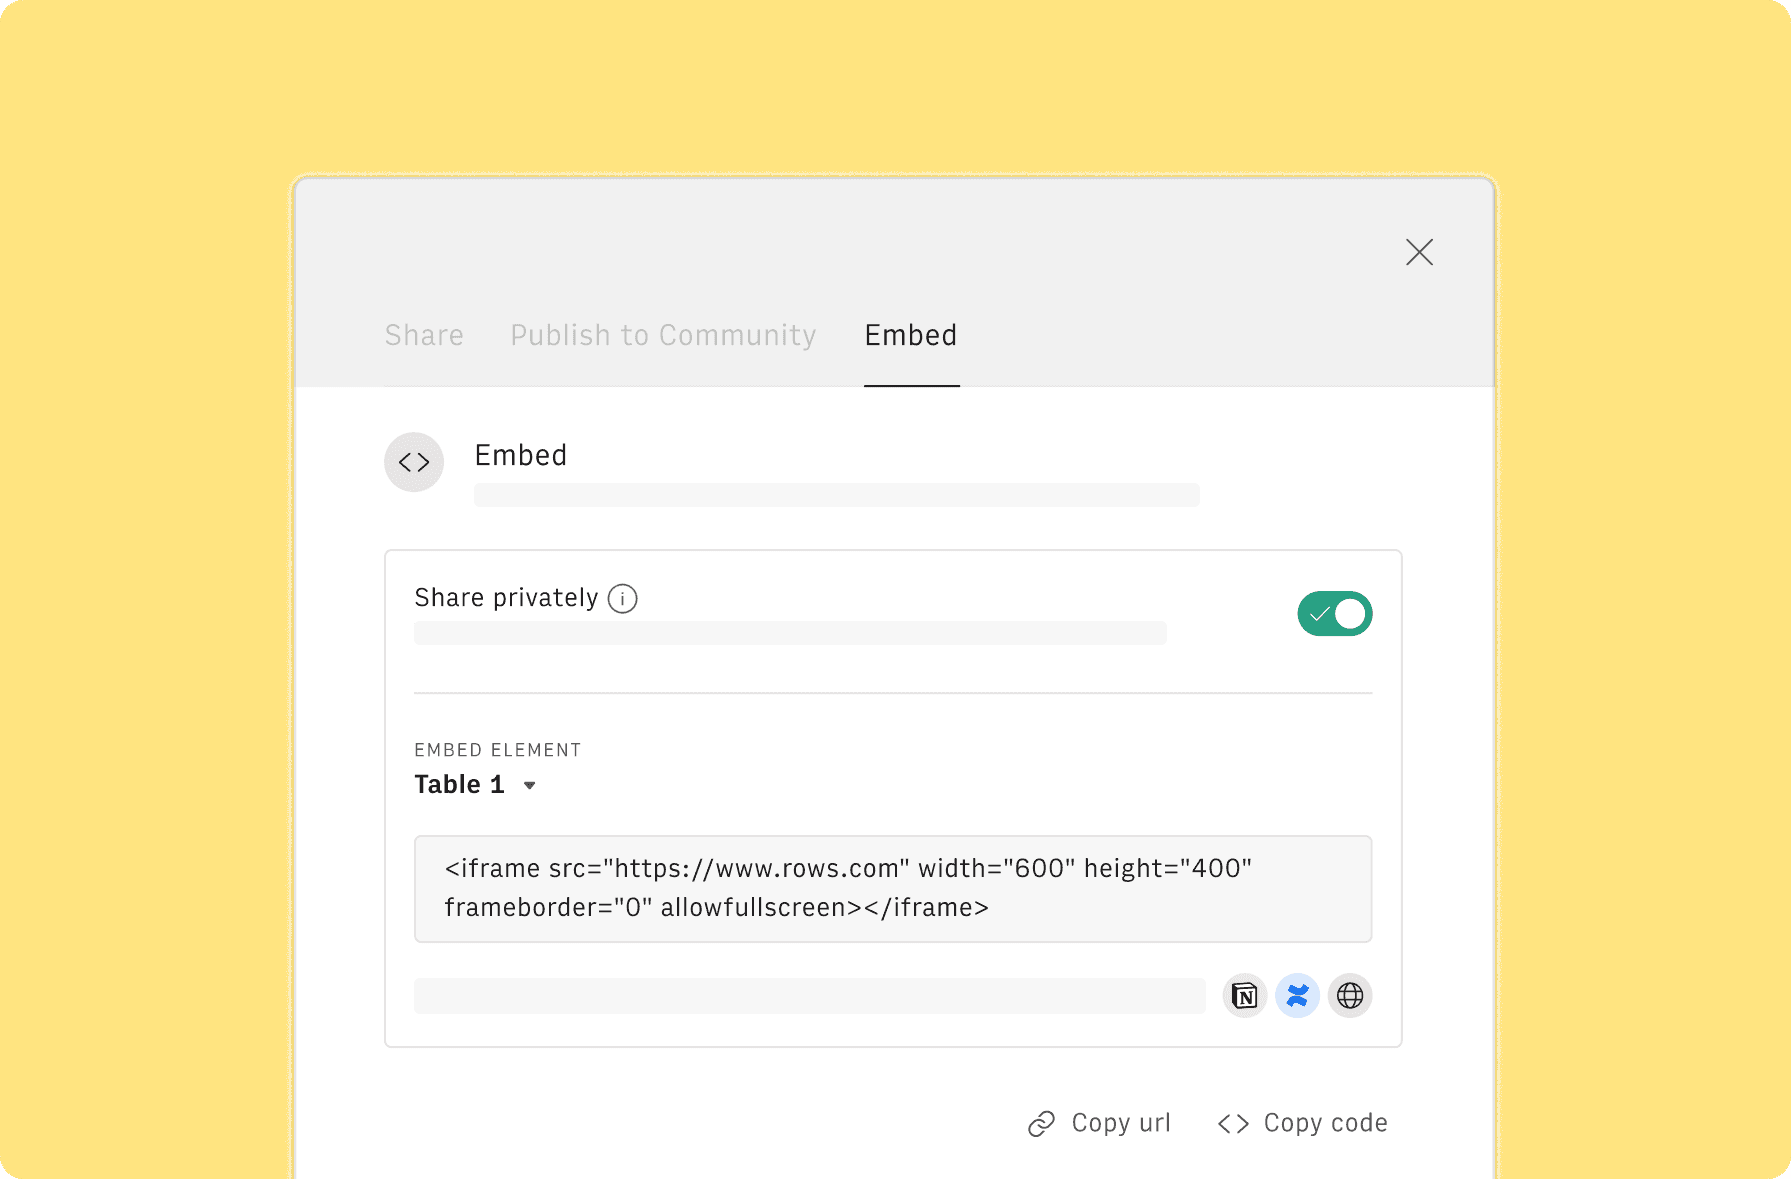
Click on the option menu to embed tables and chart on your Notion, Confluence or any other iframe-ready documents.
Questions and answers
Can I use Rows for free?
More than a Google Analytics 4 Retention Report
Rows is your new AI Data Analyst. It lets you extract from PDFs, import your business data, and analyze it using plain language.
Signup for free
Import your business data
Extract from PDFs and images, import from files, marketing tools, databases, APIs, and other 3rd-party connectors.
Know moreAnalyze it with AI
Ask AI✨ any question about your dataset - from VLOOKUPs to forecasting models - and surface key insights, trends, and patterns.
Know moreCollaborate and Share
Seamlessly collaborate and share stunning reports with dynamic charts, embed options, and easy export features.
Know more

