What is Engagement Rate
Engagement Rate is a ratio that quantifies the User Engagement, namely the magnitude of the interaction users have with your content, website, or application. It's a key indicator of how well your digital assets resonate with your audience and how effectively they capture its intent and maintain the interest.
The specific definition of user engagement can vary depending on the platform and business goals, but it generally includes actions such as clicks, sessions, page views, time spent, or specific in-app actions.
How to compute Engagement Rate
As said above, Engagement Rate can take different meanings, depending on the specific needs of your business and the nature of your digital presence.
Here are some common methods to compute it:
Basic Engagement Rate: (Number of Engaged Users / Total Number of Users)
- For example, if 500 users out of 2,000 total users interacted with your site: Engagement Rate = (500 / 2,000)
Social Media Engagement Rate: (Total Interactions / Total Followers)
- If a post receives 1,000 likes, 200 comments, and 50 shares, and you have 50,000 followers: Engagement Rate = ((1,000 + 200 + 50) / 50,000)
Page-Specific Engagement Rate: (Number of Engaged Users on a Page / Total Page Views)
- If a page has 1,000 views and 300 users interacted with it: Page Engagement Rate = (300 / 1,000)
Time-Based Engagement Rate: (Total Time Spent by All Users / Total Number of Users). If 1,000 users spent a total of 50,000 minutes on your site: Average Engagement Time = 50,000 / 1,000 = 50 minutes per user. See more.
Event-Based Engagement Rate: (Number of Users Who Performed Specific Action / Total Number of Users)
- If 200 users out of 1,000 completed a desired action (e.g., signing up for a newsletter): Event Engagement Rate = (200 / 1,000)
In Google Analytics 4, the engagement rate represents the percentage of engaged sessions on your website or mobile app. It's computed as the complement to Bounce Rate
Together with the Engagement Rate, GA4 provides you its time-version, the Average Engagement Time
How to track Engagement Rate in GA4
Google Analytics 4 (GA4) provides several ways to track and analyze engagement rate. Here the top 3:
- Engagement Overview Report: Navigate to Reports > Engagement > Overview This report shows metrics like engaged sessions, engagement rate, and engaged sessions per user.

Events Report: Go to Reports > Engagement > Events This shows which specific events users are triggering, helping you understand what actions constitute engagement.
Custom Exploration: You can always use the Exploration tool to create custom reports combining various engagement metrics.
How to use Rows to track Engagement Rate

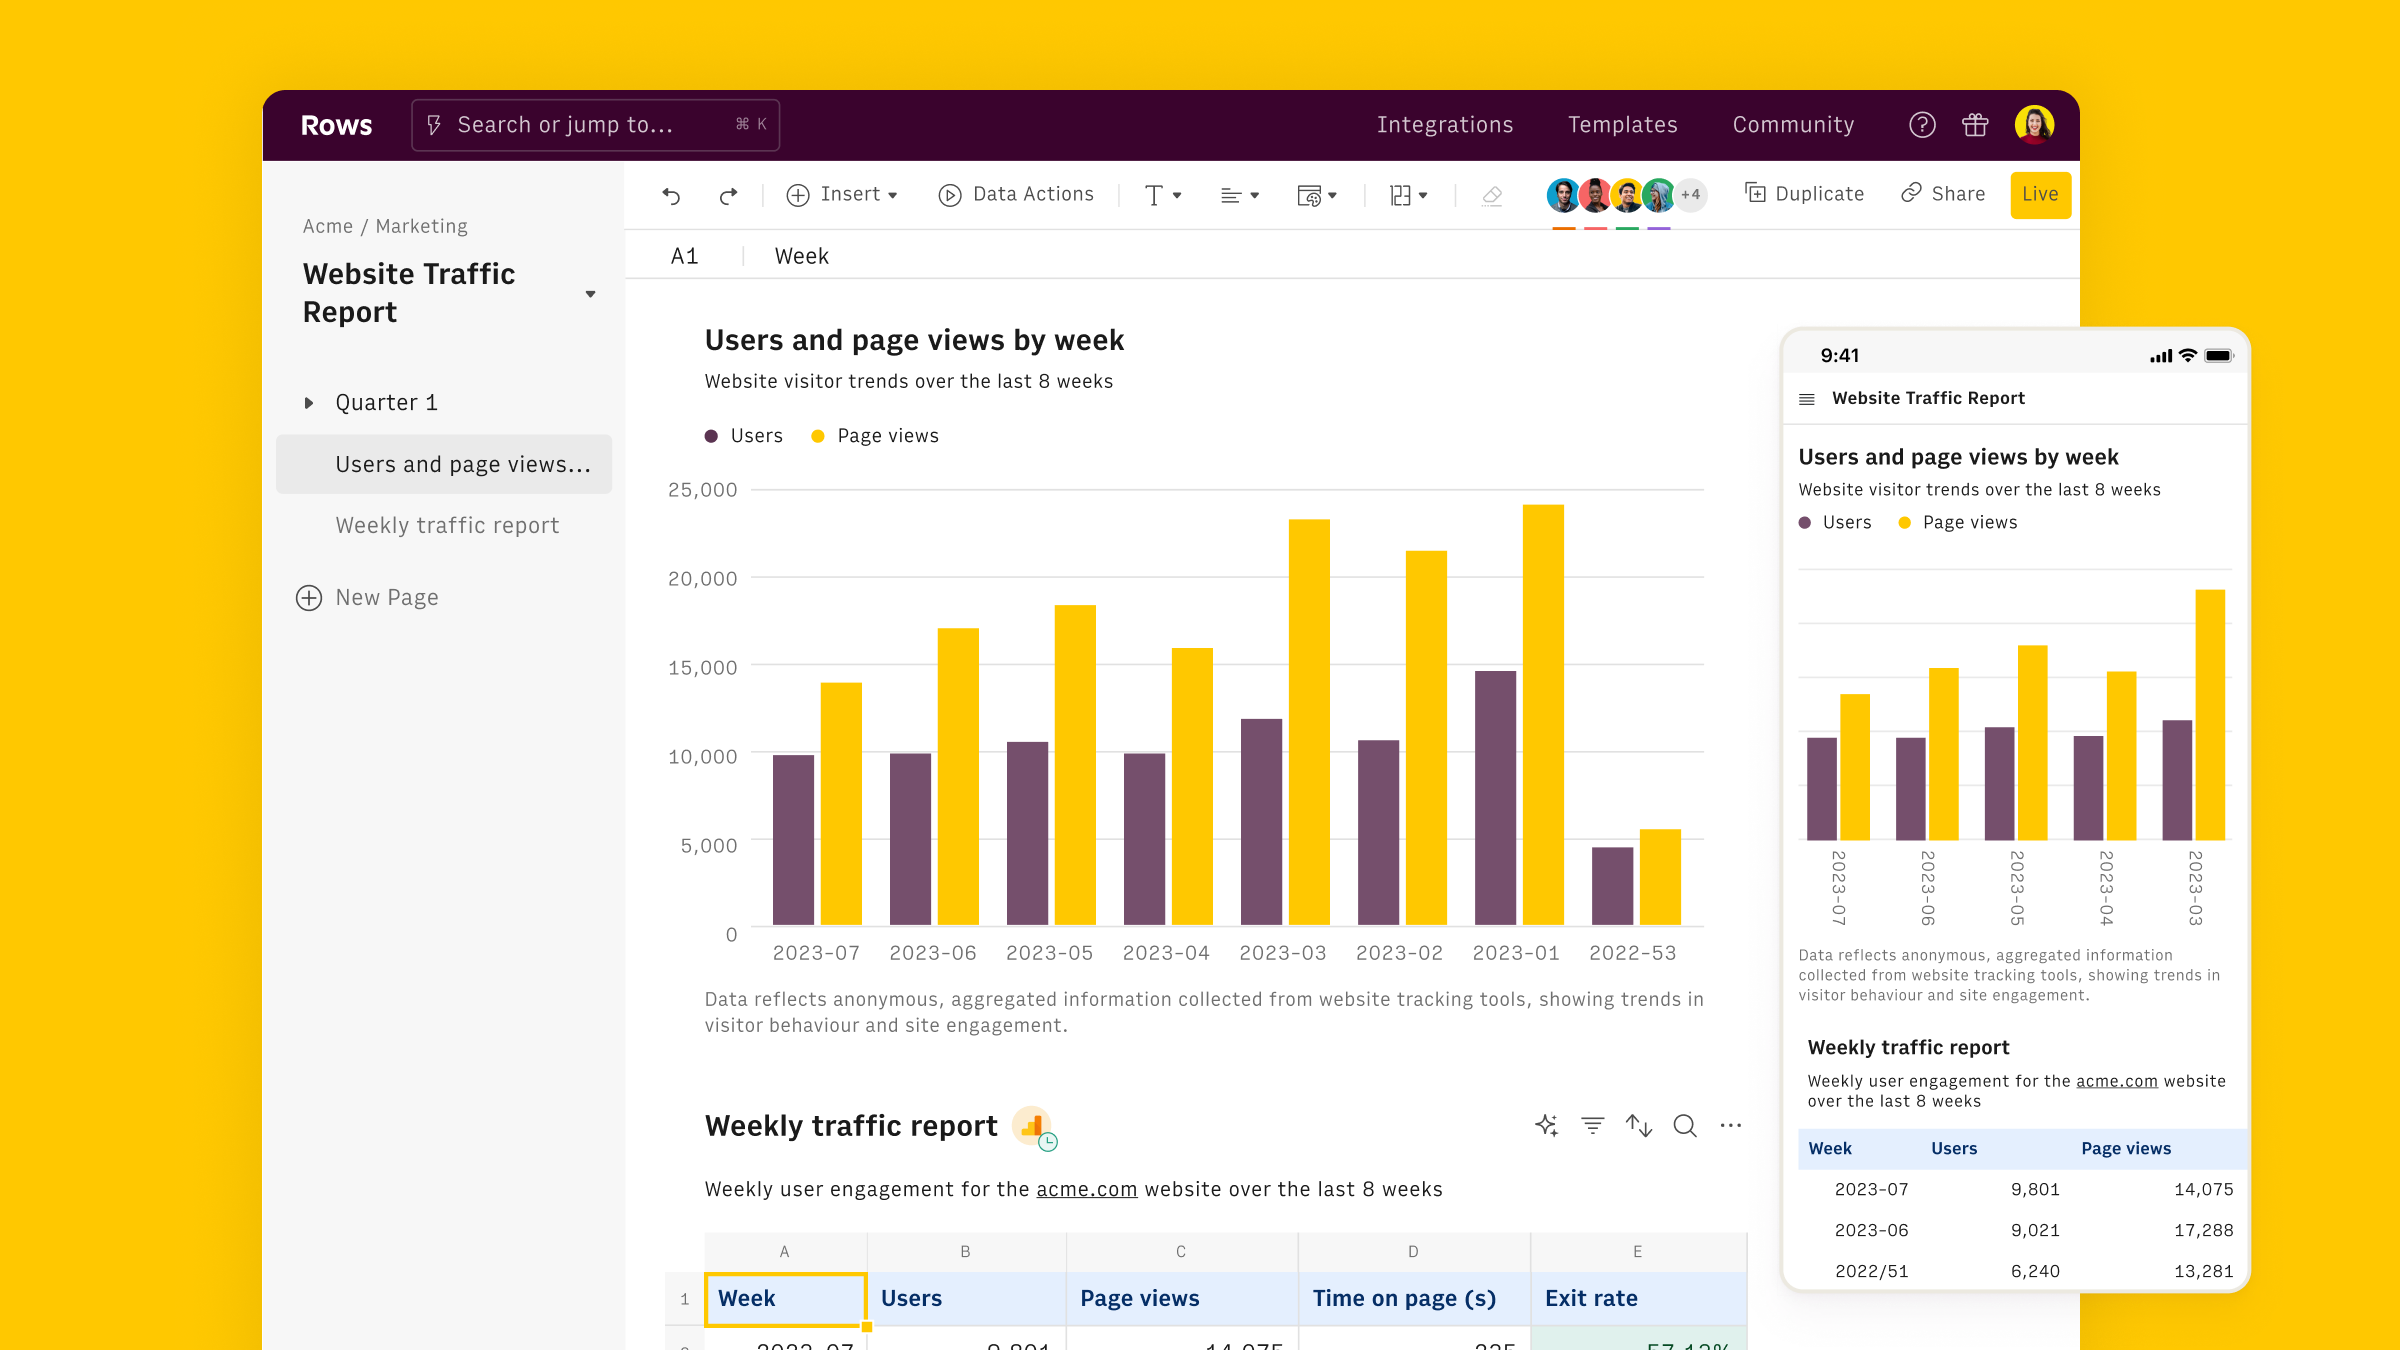
As showed above, Engaged Sessions can be analyzed using Google Analytics 4 native console, either on the default chart, or by customizing the table. However, Rows offers a more powerful and flexible way to analyze user engagement data - including Engagement Rate - by combining GA4 data with the familiarity of a spreadsheet.
Rows is easiest way to access, transform and share your business data. It works 100% as a spreadsheet, but lets you bring live data from 50+ sources, including Bounce Rate, directly into your spreadsheet, thanks to built-in API integration.
This makes it extra easy to track and monitor your website engagement performance using regular spreadsheet tables and charts.
To get started, use our User Acquisition Report:
- Click on use template
- Follow the instructions to connect your Google Analytics 4 account via standard OAuth procedure

- Select your GA4 property
- Once one the spreadsheet, select your desired Date Range
- The full data page contains "Average Engagement Rate by session/medium" that contains the number of Engaged Sessions by Session Source / Medium

and "Full data" table, that contains the number of Engaged Sessions by date

Alternatively, you can build your report from scratch, using the Data Actions menu.
Start by opening a blank spreadsheet. Explore the Data Actions menu and look for Google Analytics 4

Select your Property. Rows offers several Recommended Reports (preset) that replicate the default tables in GA4. that often include Engaged Sessions as a key metric.
Alternatively you can build a custom one, including any combination of metrics and dimensions, as follows:

Rows comes also with 100+ templates specifically designed for marketing analytics, to offer you a head start on several analytics goals, including:
- Google Analytics 4 User Report
- Google Analytics 4 Retention Report
- Google Analytics 4 Traffic Acquisition Report
- Google Analytics 4 User Acquisition Report
- Google Analytics 4 Journey Report
- Google Analytics 4 Demographics Report
- Website Analytics Dashboard
- Google Analytics 4 Event Conversions Report
- Google Analytics 4 Content Group Report
Why to use Engagement Rate
Engagement Rate is a crucial metric for several reasons:
Indicates Content Relevance: High engagement rates mean your content clicks with your audience, matching its search intent. For example, if blog posts about a certain topic always get lots of comments and shares, you know your readers are hungry for more of that content.
Reflects User Experience: Engagement rate gives you a peek into how user-friendly your site or app is. High engagement usually means things are working smoothly - pages load fast, navigation is clear, and content is interesting. If engagement is low on certain pages, it might be time for a redesign or content refresh.
Boosts SEO: Search engines love engaged users. The more people interact with your site, the better it might rank in search results. This can trigger a virtuous circle and ignite the compounded SEO return: higher engagement can lead to better visibility, which can bring more engaged users, and so forth.
By focusing on boosting engagement rate, you're not just getting more eyeballs on your content - you're creating a better experience that keeps users coming back for more. This can lead to happier customers and a healthier bottom line.