LinkedIn Ads Dashboard
Get an in-depth look to all the main KPIs of your LinkedIn Ads campaign, including audience demographics and cost-related metrics.

 100% spreadsheet
 Connected to your data
 Daily+ refresh
 Embed everywhere
About LinkedIn Ads Dashboard
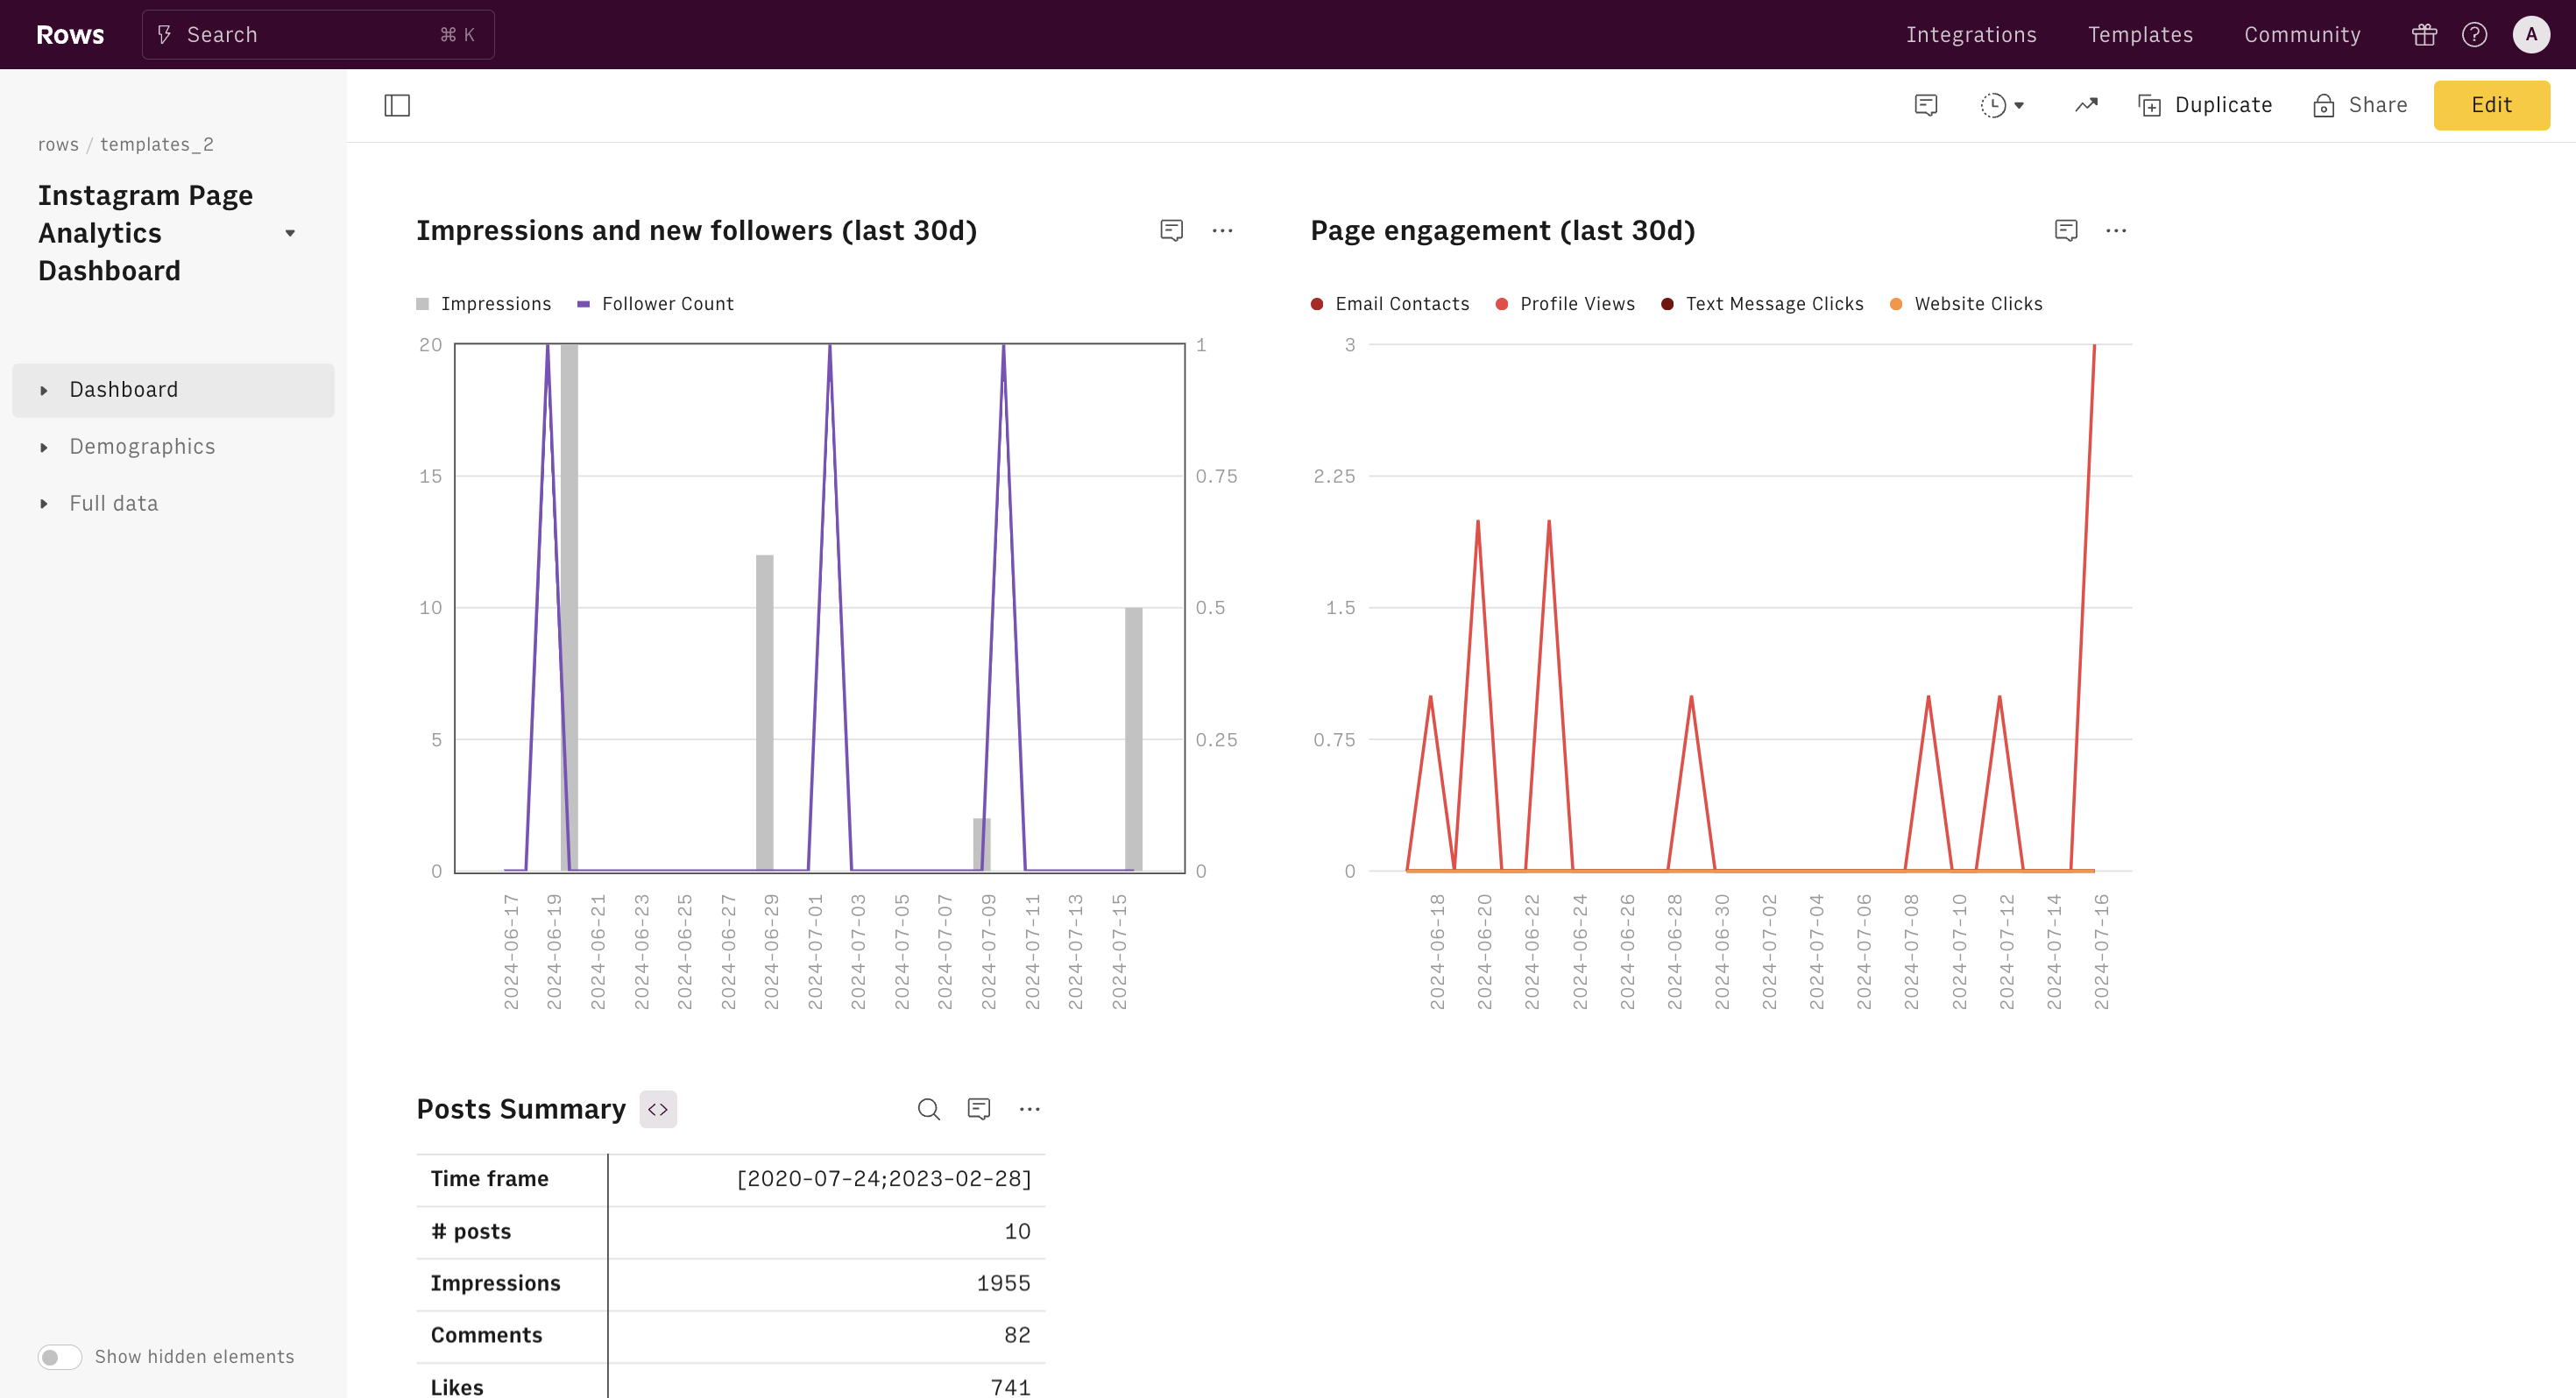
Our LinkedIn Ads Dashboard template is designed to provide you with a comprehensive overview of your LinkedIn advertising efforts. This powerful tool simplifies your LinkedIn reporting by offering high-level period summaries, including the number of campaigns, total spend, clicks, and cost-per-click (CPC). Dive deeper with campaign-specific summaries, spend and CPC trends over time, and audience breakdowns by job function, country, industry, and company size. This LinkedIn analytics tool is your go-to resource for detailed insights into your LinkedIn advertising performance.
How to Use the LinkedIn Ads Dashboard
Getting started with our LinkedIn Ads Dashboard is straightforward. All you need to do is:
- Follow the instructions in the panel to connect your LinkedIn Ads account to Rows
- Once connected, pick a date range to filter data from the desired period
- Your LinkedIn ad stats will be automatically fetched and displayed in the dashboard.
Importance of Monitoring Key Metrics
Effective LinkedIn ad management requires constant monitoring of key metrics. Our LinkedIn ad dashboard highlights the importance of tracking spend, clicks, and CPC, along with detailed audience analytics.
Understanding these metrics through our LinkedIn advertising statistics will help you optimize your ad spend and improve campaign performance. Regularly reviewing your LinkedIn reports ensures that you are always aware of how your campaigns are performing and where adjustments are needed.
Practical Use Cases and Ideal Users
This LinkedIn ad dashboard is perfect for marketing professionals, digital marketers, and advertising managers who need detailed and actionable insights into their LinkedIn campaigns.
Whether you're a small business owner using LinkedIn.com ads for the first time or a seasoned marketer looking to streamline your advertising reporting, this template is tailored to meet your needs.
Use it to enhance your ad analytics, produce comprehensive advertising reports, and ensure your LinkedIn advertising login provides you with valuable, actionable data every time you log in.
By leveraging this LinkedIn reporting tool, you can transform your LinkedIn analytics into powerful marketing reporting analytics, making data-driven decisions that drive success in your advertising efforts. The LinkedIn Ads Dashboard is not just a reporting tool; it's a strategic asset for anyone serious about maximizing their LinkedIn advertising ROI.
How it works


How it works
Get started
Click on 'Use template' and start using it right away. No forms, no signup. Your data first.
Connect your LinkedIn Ads account
Once landed on the spreadsheet, follow the instructions to connect the required integration and pick your account.
Customize the template and schedule refresh
Once the integration has been connected, all tables will update automatically with your own data. Click on 'Edit Source' to change the retrieved data and automate the data refresh. You can then insert a chart or a pivot table, add a column or personalize formats, using all the regular functions and shortcuts that make spreadsheets great.
Embed tables and charts
Click on the option menu to embed tables and chart on your Notion, Confluence or any other iframe-ready documents.


Questions and answers
Can I use Rows for free?
More than a LinkedIn Ads Dashboard
Rows is your new AI Data Analyst. It lets you extract from PDFs, import your business data, and analyze it using plain language.
Signup for free

Import your business data
Extract from PDFs and images, import from files, marketing tools, databases, APIs, and other 3rd-party connectors.
Know moreAnalyze it with AI
Ask AI✨ any question about your dataset - from VLOOKUPs to forecasting models - and surface key insights, trends, and patterns.
Know moreCollaborate and Share
Seamlessly collaborate and share stunning reports with dynamic charts, embed options, and easy export features.
Know more