
E-commerce Marketing Dashboard
Measure your global advertising efforts to grow your e-commerce, including organic and paid channels.

 100% spreadsheet
 Connected to your data
 Daily+ refresh
 Embed everywhere
About E-commerce Marketing Dashboard
What Is E-commerce Marketing Dashboard
Rows' E-commerce Marketing Dashboard is an all-inclusive, comprehensive tool designed to monitor and analyze all marketing efforts for your e-commerce business. This powerful dashboard provides a unified, handy view of both organic and paid channels, allowing you to easily understand which strategies are performing better and yielding the highest return on investment (ROI).
Key benefits of using Rows E-commerce Marketing Dashboard
- Centralized Data: Consolidate data from multiple sources into one easy-to-use dashboard.
- Real-time Insights: With direct connections to GA4, Google Search Console, and Paid channels, your data is always up-to-date.
- Performance Comparison: Easily compare organic and paid channel performance side-by-side.
- ROI Tracking: Monitor key metrics like ROAS to ensure your marketing spend is effective.
- Time-saving: Eliminate the need for manual data gathering and reporting across multiple platforms.
Key components of the E-commerce Marketing Dashboard
Comprehensive Channel Overview
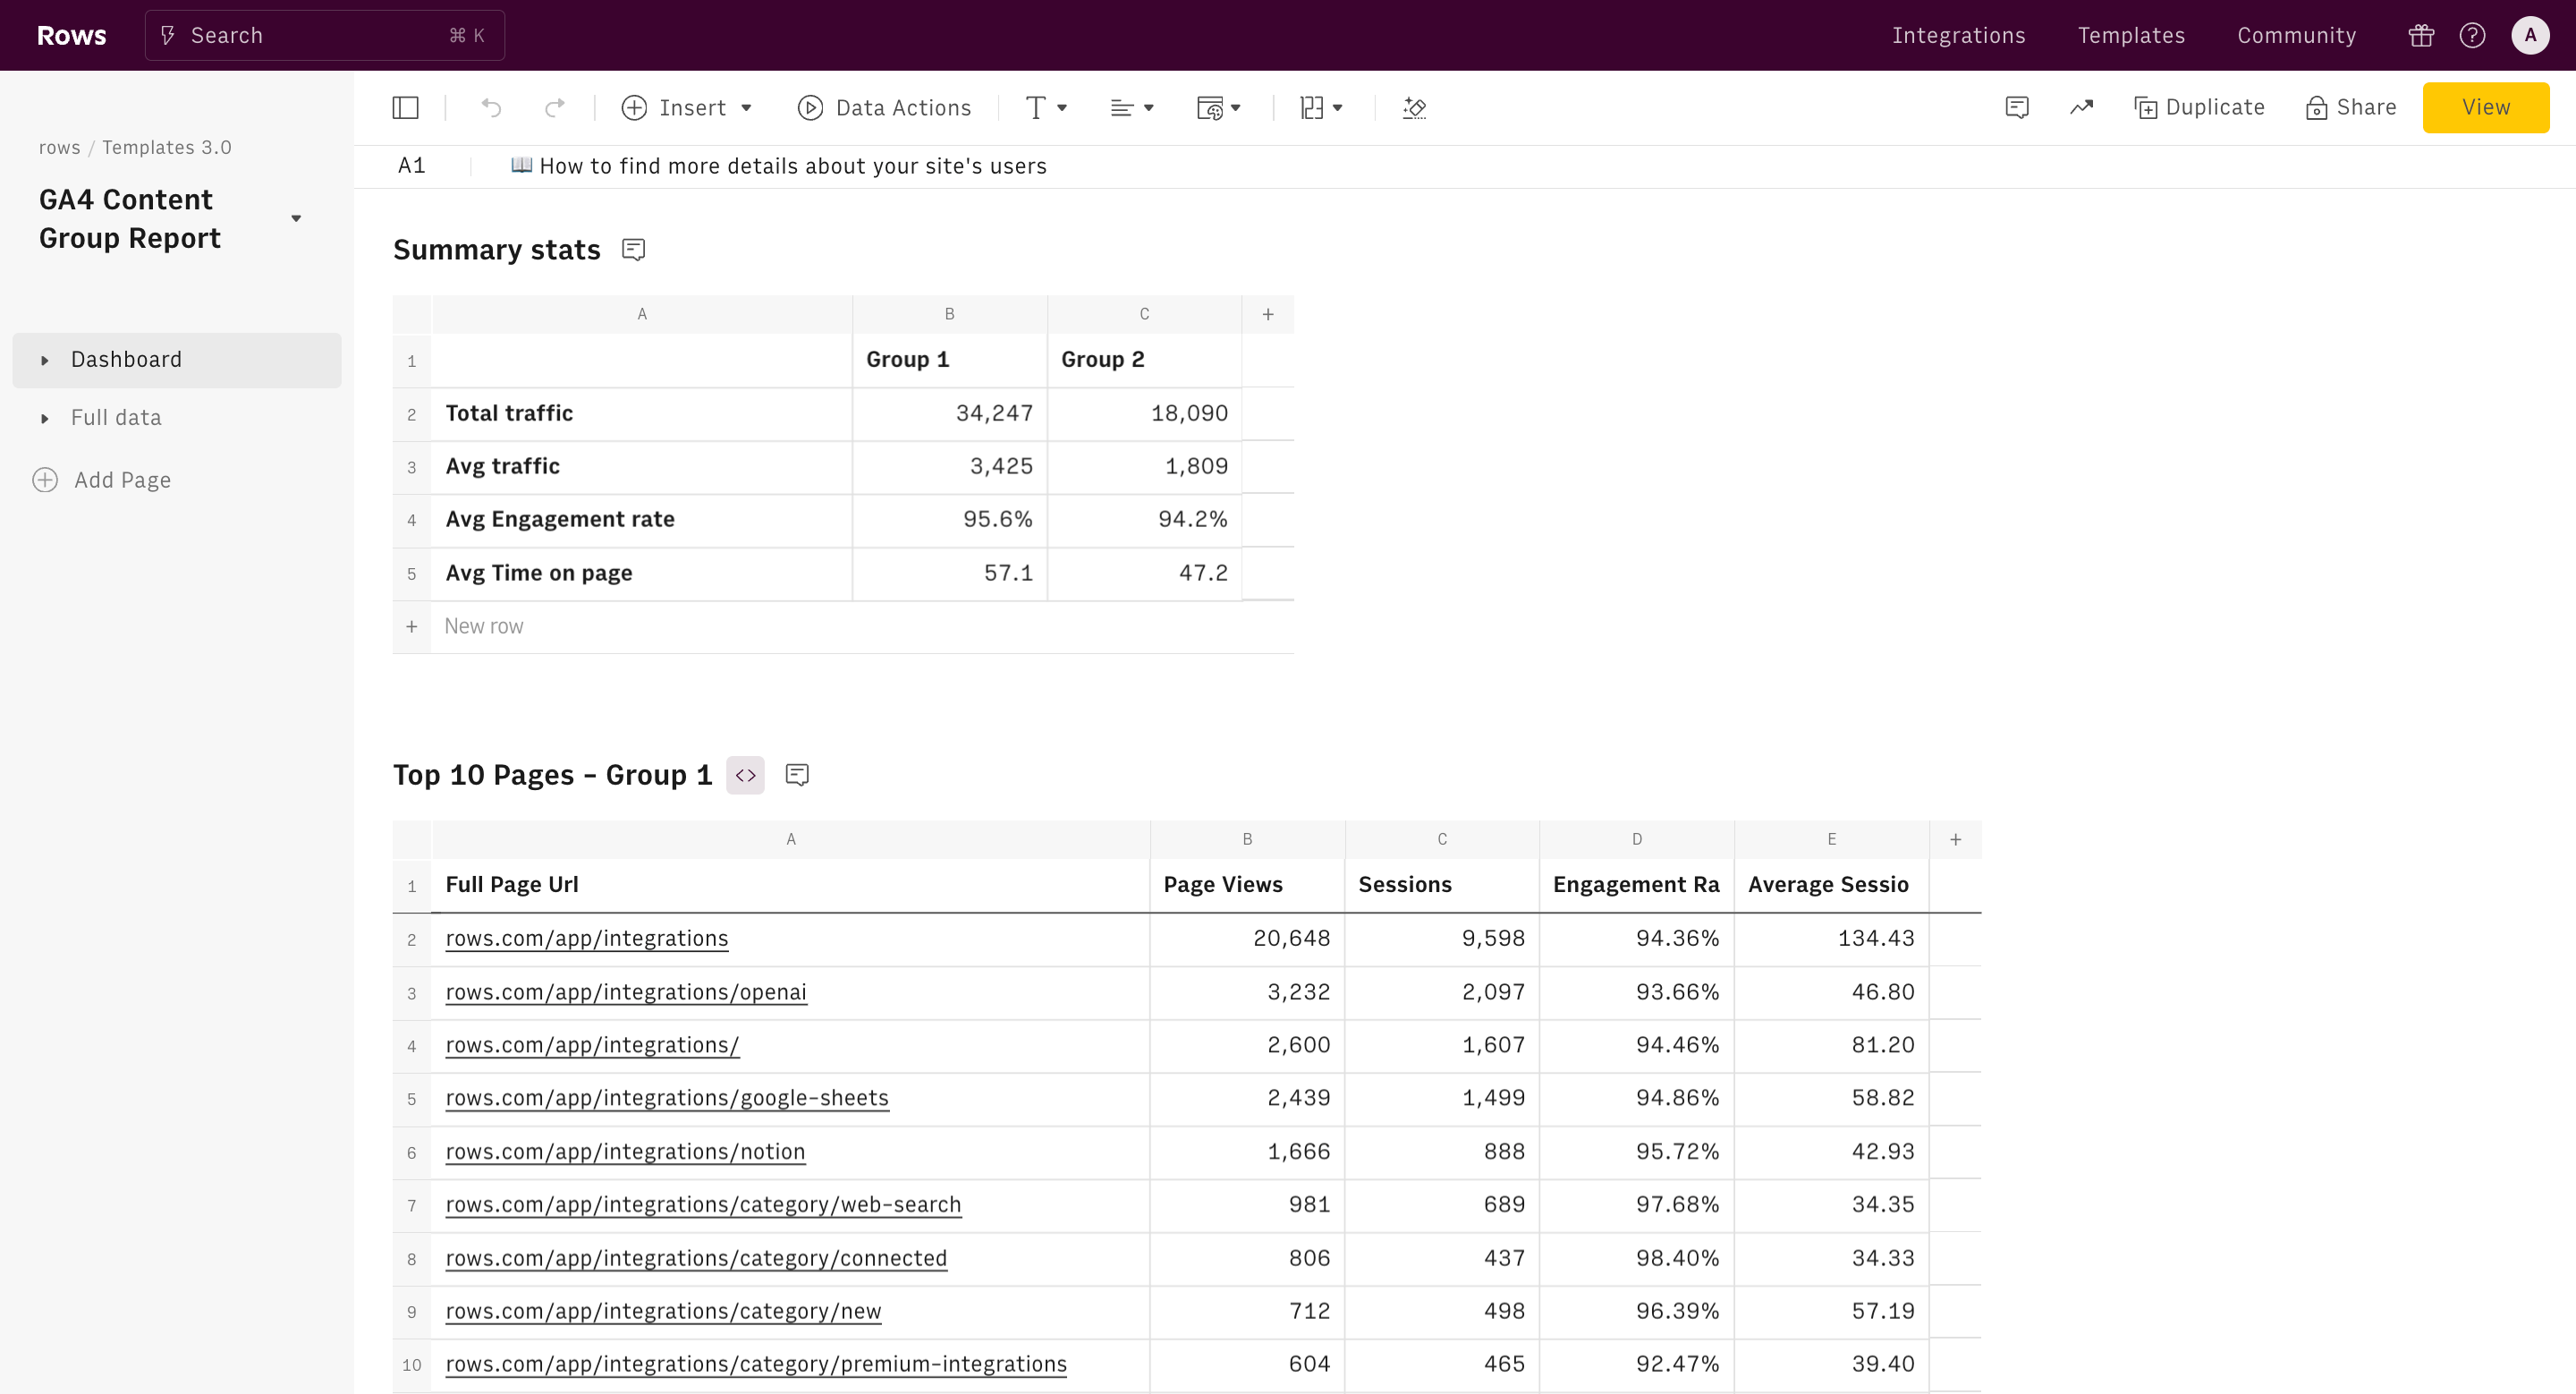
Thanks to the integration with GA4, the 'Overall performance by channel' table provides a holistic view of your marketing efforts. It aggregates top-level revenue data breaking down key revenue metrics by Default Channel Group. This allows you to quickly assess the performance of each macro-channel at a glance and make informed budget switch decisions.
In-depth Organic Search Analysis
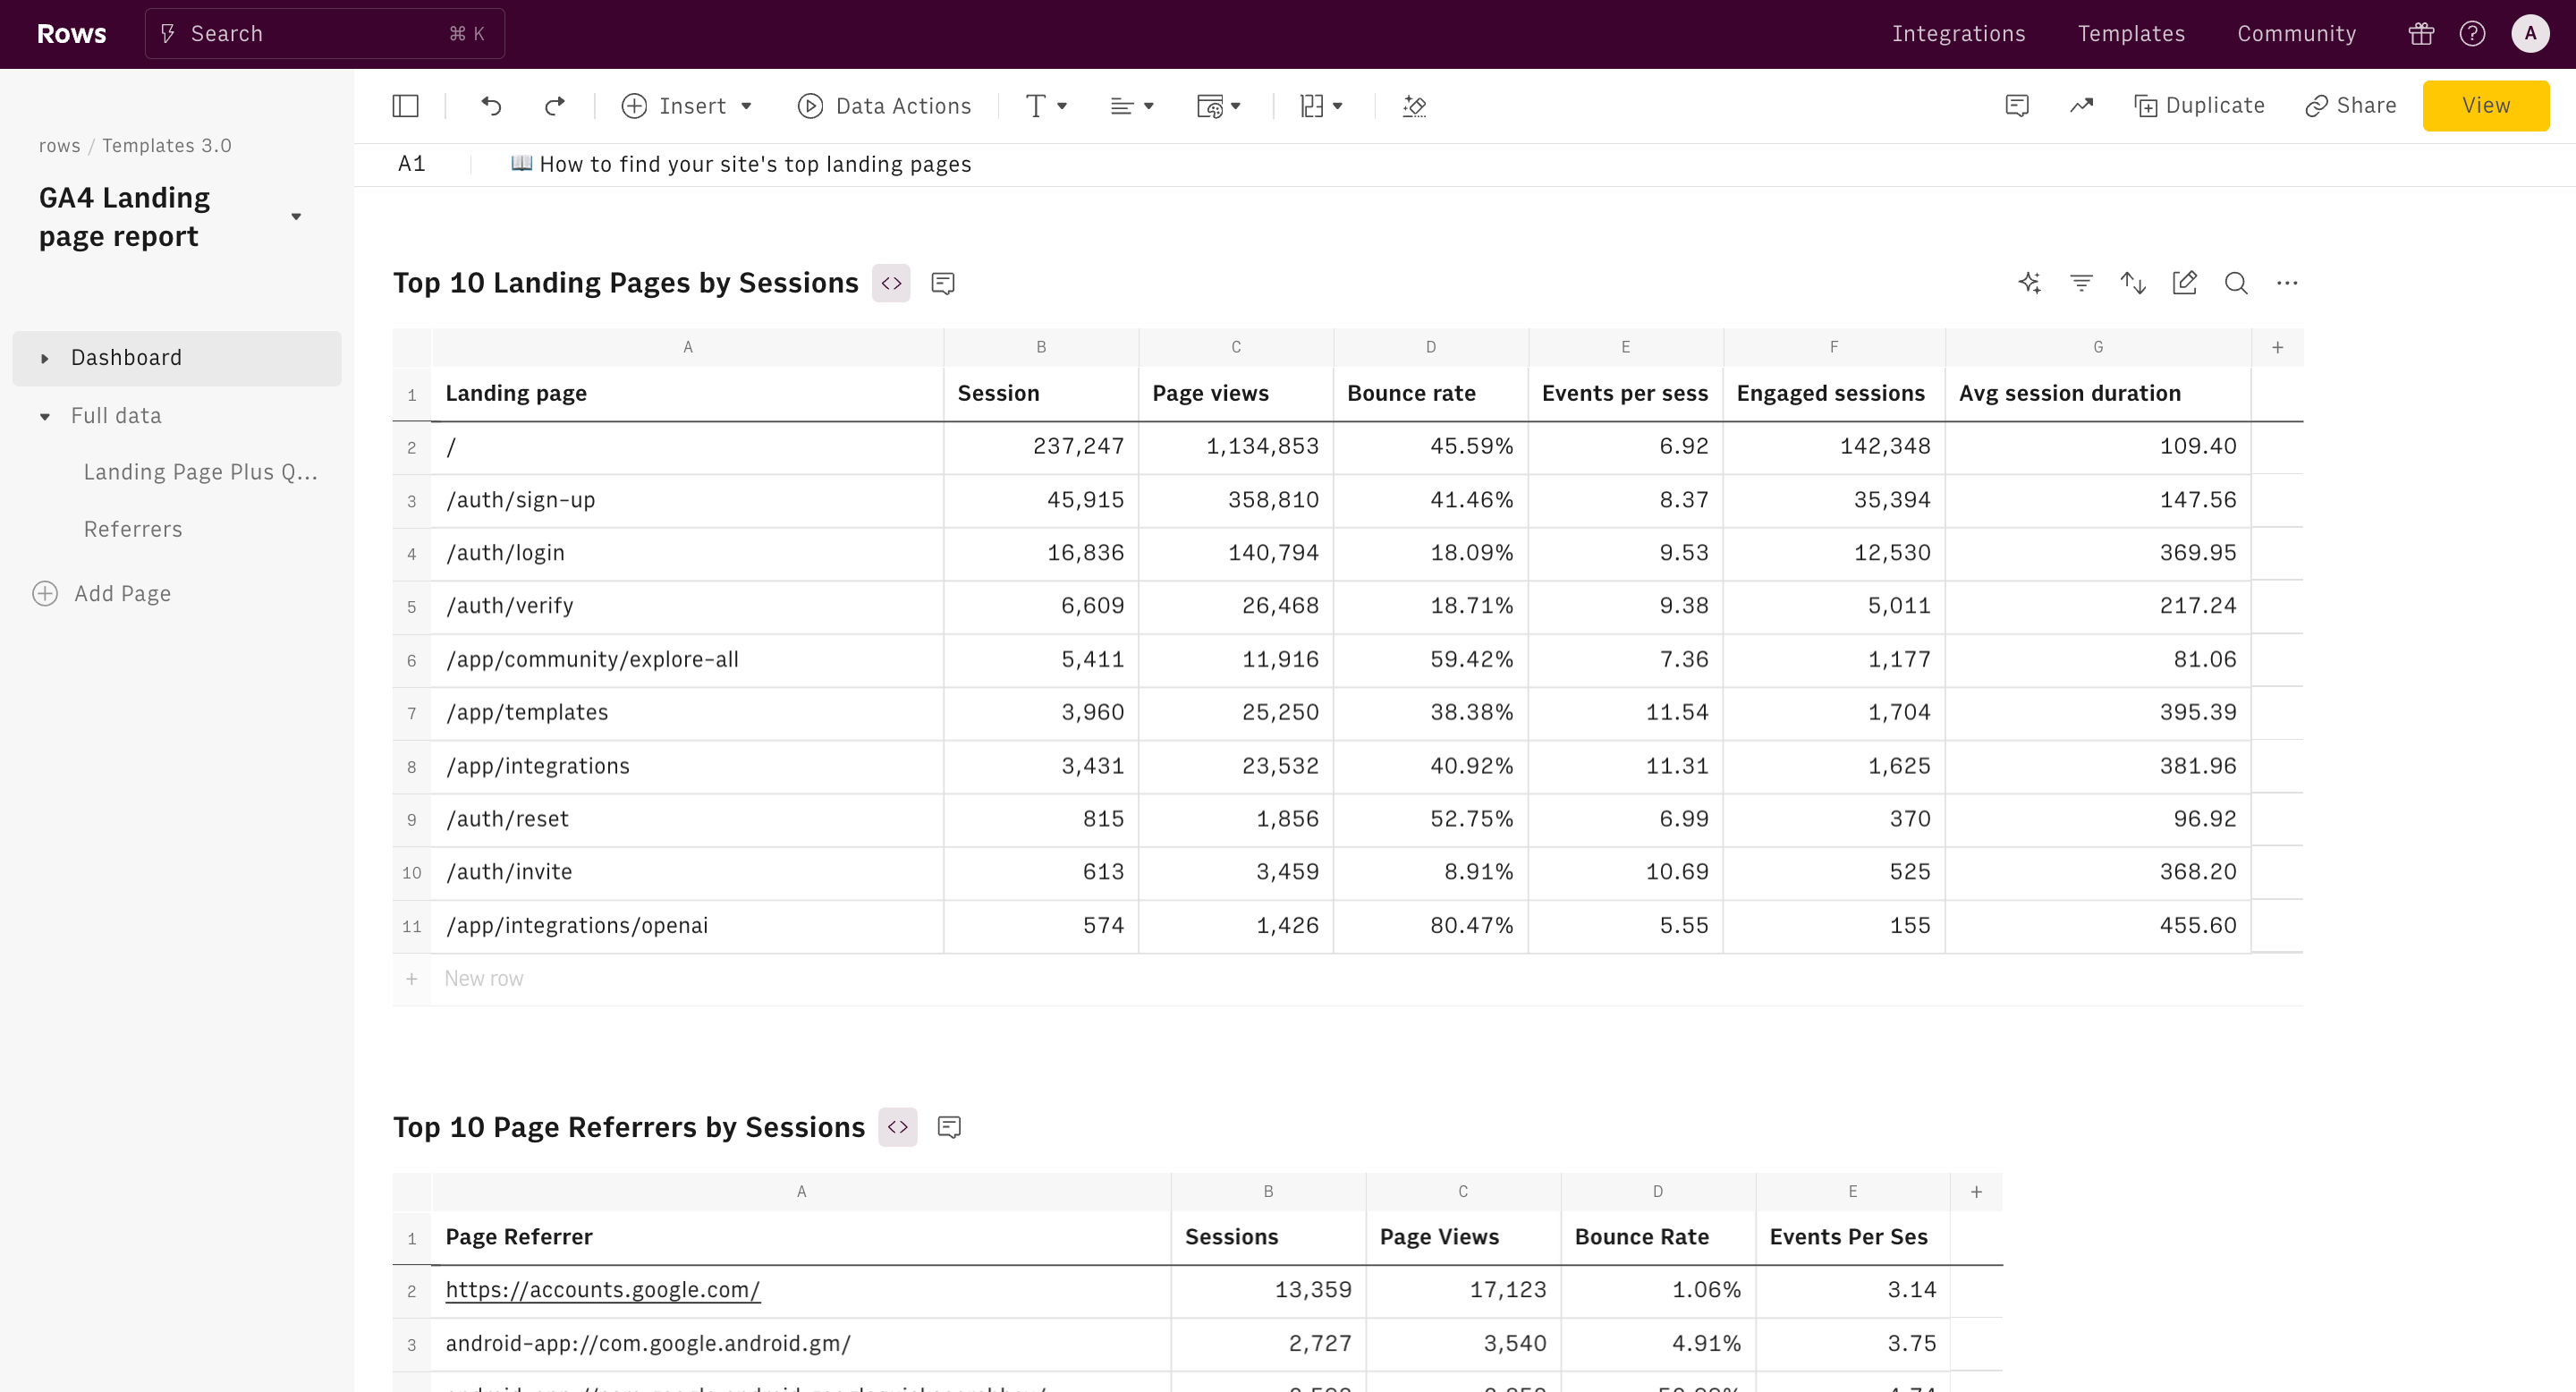
A dedicated 'Organic search' page consolidates data from Google Search Console, offering detailed insights into your organic traffic performance. You can view weekly trends, analyze purchase behavior, and track revenue generated specifically from organic search visitors. This feature helps you understand the impact of your SEO efforts and content marketing strategies. What's more, you can distinguish between purchases coming from Branded vs Non-branded traffic thank to an estimation model based on daily organic traffic data.
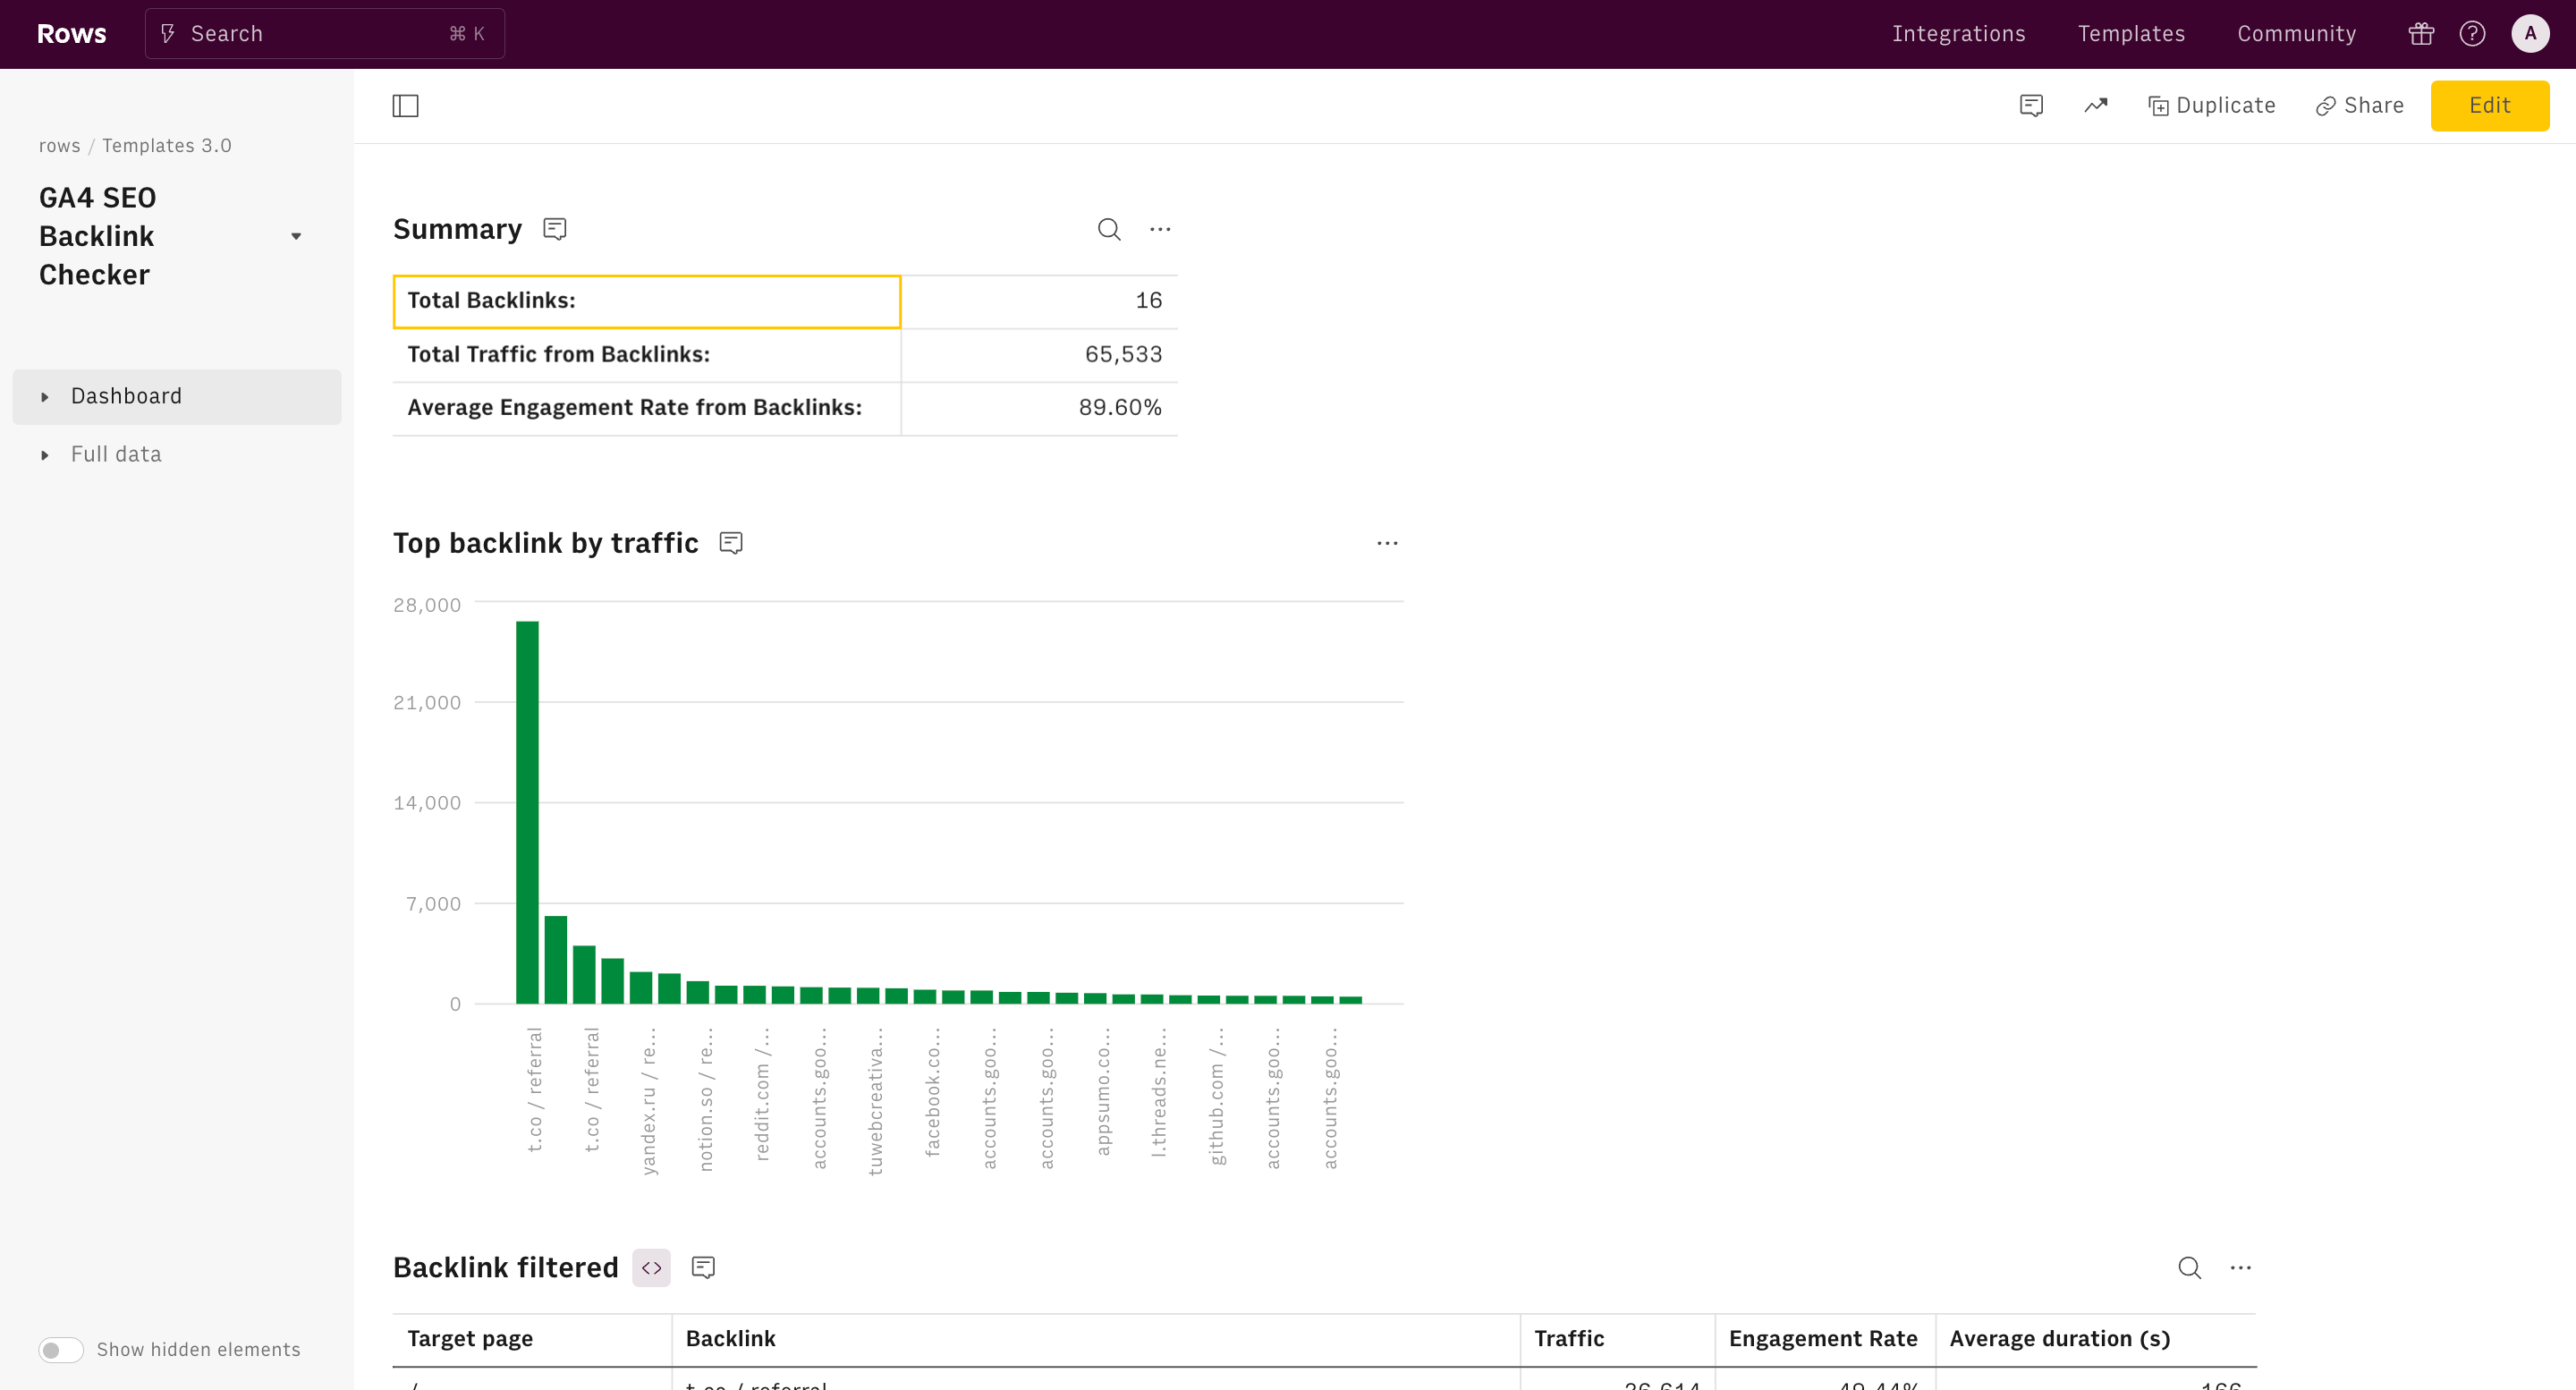
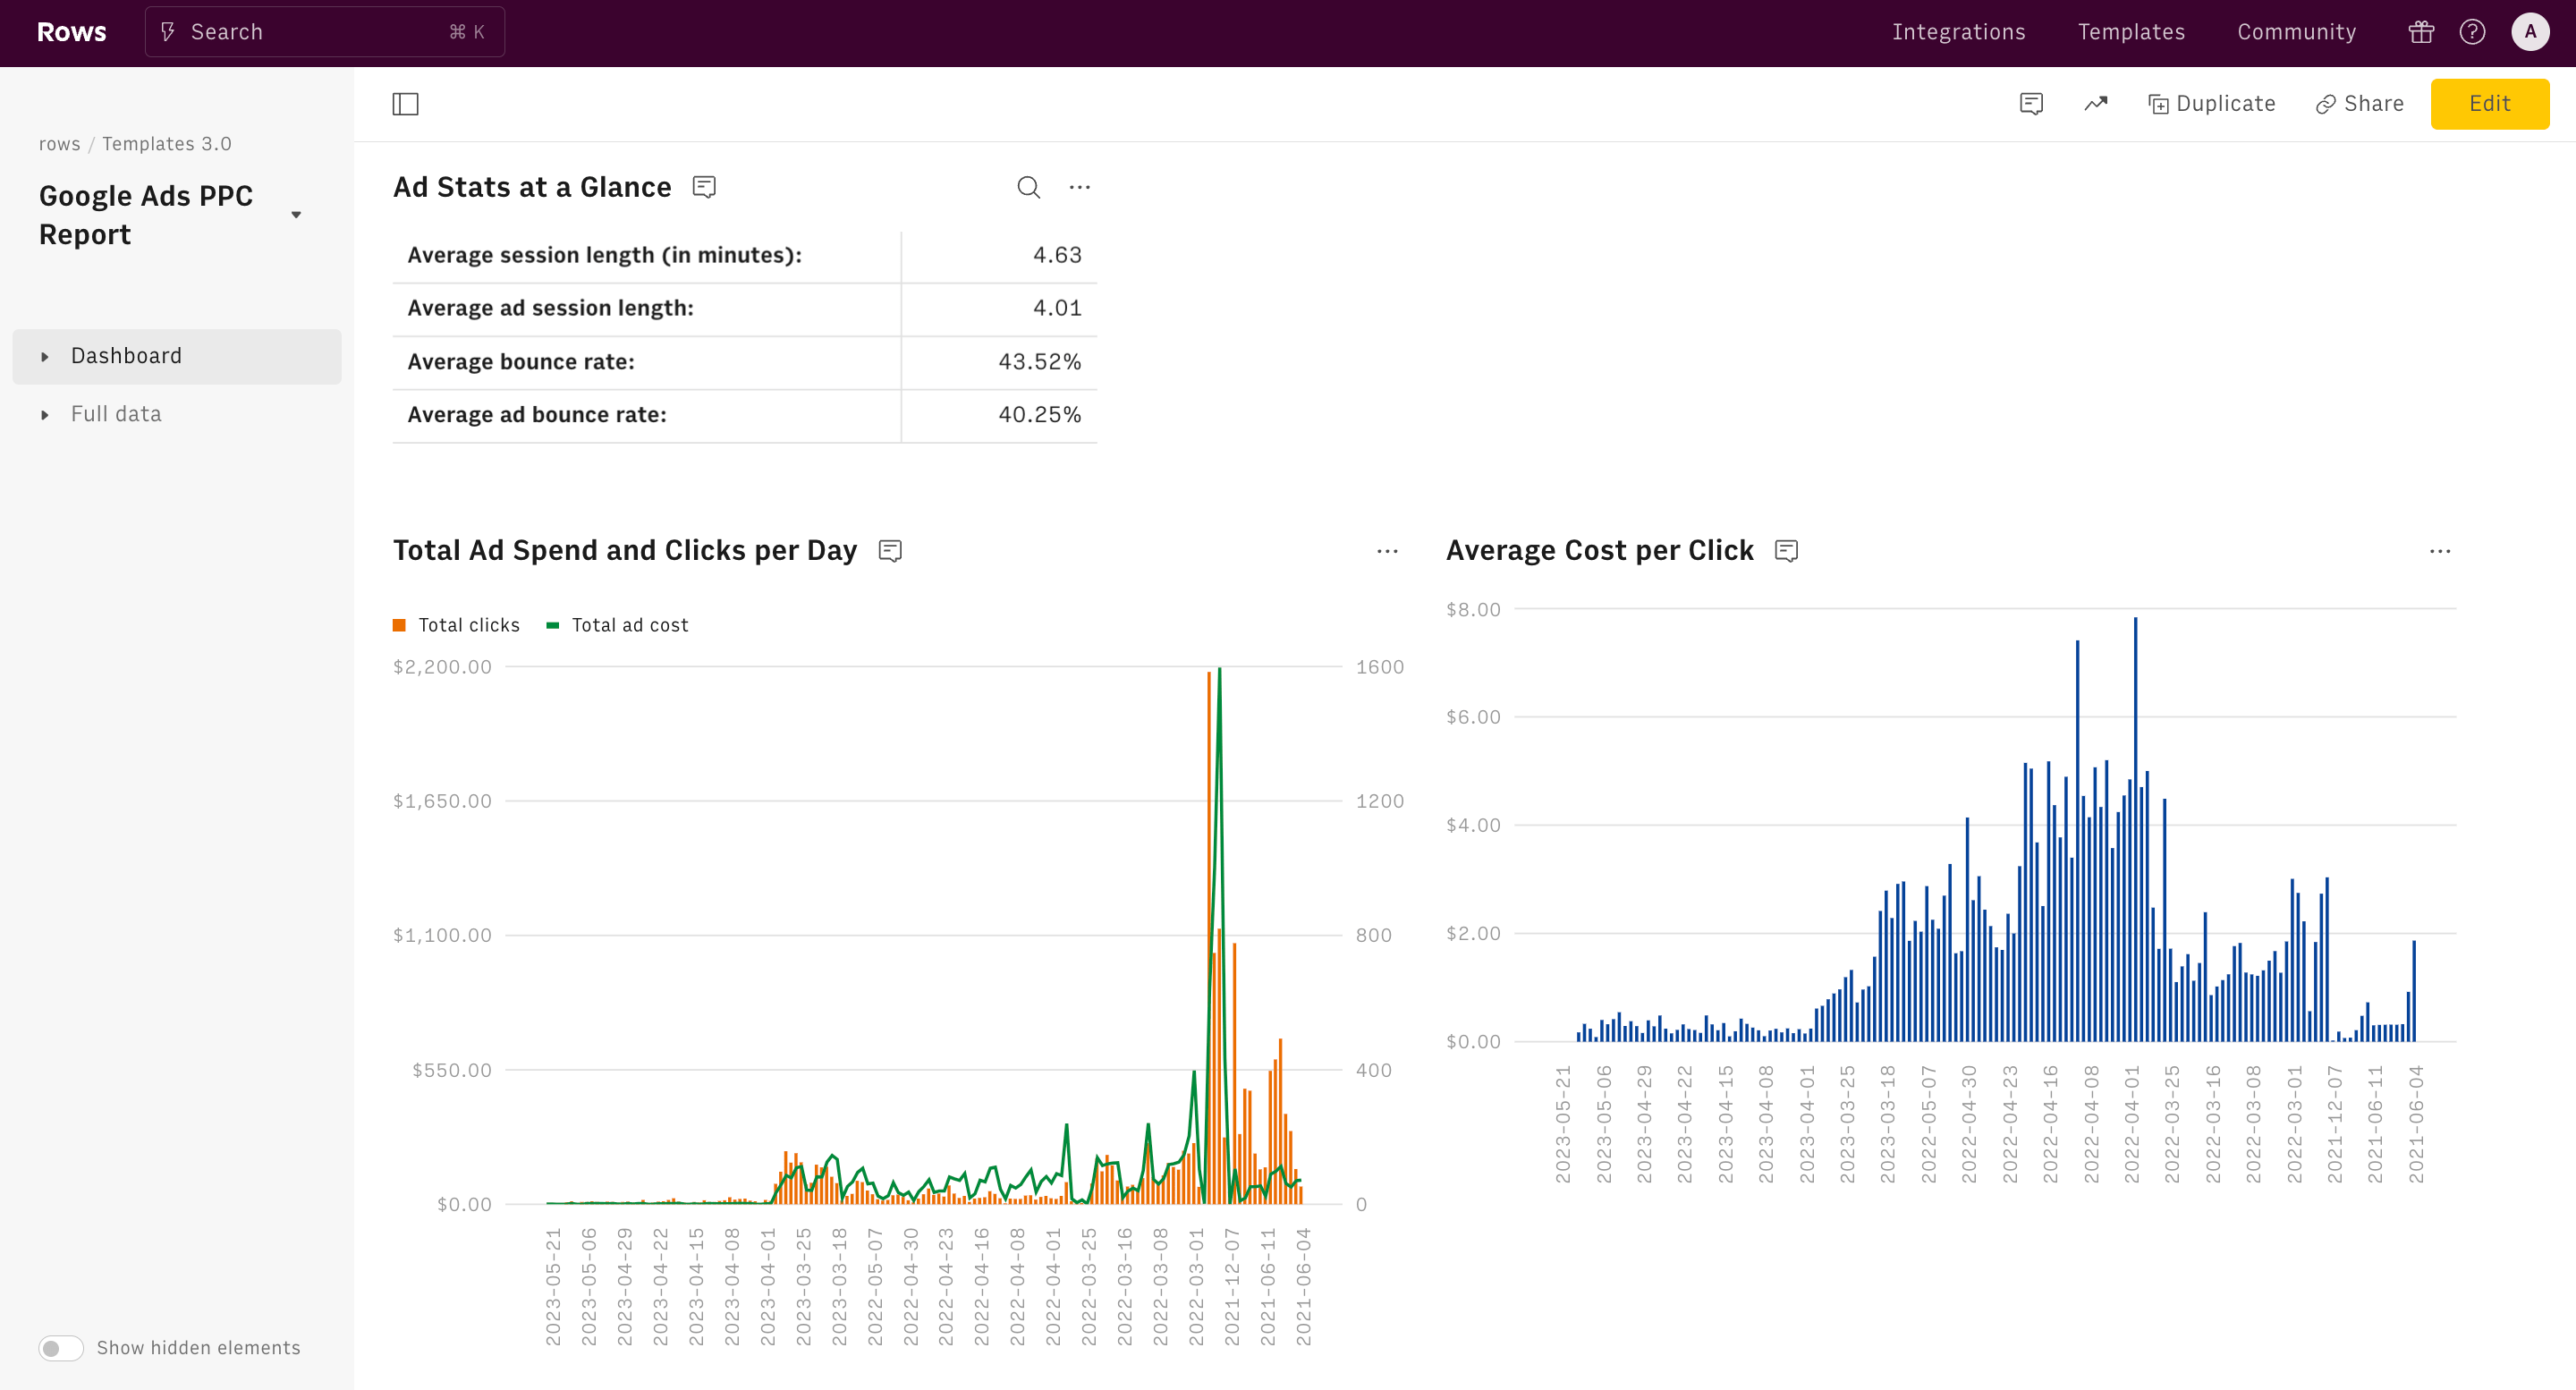
Granular Paid Channel Insights
The following pages include individual pages for each major paid advertising platform:
- Google Ads: Track clicks, impressions, conversions, and revenue from your Google Ads campaigns.
- Facebook Ads and Instagram Ads: Monitor the effectiveness of your Facebook and Instagram advertising efforts, including engagement metrics and conversion data.
- LinkedIn Ads Evaluation: specifically designed for B2B e-commerce businesses, assess the performance of your LinkedIn advertising campaigns, including lead generation and conversion metrics.
How to Set Up the E-commerce Marketing Dashboard
Step 1:
On this page, click on the "Use template" button and save the template in one of your folders.
Step 2:
Follow the instructions to connect your GA4, Ads platforms, and Google Search Console accounts. This template is connected directly and will import live data from your channels.
Step 3:
Pick a date range to start analyzing your data.
Key Insights to Focus On in Your E-commerce Marketing Dashboard
Custom Date Range Analysis
Adjust the time period to easily monitor specific campaign durations. You can either pick a single date range for the entire dashboard, or select specific one for each channel in case not all of them are active simultaneously. This feature enables both short-term performance tracking and long-term trend analysis.
Cross-Channel Performance check
Easily compare performance across different marketing channels, allowing you to identify which strategies are most effective for your e-commerce business.
Customer Value
Monitor ARPU and ARPPU to understand the value each customer brings and how it varies across channels.
Conversion Metrics
Keep a close eye on order numbers and purchaser counts to track your conversion effectiveness.
ROAS Trends
Watch for changes in ROAS over time to quickly identify and address any declines in marketing efficiency.
Start tracking these metrics as soon as you have sufficient data to draw meaningful insights, typically after at least a month of consistent e-commerce operations. Remember, the true power of this dashboard lies in tracking trends over time, so be patient and consistent in your analysis.
How it works


How it works
Get started
Click on 'Use template' and start using it right away. No forms, no signup. Your data first.
Connect your accounts
Once landed on the spreadsheet, follow the instructions to connect the required integrations and pick your account.
Customize the template and schedule refresh
Once the integration has been connected, all tables will update automatically with your own data. Click on 'Edit Source' to change the retrieved data and automate the data refresh. You can then insert a chart or a pivot table, add a column or personalize formats, using all the regular functions and shortcuts that make spreadsheets great.
Embed tables and charts
Click on the option menu to embed tables and chart on your Notion, Confluence or any other iframe-ready documents.


Questions and answers
Can I use Rows for free?
More than an E-commerce Marketing Dashboard
Rows is your new AI Data Analyst. It lets you extract from PDFs, import your business data, and analyze it using plain language.
Signup for free

Import your business data
Extract from PDFs and images, import from files, marketing tools, databases, APIs, and other 3rd-party connectors.
Know moreAnalyze it with AI
Ask AI✨ any question about your dataset - from VLOOKUPs to forecasting models - and surface key insights, trends, and patterns.
Know moreCollaborate and Share
Seamlessly collaborate and share stunning reports with dynamic charts, embed options, and easy export features.
Know more