Google Analytics 4 User Report
Learn more about your website visitors with Google Analytics data on traffic source, medium, age range, gender, language, region, interests, and more.

 100% spreadsheet
 Connected to your data
 Daily+ refresh
 Embed everywhere
About Google Analytics 4 User Report
Google Analytics 4 user properties tell your website or app’s demographics story. Who visits your site? How old are they? Where do they live, and what language do they speak? Which website source or medium sent them to your site?
Google Universal Analytics (the previous version before GA4) tracked demographics automatically. In Google Analytics 4, though, new accounts will show no demographic data by default.
Every Google Analytics 4 account will return user country, continent, and language details. If your Google Analytics User report returns no demographics data, including gender, age range, interests, source, and medium, you may need to enable Google Analytics’ signals data collection in your GA4 settings, then wait a few days for Google to have enough sampled data to display.
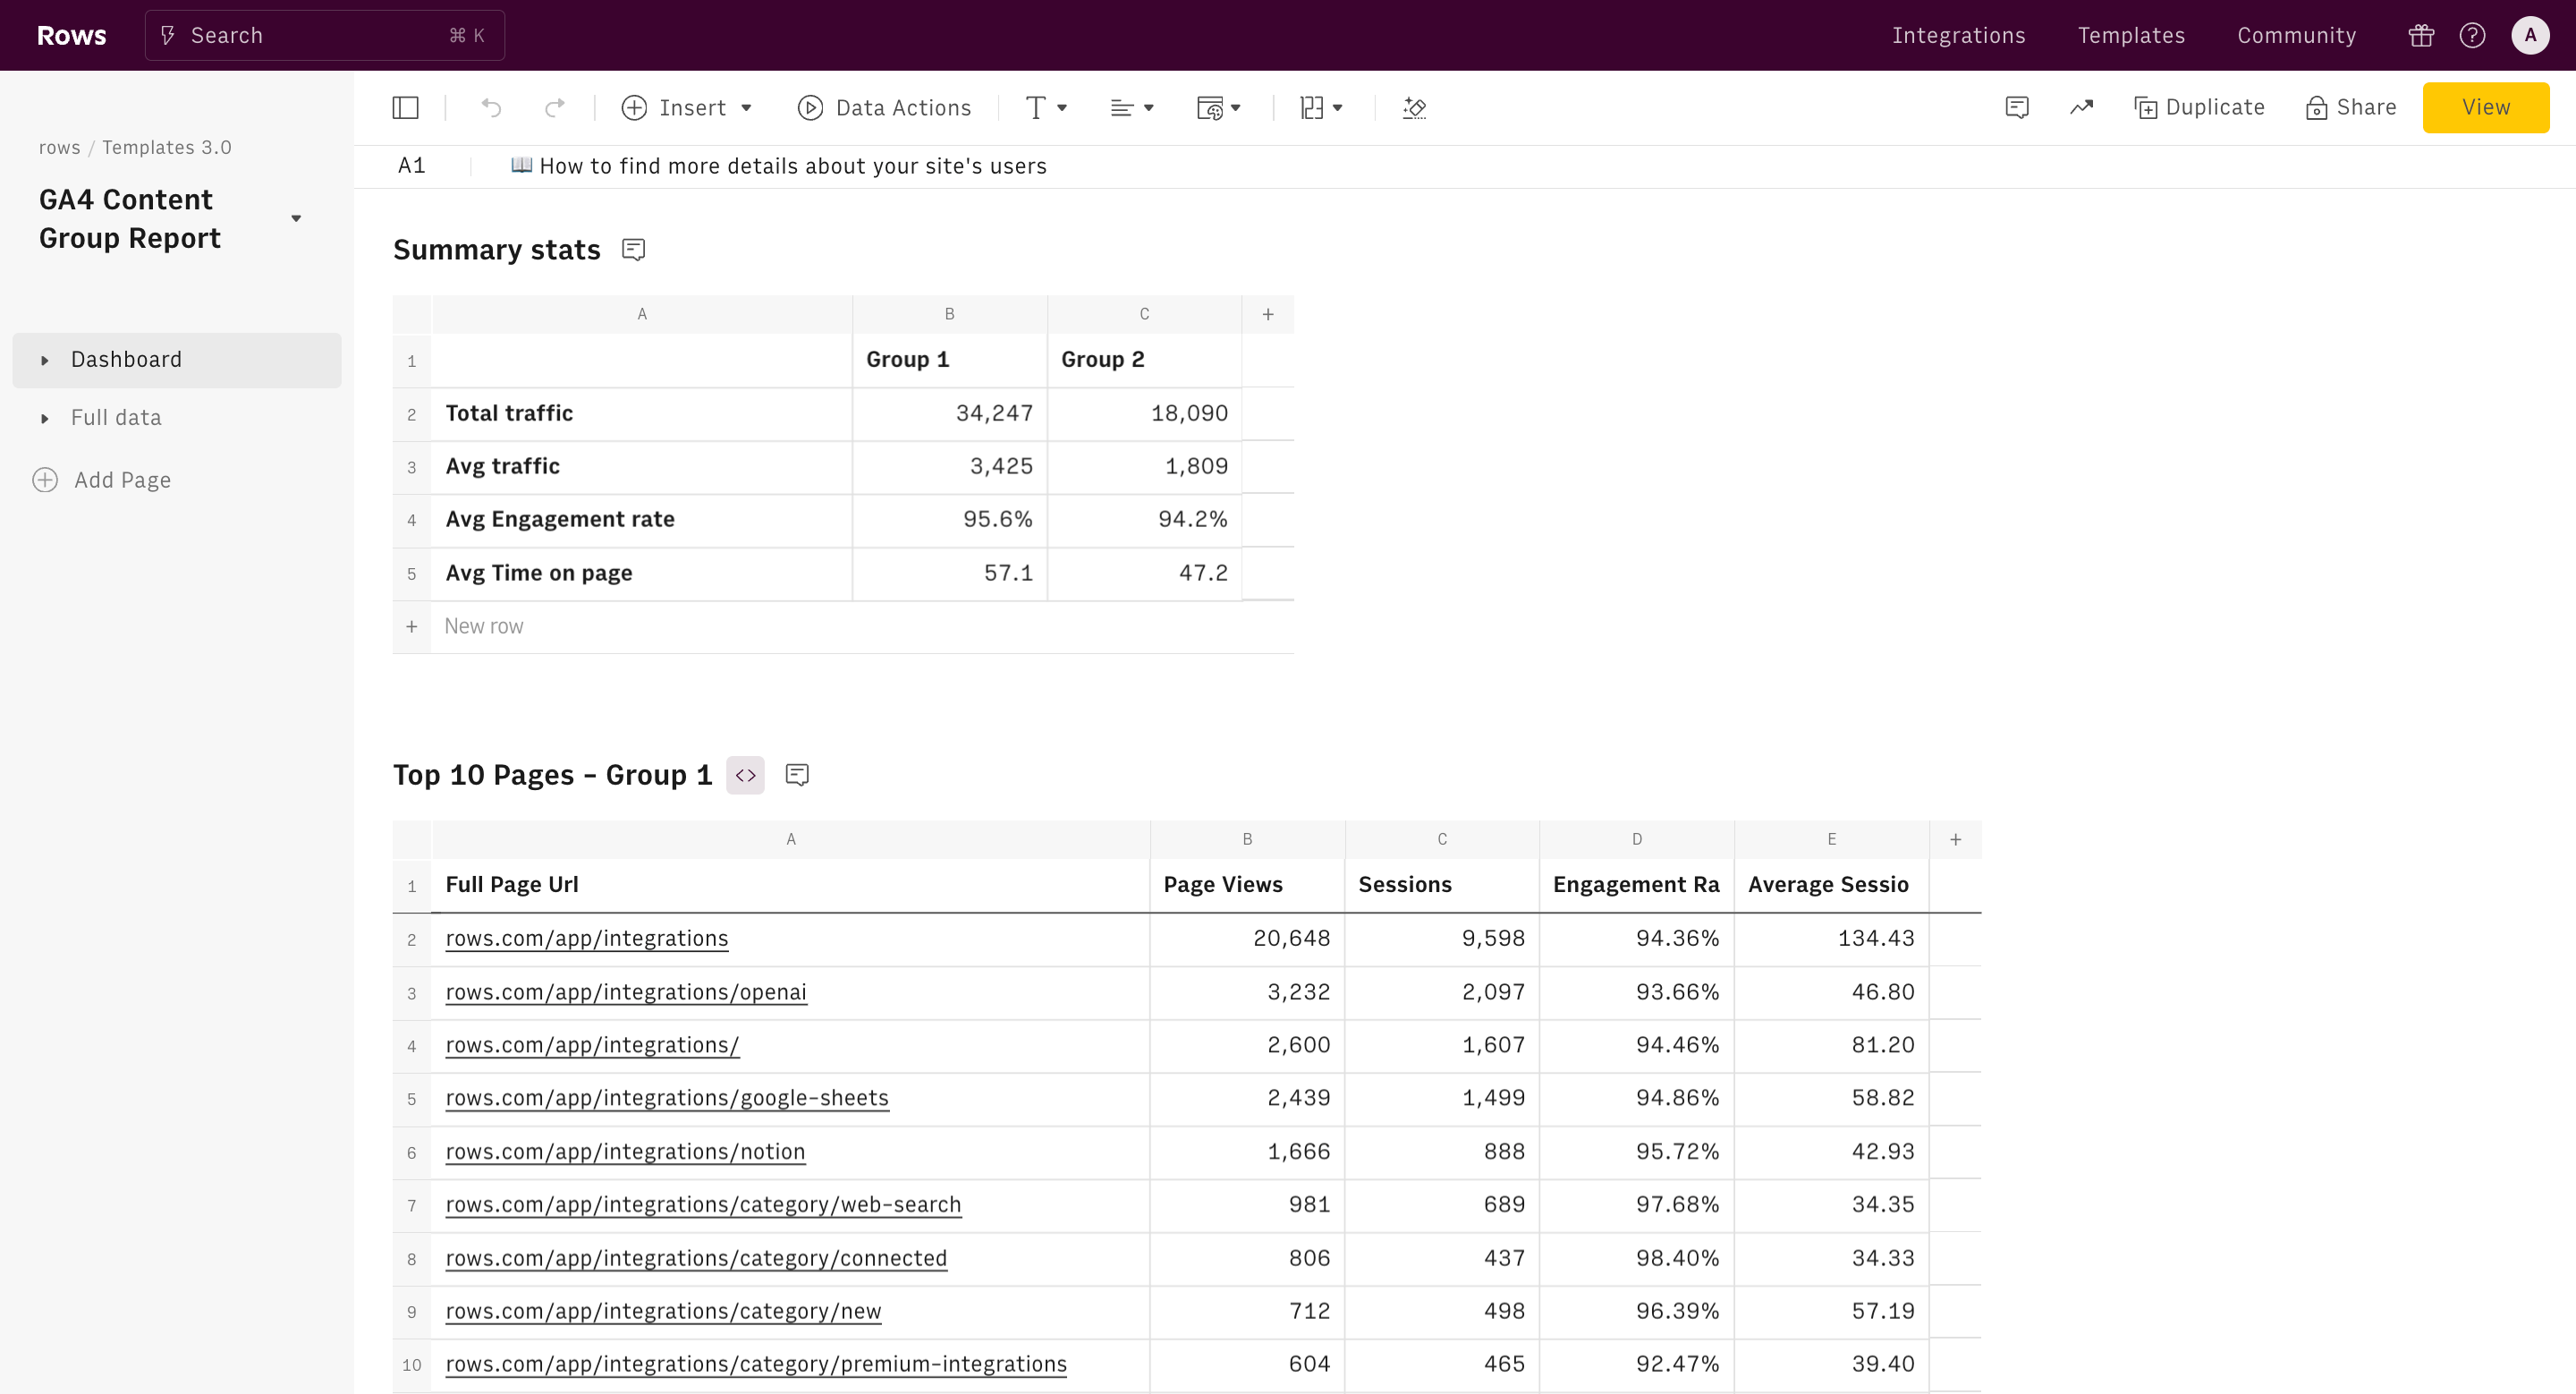
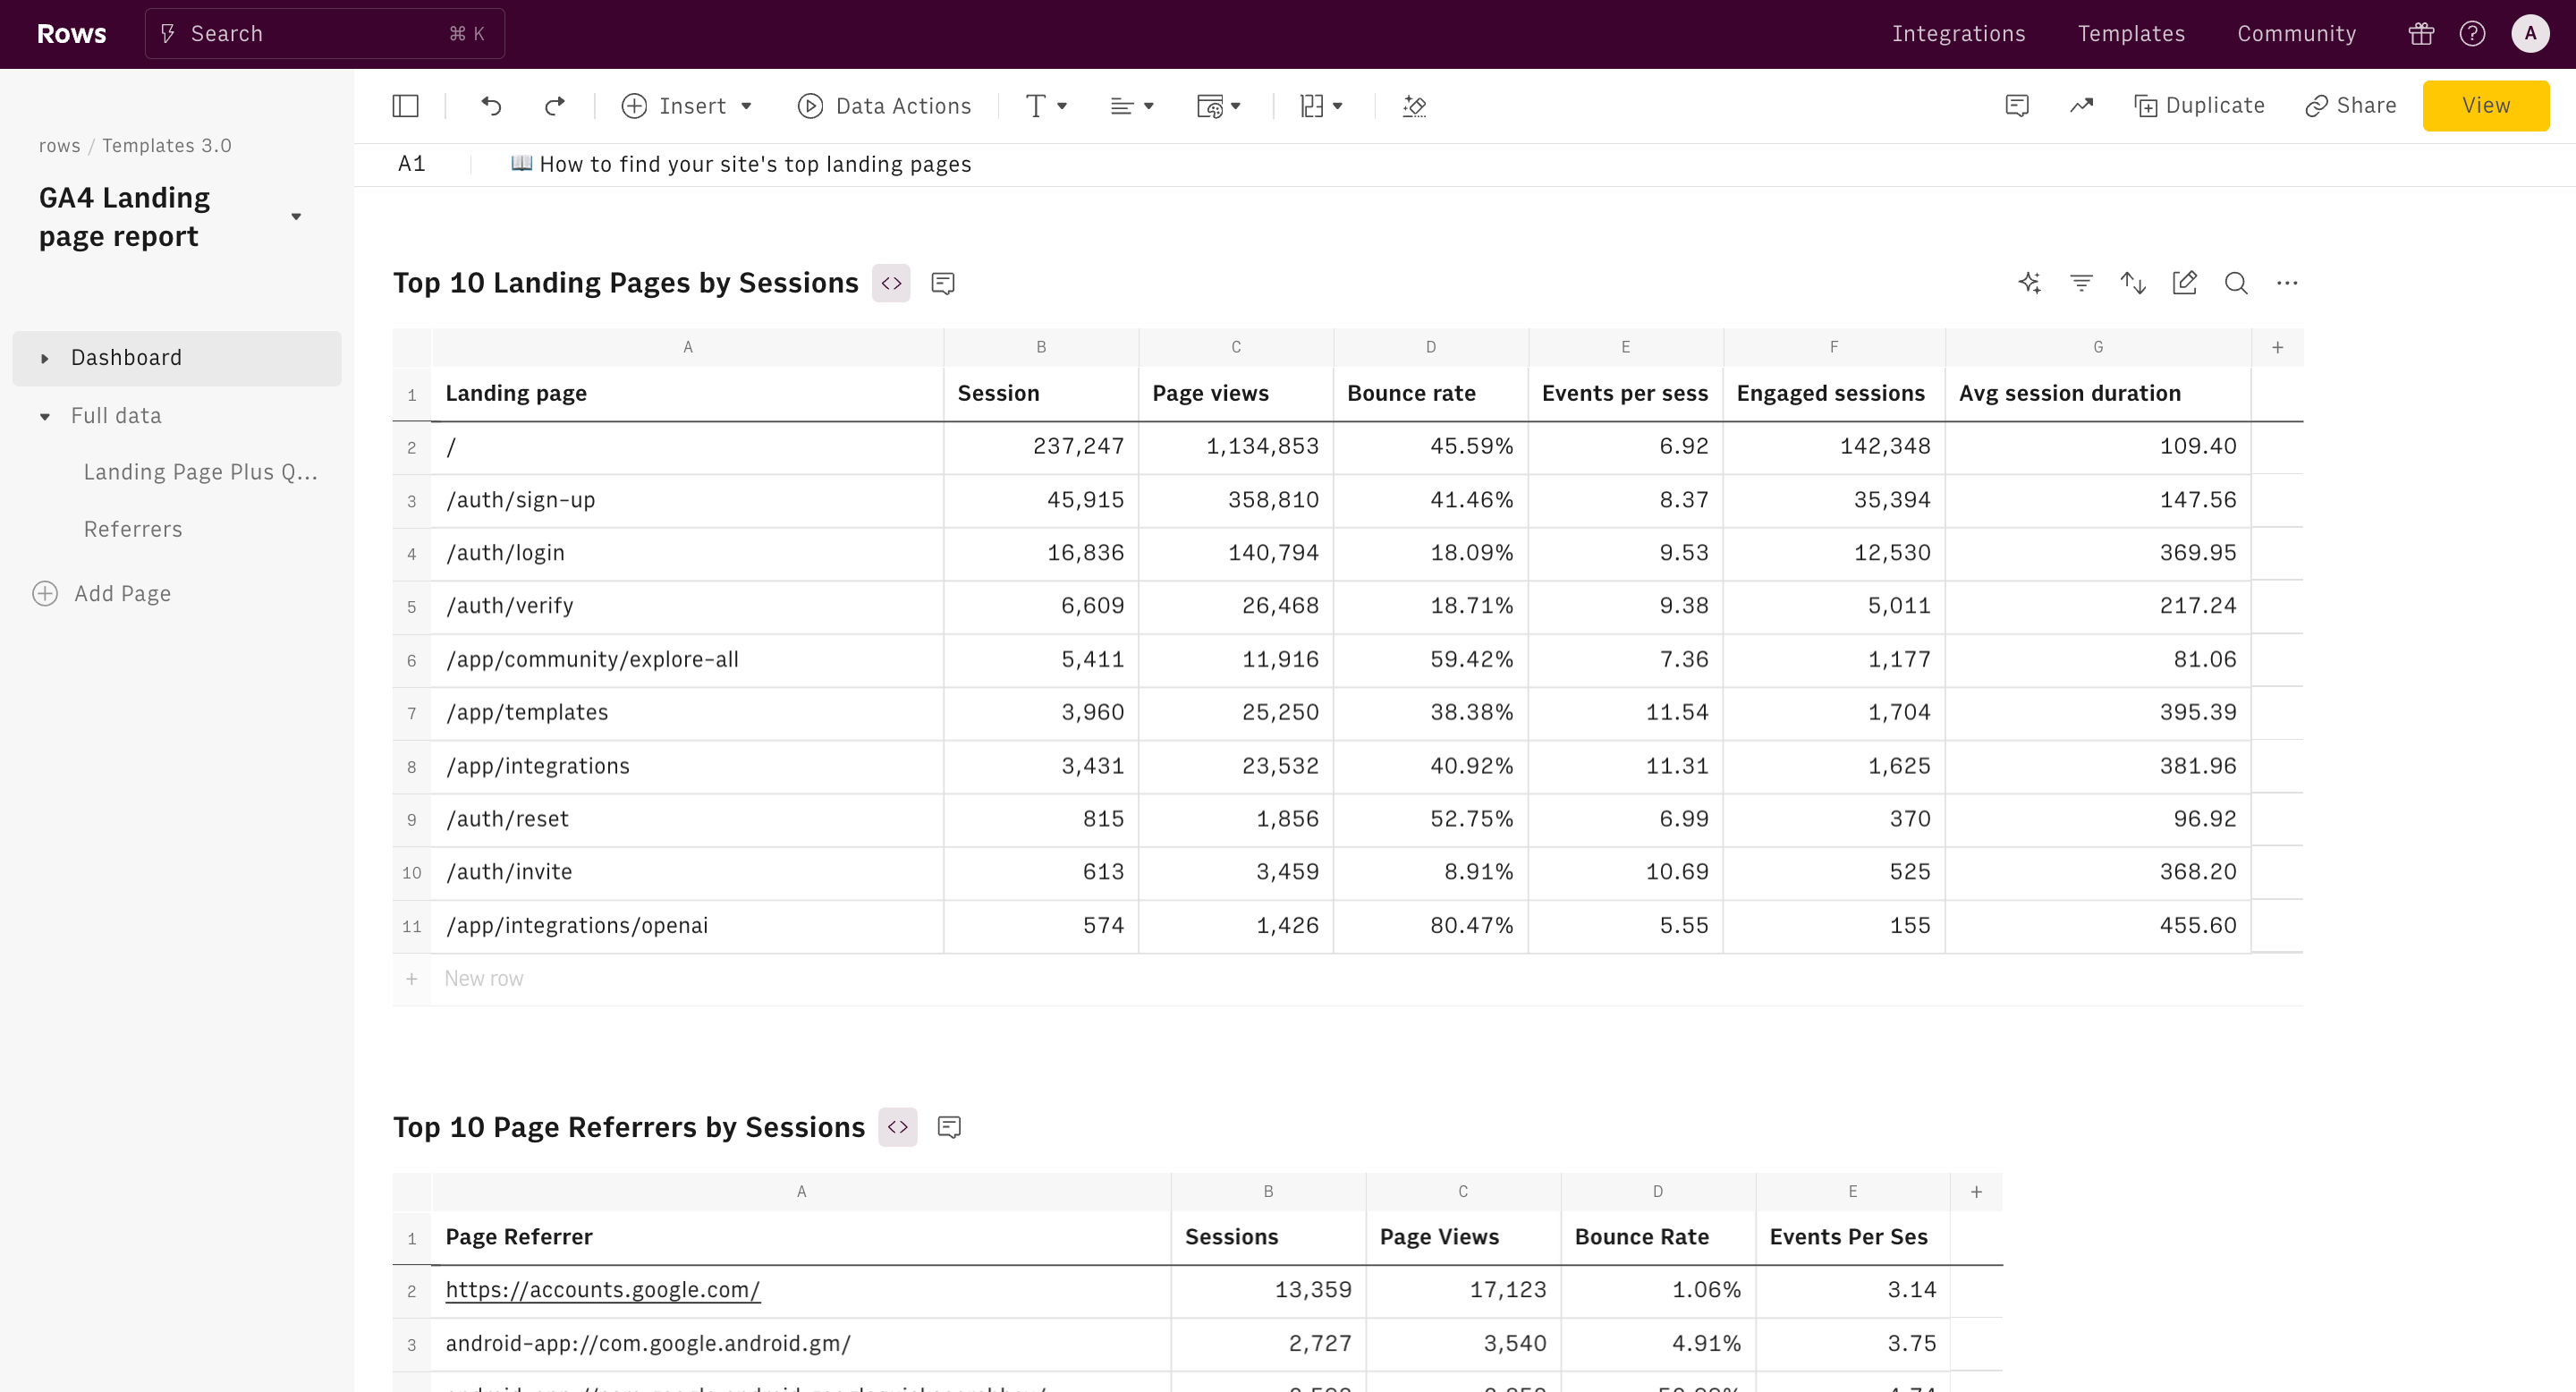
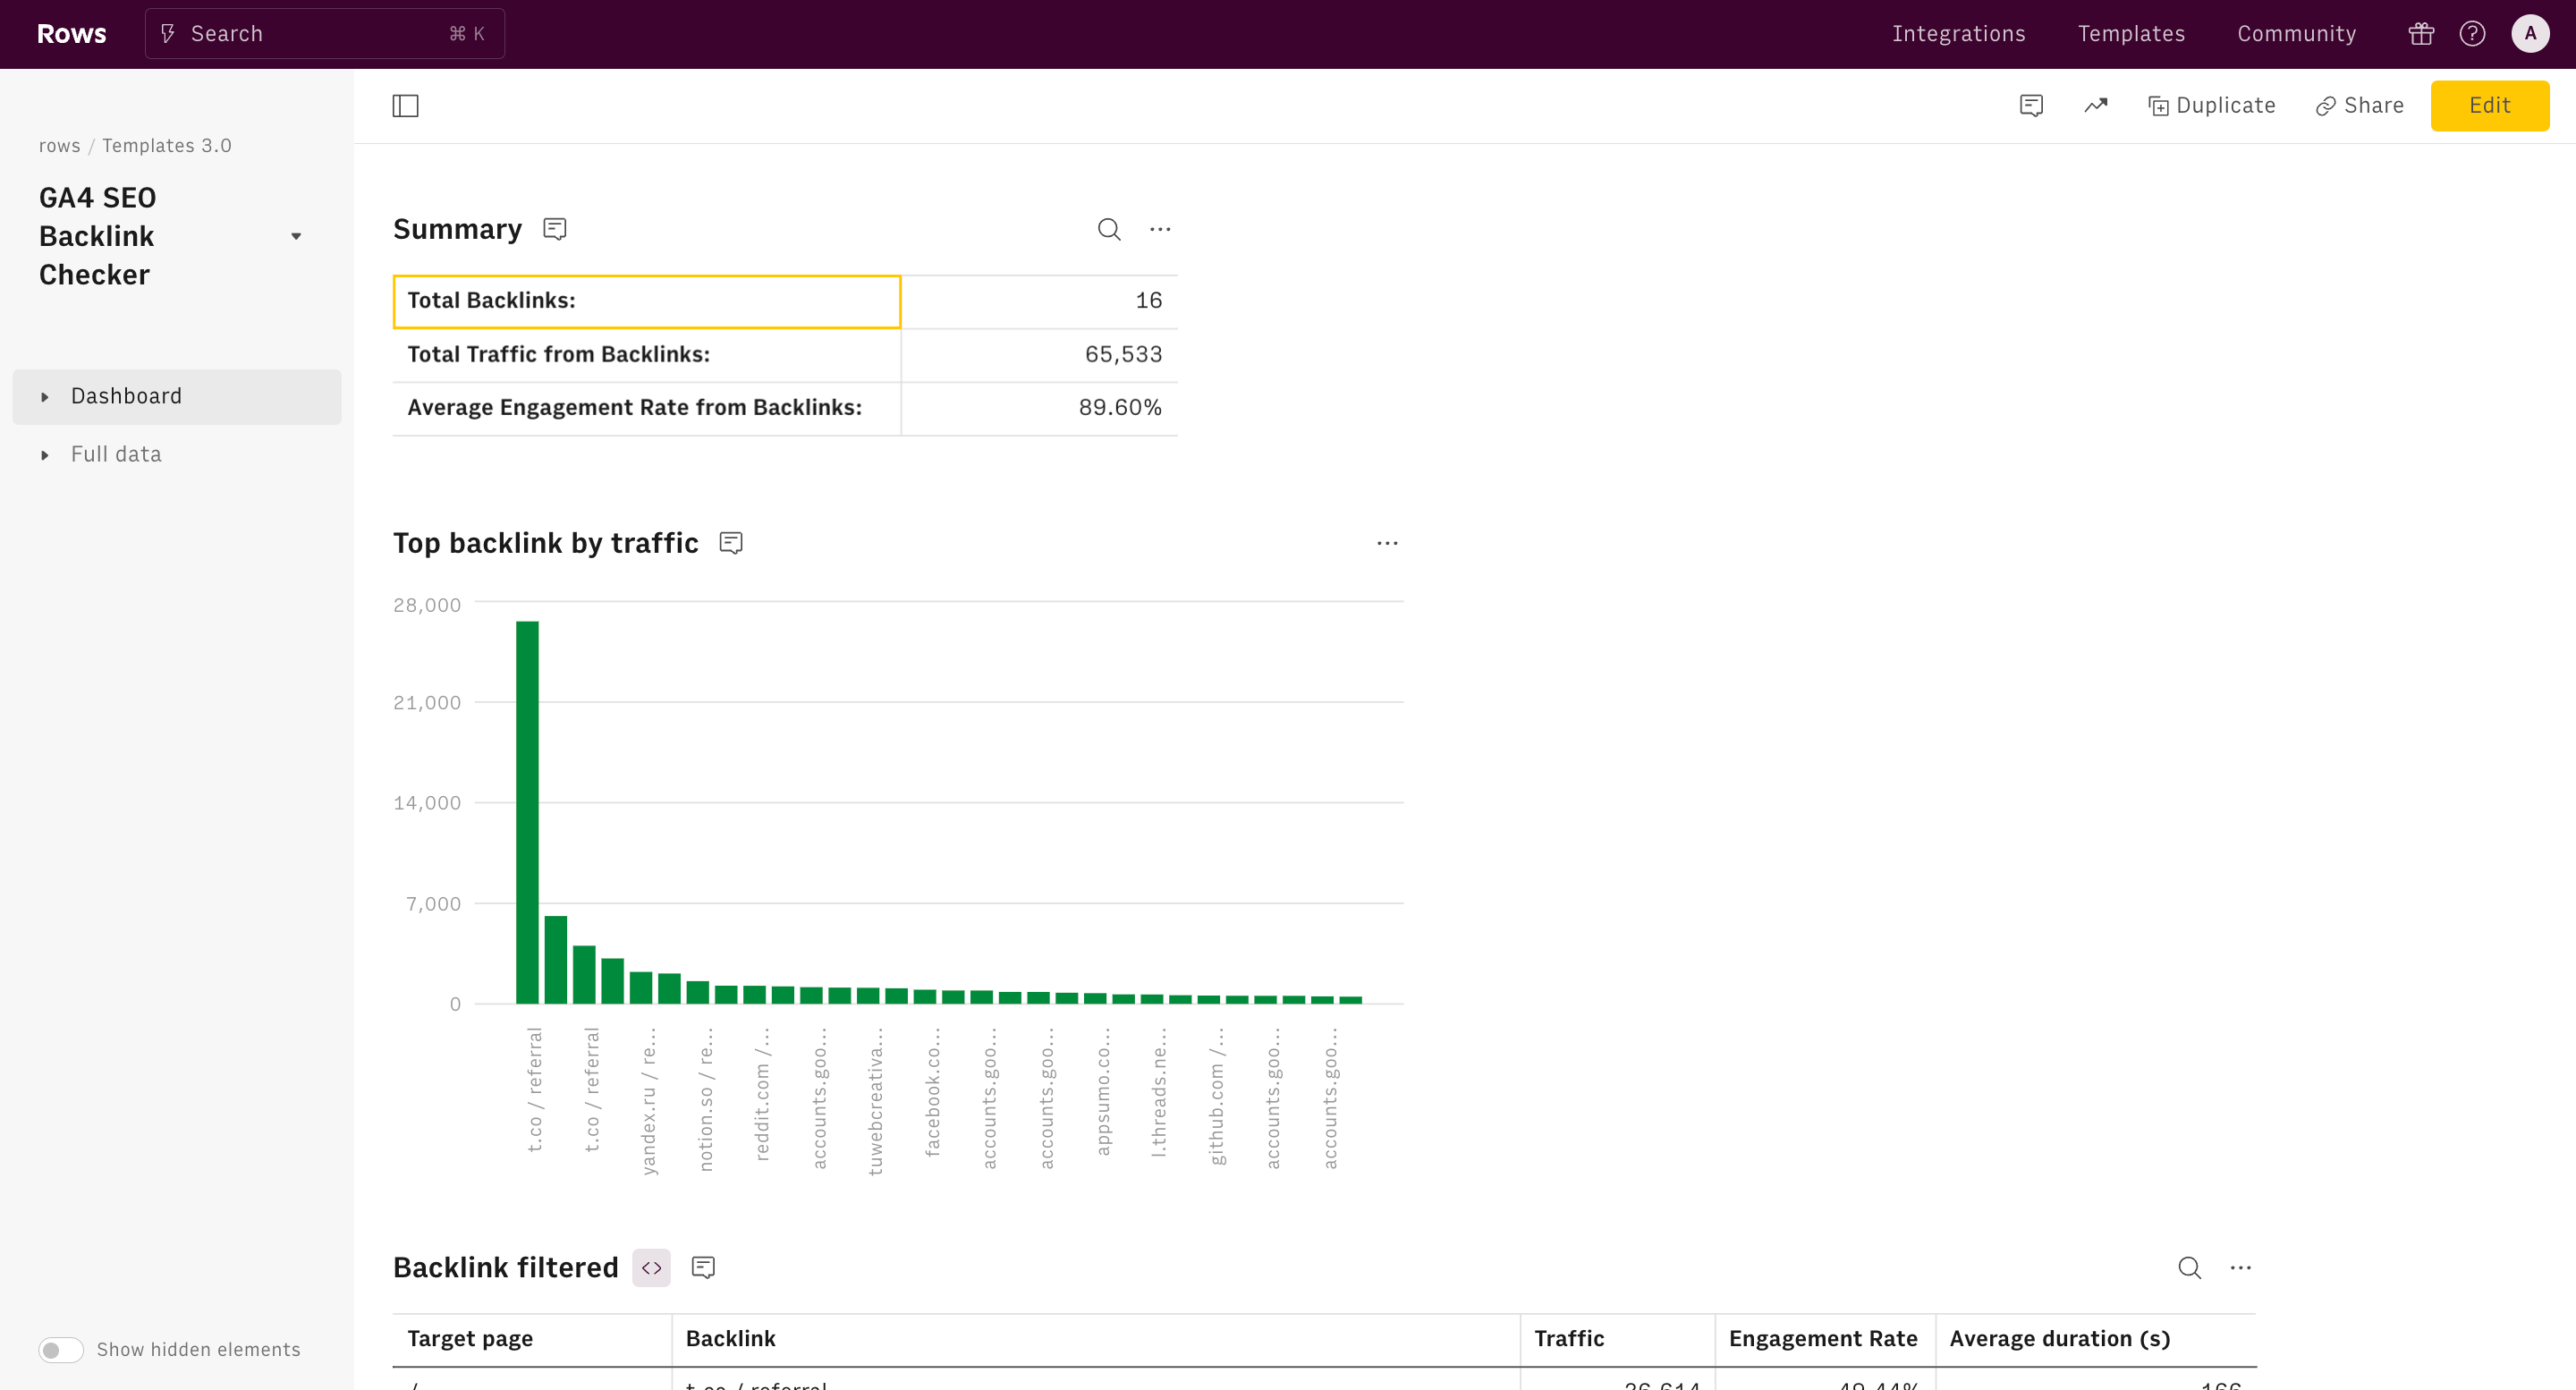
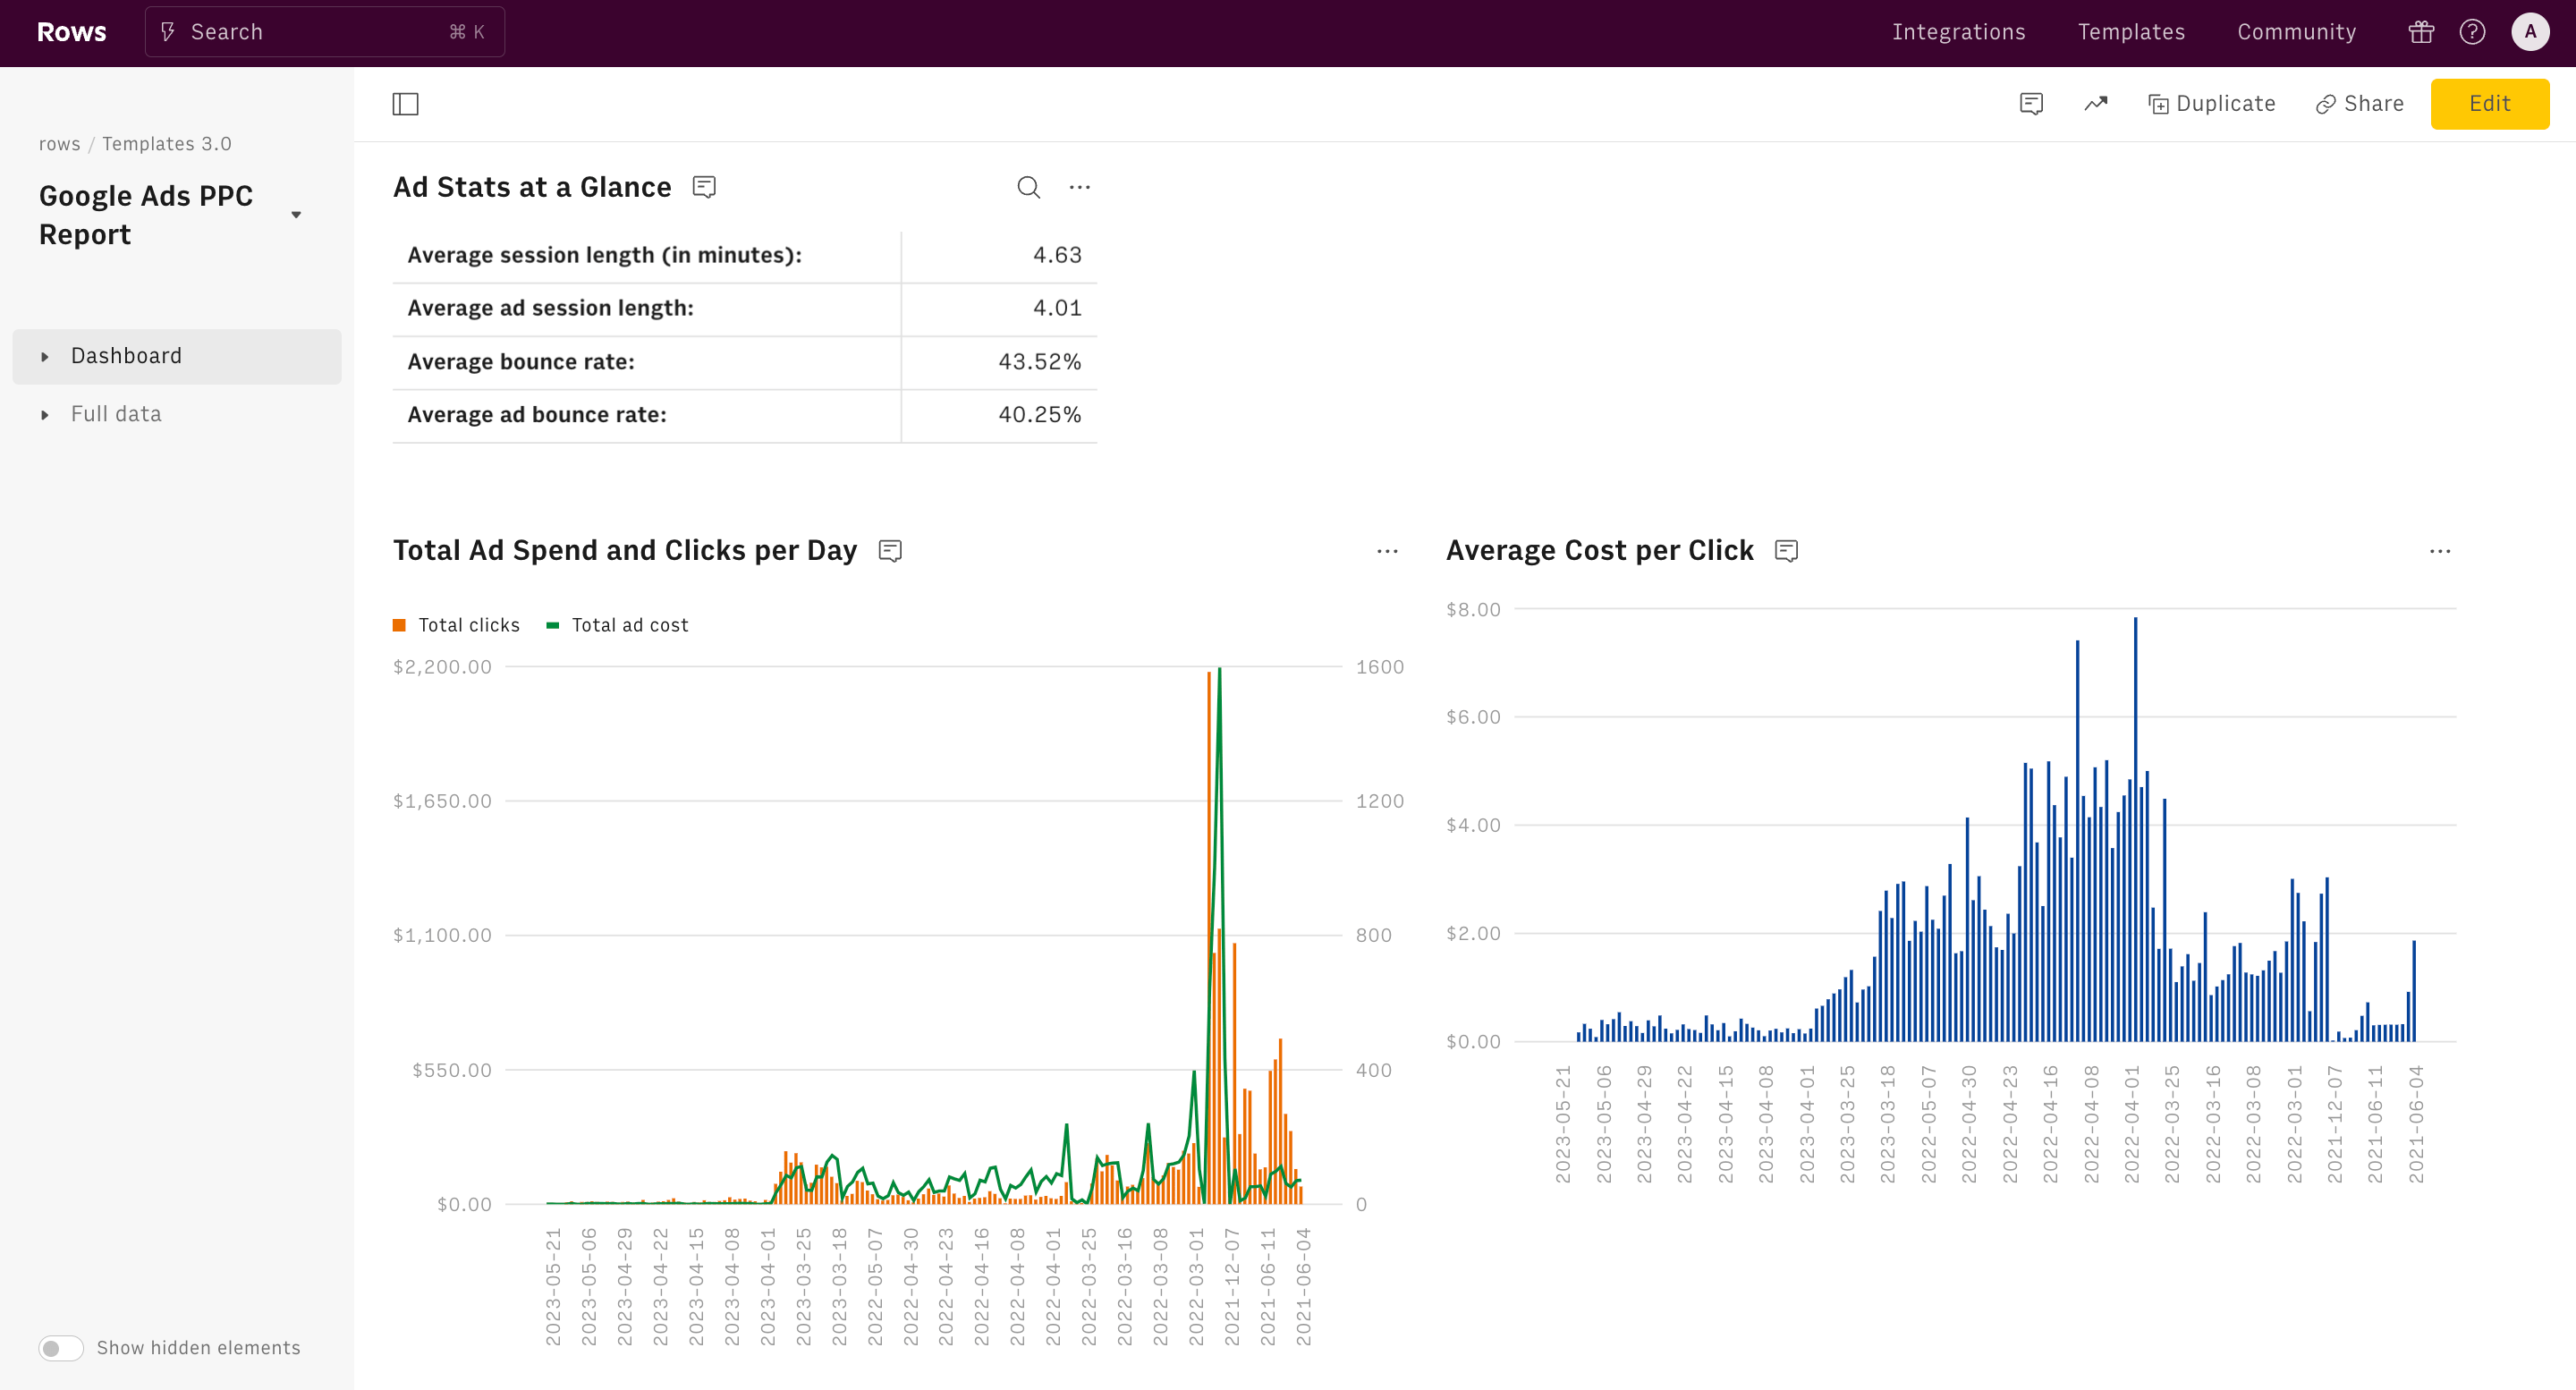
This template gives you quick takeaways from your website’s Google Analytics demographics data, including your audience’s top age brackets, gender, languages, countries, and interests. It also shows your site’s top GA4 sources and mediums to track your traffic acquisition. Drill down further with included tables that contain your site’s complete GA4 user properties reports, get a quick overview of your demographics with built-in graphs, or analyze your site’s data with Rows’ built-in GPT-powered AI.
How it works


How it works
Get started
Click on 'Use template' and start using it right away. No forms, no signup. Your data first.
Connect your Google Analytics 4 account
Once landed on the spreadsheet, follow the instructions to connect the required integration and pick your account.
Customize the template and schedule refresh
Once the integration has been connected, all tables will update automatically with your own data. Click on 'Edit Source' to change the retrieved data and automate the data refresh. You can then insert a chart or a pivot table, add a column or personalize formats, using all the regular functions and shortcuts that make spreadsheets great.
Embed tables and charts
Click on the option menu to embed tables and chart on your Notion, Confluence or any other iframe-ready documents.


Questions and answers
Can I use Rows for free?
More than a Google Analytics 4 User Report
Rows is your new AI Data Analyst. It lets you extract from PDFs, import your business data, and analyze it using plain language.
Signup for free

Import your business data
Extract from PDFs and images, import from files, marketing tools, databases, APIs, and other 3rd-party connectors.
Know moreAnalyze it with AI
Ask AI✨ any question about your dataset - from VLOOKUPs to forecasting models - and surface key insights, trends, and patterns.
Know moreCollaborate and Share
Seamlessly collaborate and share stunning reports with dynamic charts, embed options, and easy export features.
Know more