Google Analytics 4 Landing Page Report
Find your website’s top landing pages, see which sites referred the most traffic, and analyze which pages and sources received the most pageviews, had the lowest bounce rate, or saw the most engaged audience.
 100% spreadsheet
 Connected to your data
 Daily+ refresh
 Embed everywhere
About Google Analytics 4 Landing Page Report
Introduction to GA4 Landing Page Reports
Google Analytics 4 tracks everything about your site, including landing pages and the pages where people first arrive. Your homepage or blog index might get more overall traffic, but your top landing page is likely the page linked to a popular website or one that recently went viral after a marketing campaign.
So, the question is — what benefit is the report? The Landing page report is a pre-made detailed report that helps you understand how visitors interact with your website. It shows the first-page visitors land on when they visit your website and how many visitors land on each page. This information can help you identify which pages are performing well and which need improvement.
What is Google Analytics Landing Page Analysis?
Google Analytics Landing Page Analysis evaluates the first pages users encounter when visiting a website. It reveals which pages visitors land on first, providing insights into user behavior and engagement.
Our GA4 landing page report template allows you to find your website’s top landing pages, see which sites referred the most traffic, and analyze which pages and sources received the most pageviews, had the lowest bounce rate, or saw the most engaged audience.
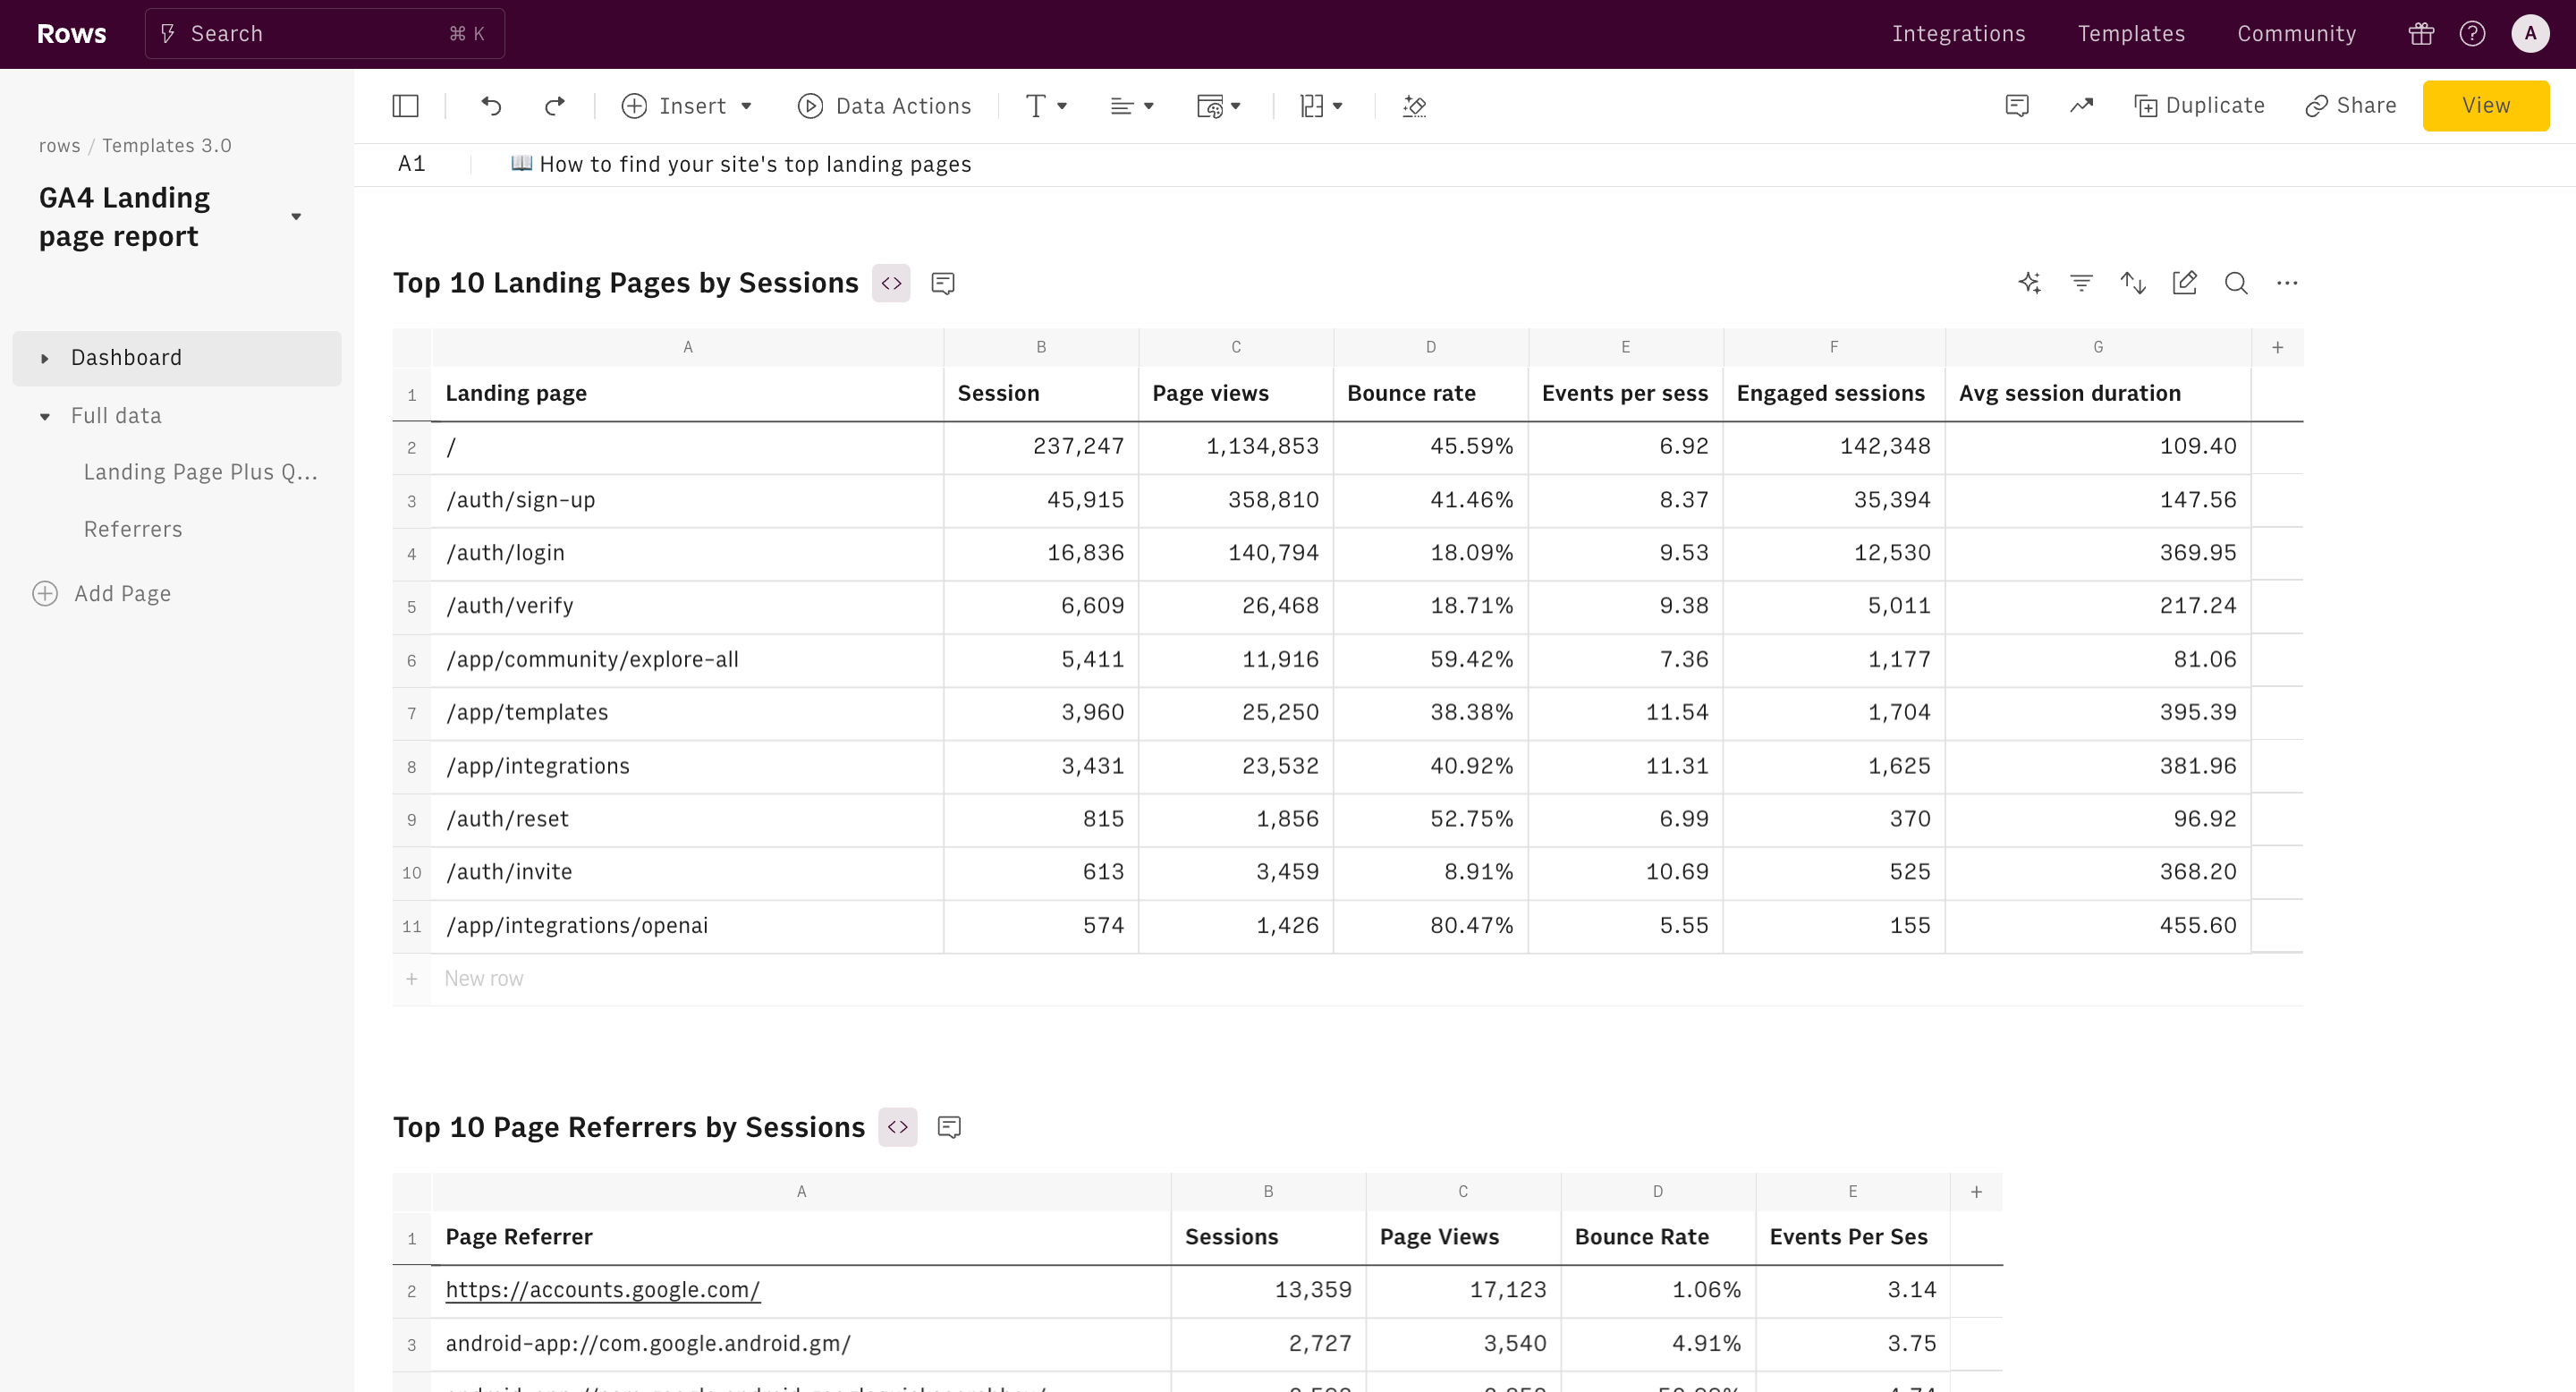
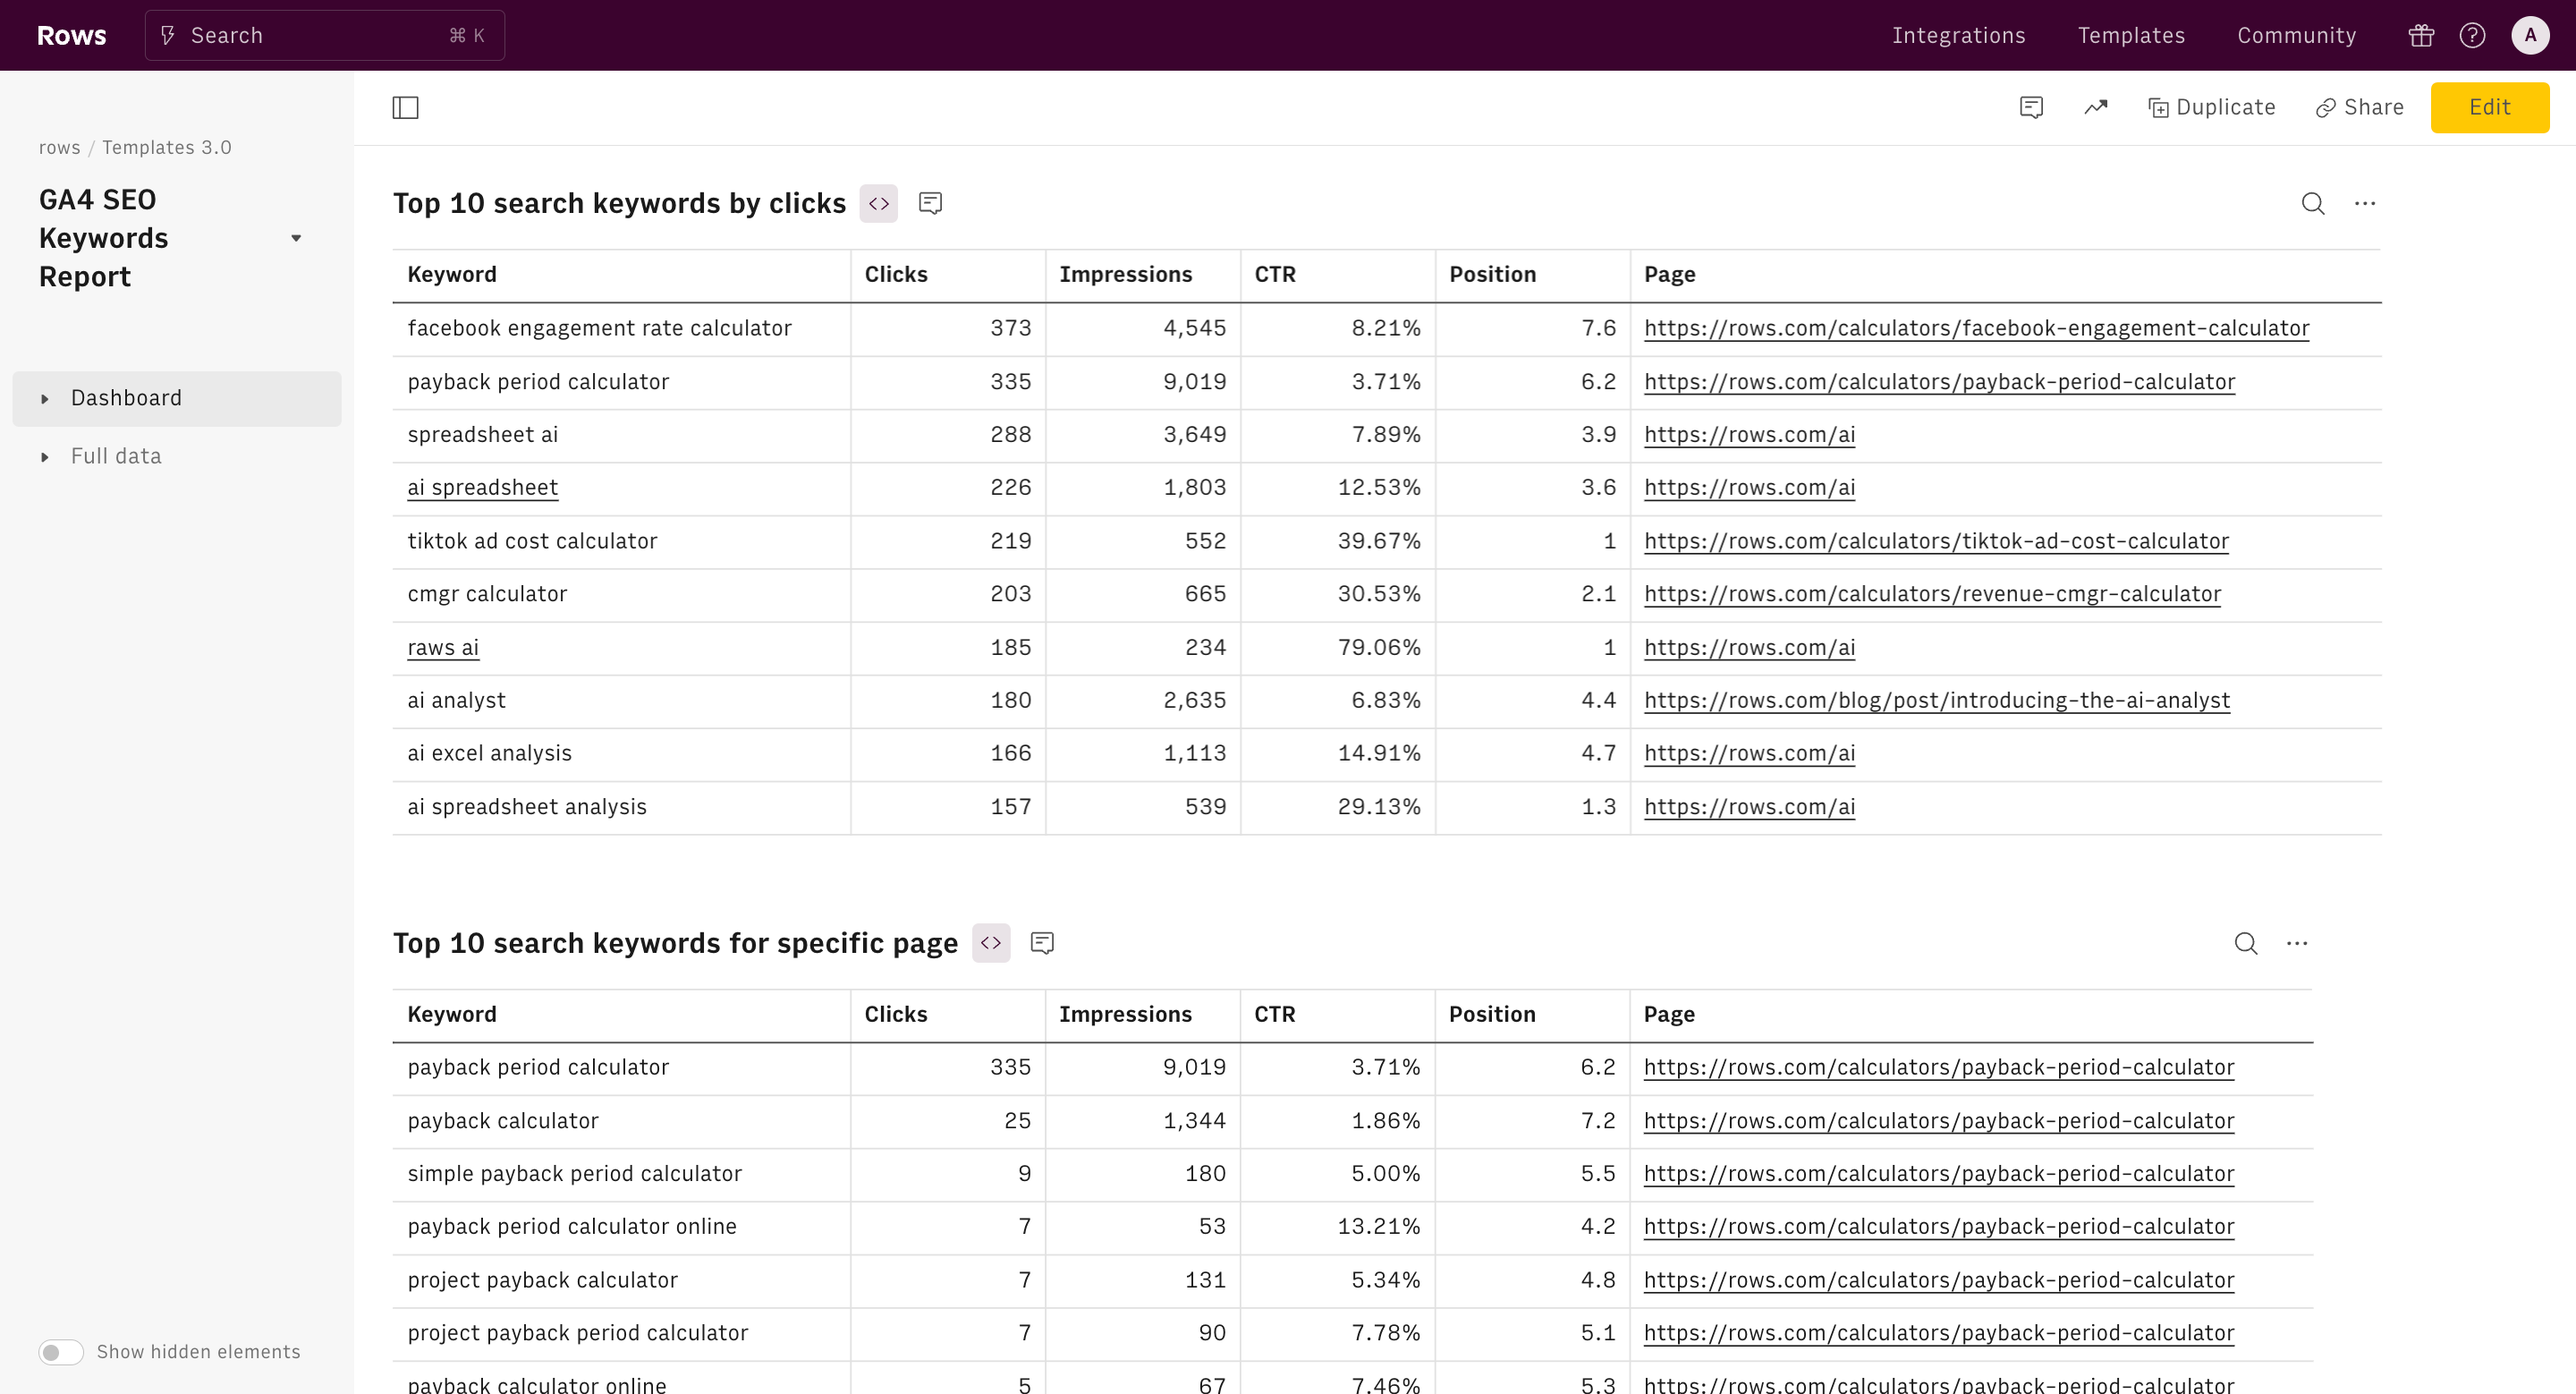
In this Google Analytics 4 template, you can quickly view your site’s top 10 landing pages, along with each page’s unique sessions, page views, bounce rate, engaged sessions rate, average time on page in minutes, and average events per session.
What are the Key Metrics to track in GA4 Landing Page Reports?
Here are 5 Vital metrics to watch out for in a GA4 landing page report:
Sessions
This metric tracks the total number of sessions initiated from a specific landing page. It indicates how effectively a page attracts visitors and serves as a baseline for performance analysis.
Average Engagement Time
This measures the average duration users actively engage with your site during a session. Higher engagement suggests that content resonates well with visitors.
New Users
This shows the number of visitors who interact with your site for the first time via a landing page. It helps gauge the effectiveness of marketing efforts in attracting fresh traffic.
Conversions
This tracks the number of times users complete predefined goals, such as signing up or making a purchase, indicating how well a landing page drives desired actions.
How to create a GA4 Landing Page Report with Rows
Below are a few steps to get started with our GA4 landing page report template:
Step 1: On this page, click on "Use Template".
Once done, you'll see a pop-up that shows — “Select spreadsheet destination” — click on “Create a spreadsheet.”
Step 2: Connect Google Analytics 4 (GA4)integration to Rows.

Without connecting your account, you'll be unable to access insights and analytics about your page.
Once done and connected, you'll get access to the full spreadsheet.
The next step is —
Step 3: Set a date range
Set the date range you wish to analyze — any data you get represents your chosen days.
Key elements of Rows’ GA4 landing page report template
- Top 10 Landing Pages by Sessions: This table is crucial as it provides the following elements:
Sessions: This identifies the most popular entry points on the site.
Page views: It shows how often users view these pages, indicating content popularity.
Bounce rate: It helps you identify pages that need improvement in engaging users.
Events per session: It indicates how interactive or engaging each landing page is.
Engaged sessions: It shows which pages are most effective at keeping users on the site.
Avg session duration: It reveals which pages hold users' attention the longest.
Benefits of this metric table
- It helps you prioritize optimization efforts on high-traffic landing pages.
- It helps you Identify underperforming pages that need content or UX improvements.
- It also helps you understand which types of content or page structures are most engaging.
- Top 10 Page Referrers by Sessions: This table is valuable for understanding traffic sources:
- Sessions: This shows which referrers drive the most traffic.
- Page Views: It indicates how much exploration users from each referrer do.
- Bounce Rate: It helps identify which referral sources bring the most engaged traffic.
- Events Per Ses: It shows which referral sources lead to the most user interactions.
Benefits of this metric table:
- It helps you identify the most valuable referral partners or channels.
- It helps you understand which traffic sources lead to the most engaged users.
- It helps you optimize content and user experience for top referral sources.
How it works


How it works
Get started
Click on 'Use template' and start using it right away. No forms, no signup. Your data first.
Connect your Google Analytics 4 account
Once landed on the spreadsheet, follow the instructions to connect the required integration and pick your account.
Customize the template and schedule refresh
Once the integration has been connected, all tables will update automatically with your own data. Click on 'Edit Source' to change the retrieved data and automate the data refresh. You can then insert a chart or a pivot table, add a column or personalize formats, using all the regular functions and shortcuts that make spreadsheets great.
Embed tables and charts
Click on the option menu to embed tables and chart on your Notion, Confluence or any other iframe-ready documents.


Questions and answers
Can I use Rows for free?
More than a Google Analytics 4 Landing Page Report
Rows is your new AI Data Analyst. It lets you extract from PDFs, import your business data, and analyze it using plain language.
Signup for free

Import your business data
Extract from PDFs and images, import from files, marketing tools, databases, APIs, and other 3rd-party connectors.
Know moreAnalyze it with AI
Ask AI✨ any question about your dataset - from VLOOKUPs to forecasting models - and surface key insights, trends, and patterns.
Know moreCollaborate and Share
Seamlessly collaborate and share stunning reports with dynamic charts, embed options, and easy export features.
Know more