Google Analytics 4 Content Group Report
Quickly create content groups by URL keywords to see how those pages perform with specific user groups and demographics.
 100% spreadsheet
 Connected to your data
 Daily+ refresh
 Embed everywhere
About Google Analytics 4 Content Group Report
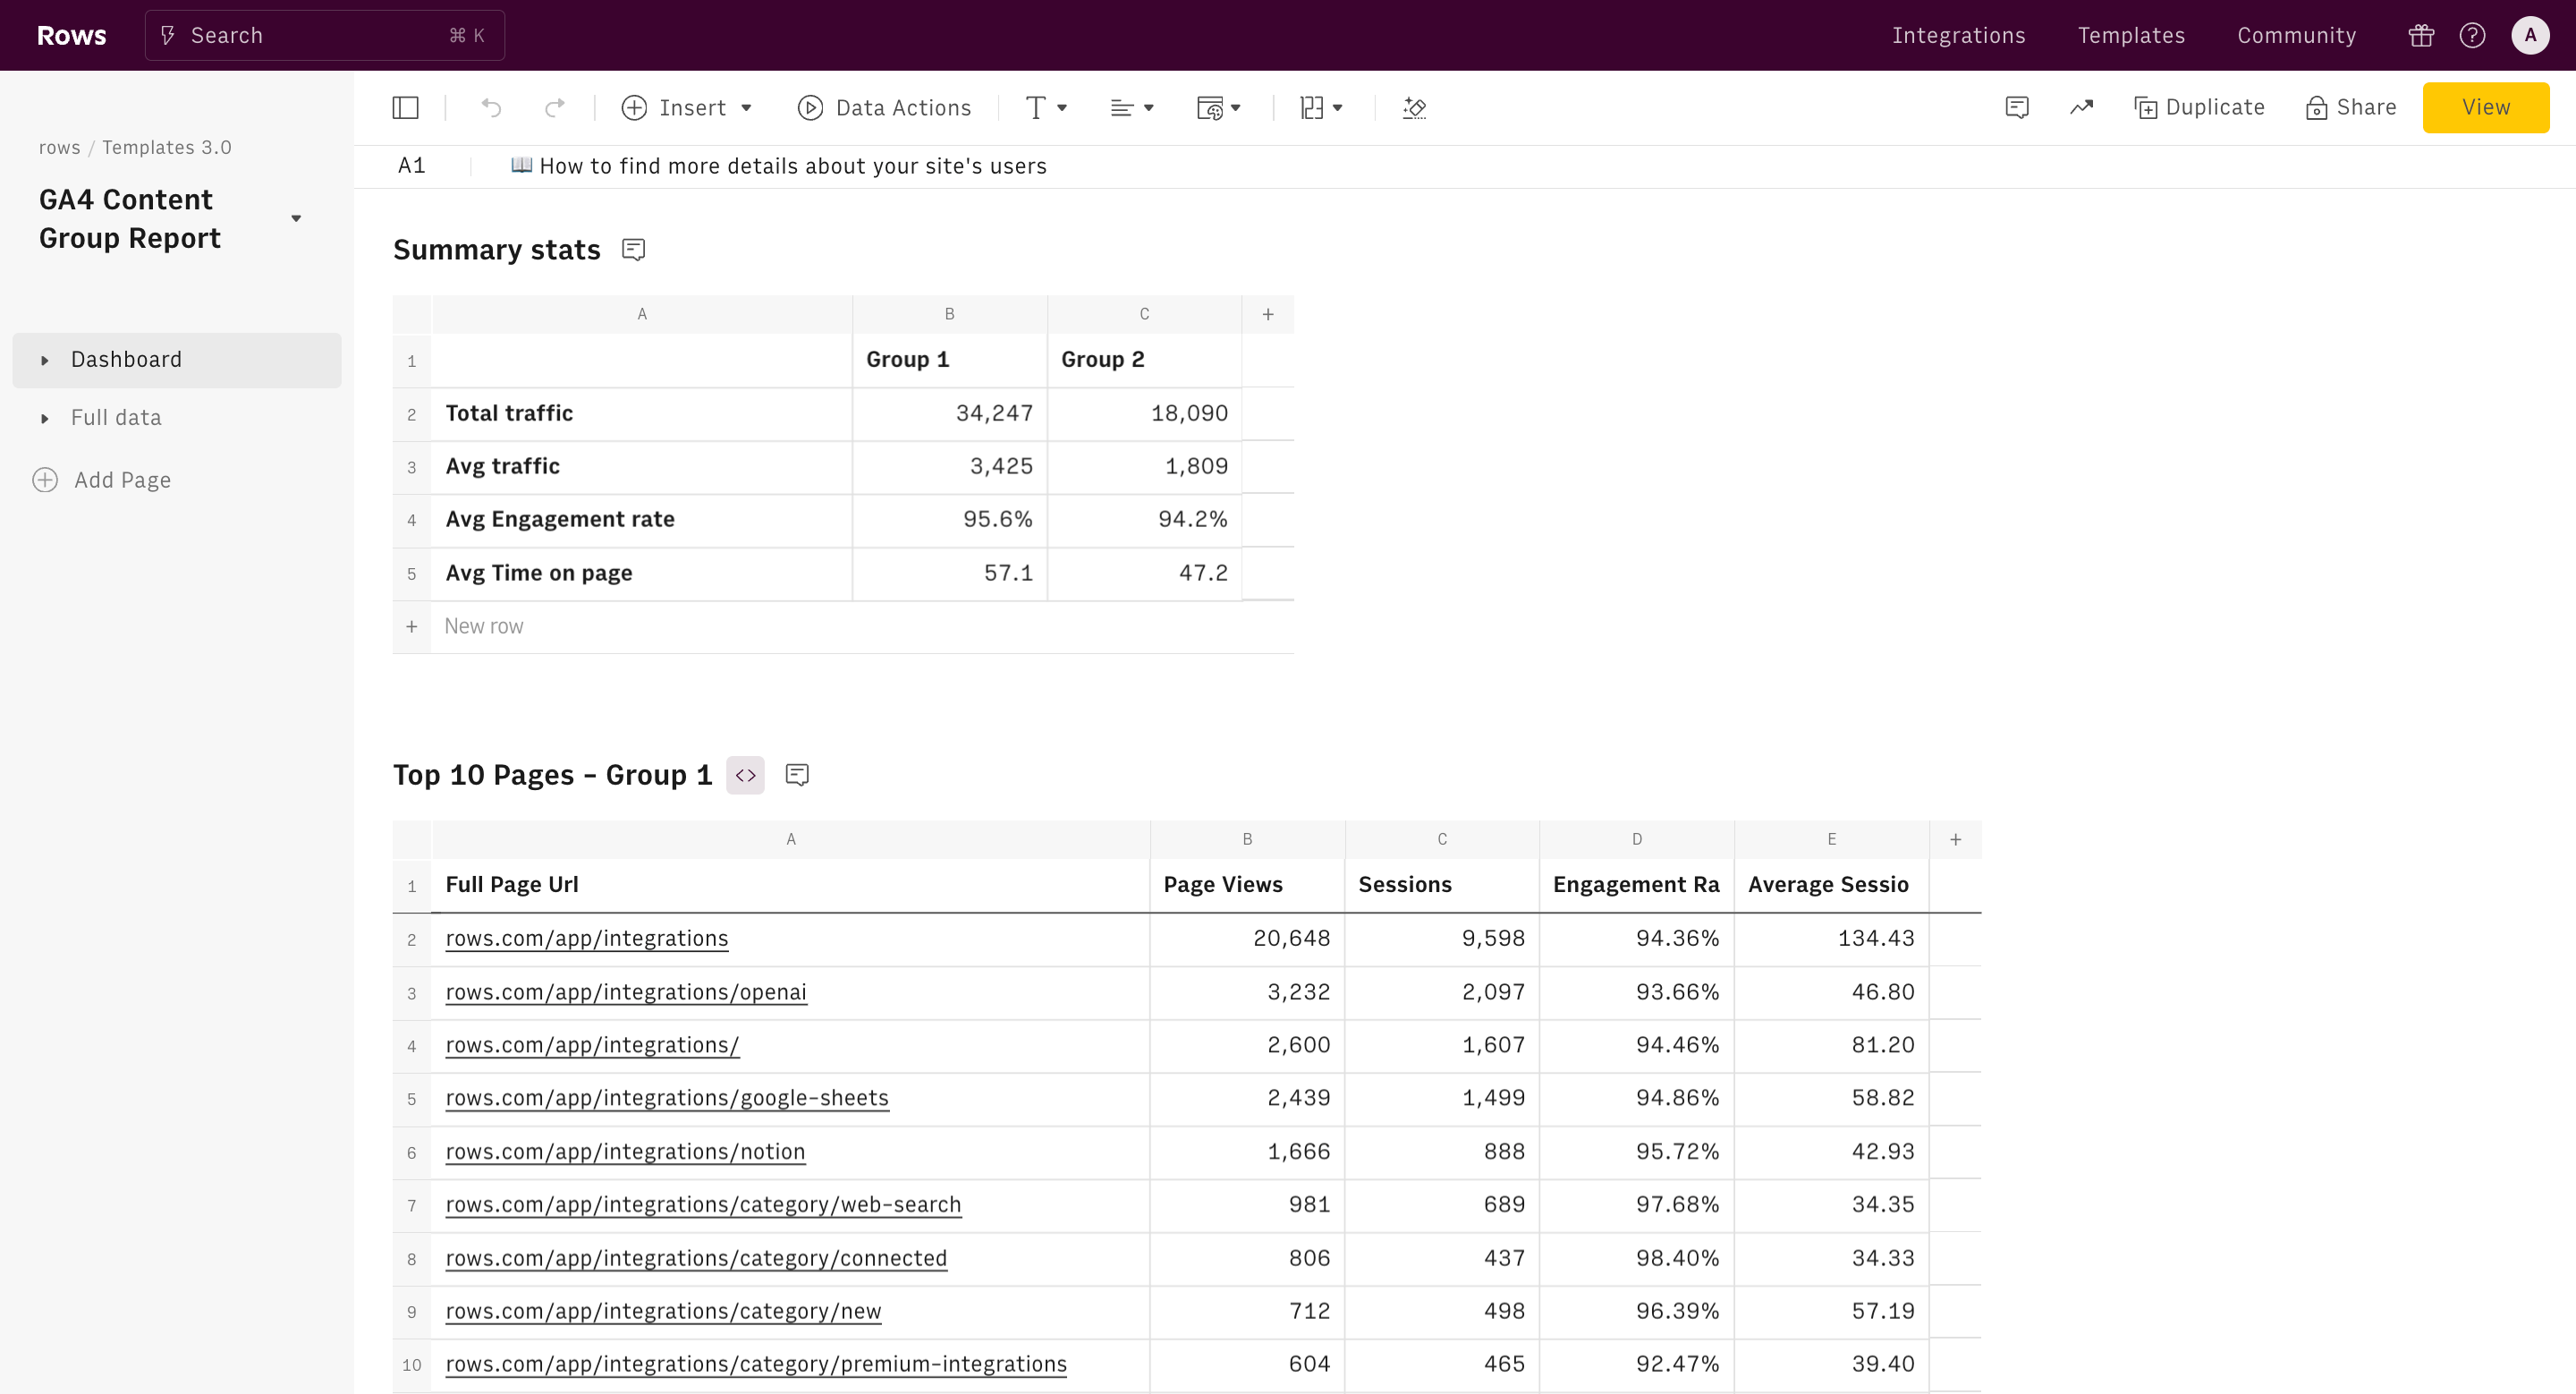
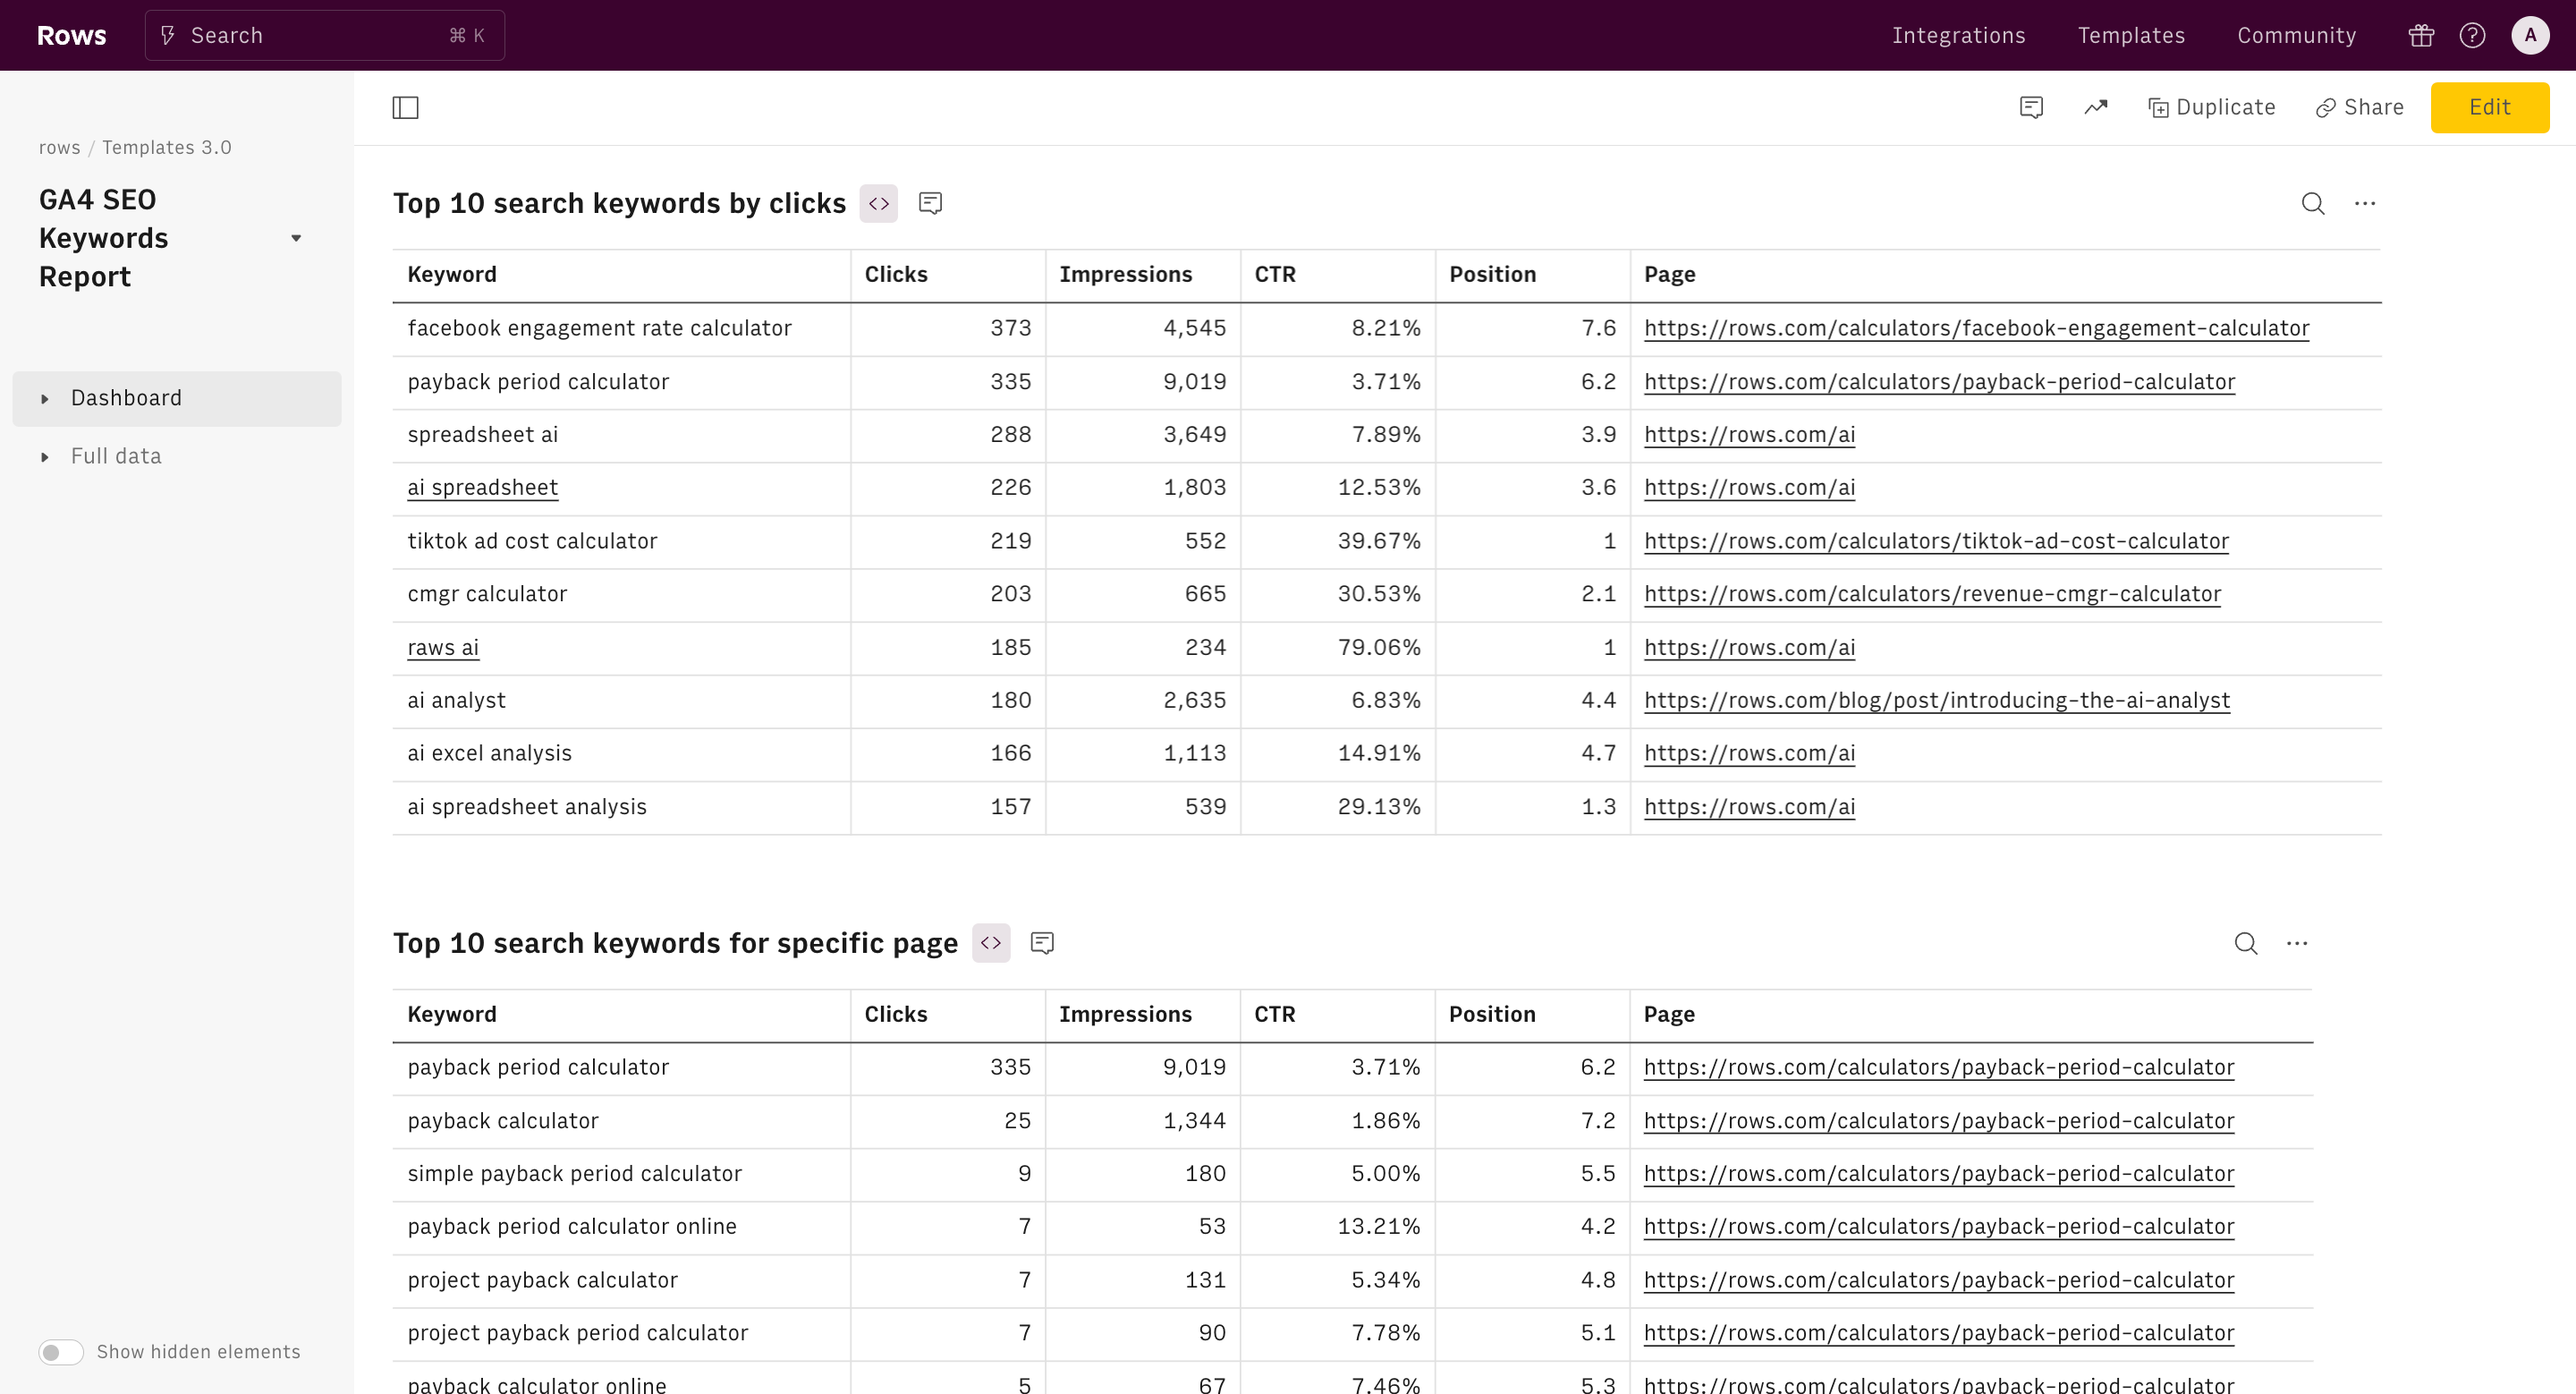
If you want to group and analyze pages on your website, Google Analytics 4 asks you to jump through several hoops. With this template, you can accomplish the same thing in a spreadsheet simply by typing in one or more URL keywords. That will create a content group and summarize the traffic data and user insights over a specified period for all matching URLs.
This template also includes cells for creating a second content bucket, which will automatically be summarized and compared against your first group.
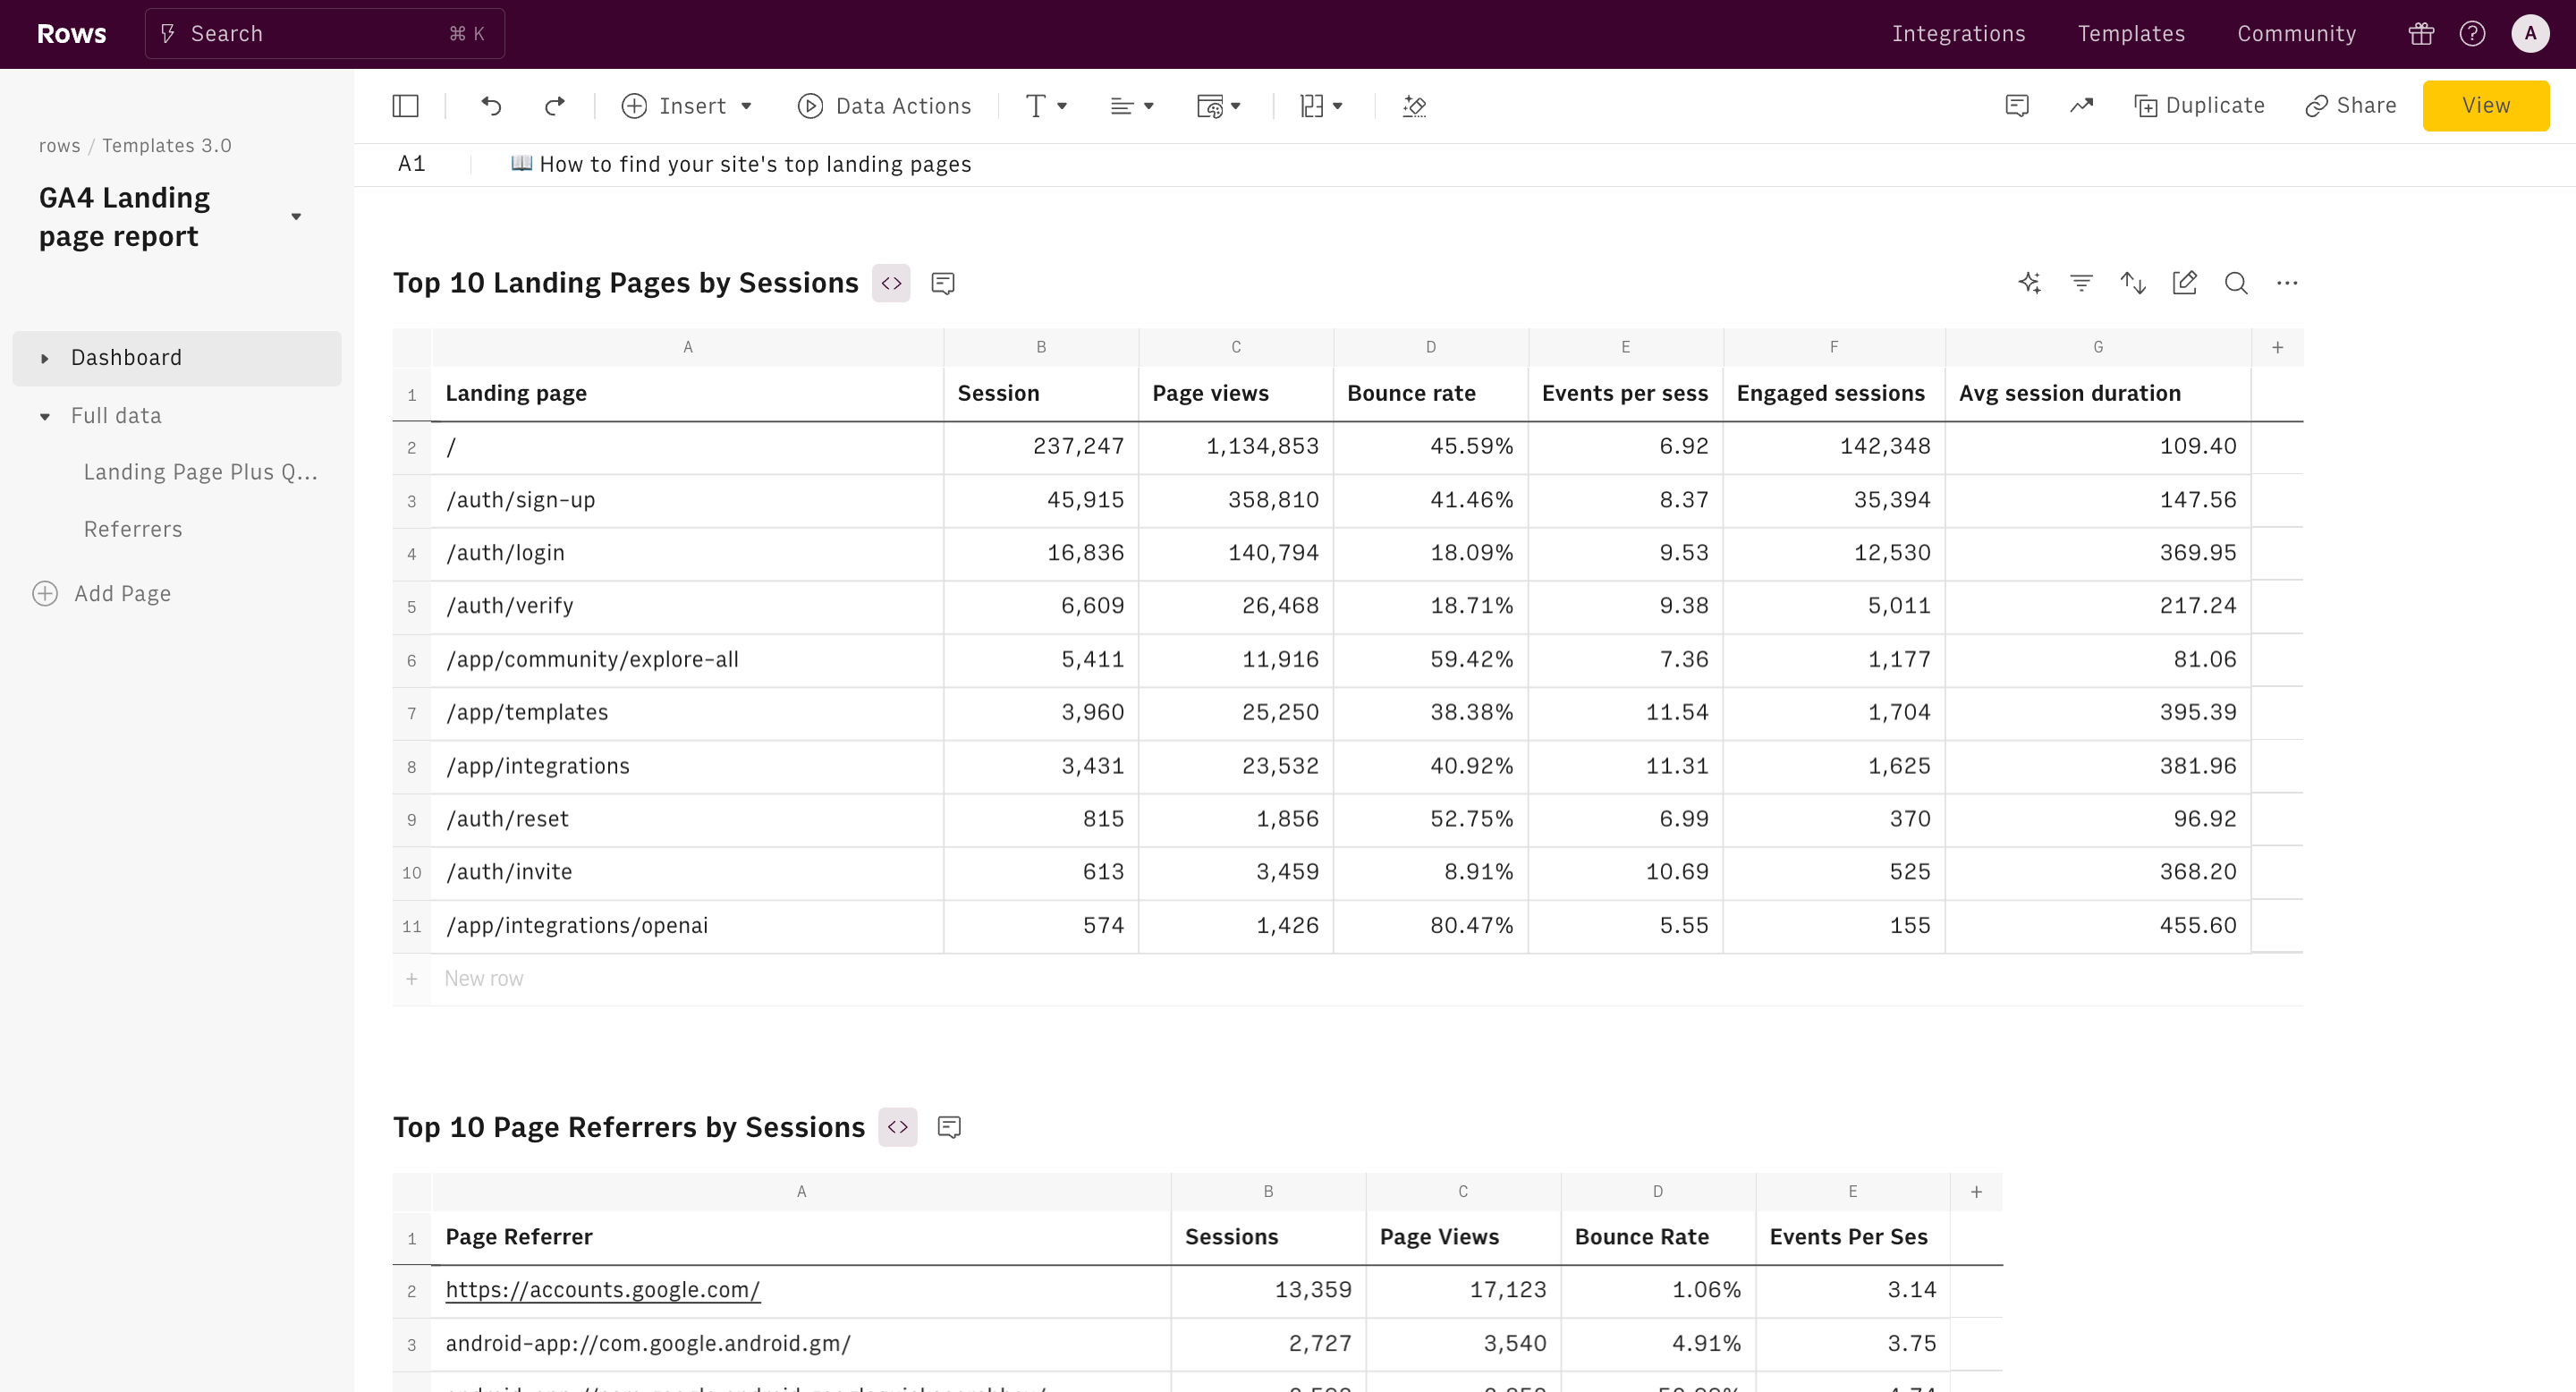
Grouping and tagging Google Analytics 4 data is a quick and easy way to compare pages based on subject or topic, without being limited to certain URL paths or content types. You may want to compare all of your URLs that contain product1 to those that contain product2, regardless of whether the product name appears in a blog URL, product page, or help center article.
How it works


How it works
Get started
Click on 'Use template' and start using it right away. No forms, no signup. Your data first.
Connect your Google Analytics 4 account
Once landed on the spreadsheet, follow the instructions to connect the required integration and pick your account.
Customize the template and schedule refresh
Once the integration has been connected, all tables will update automatically with your own data. Click on 'Edit Source' to change the retrieved data and automate the data refresh. You can then insert a chart or a pivot table, add a column or personalize formats, using all the regular functions and shortcuts that make spreadsheets great.
Embed tables and charts
Click on the option menu to embed tables and chart on your Notion, Confluence or any other iframe-ready documents.


Questions and answers
Can I use Rows for free?
More than a Google Analytics 4 Content Group Report
Rows is your new AI Data Analyst. It lets you extract from PDFs, import your business data, and analyze it using plain language.
Signup for free

Import your business data
Extract from PDFs and images, import from files, marketing tools, databases, APIs, and other 3rd-party connectors.
Know moreAnalyze it with AI
Ask AI✨ any question about your dataset - from VLOOKUPs to forecasting models - and surface key insights, trends, and patterns.
Know moreCollaborate and Share
Seamlessly collaborate and share stunning reports with dynamic charts, embed options, and easy export features.
Know more