What is Exit Rate
Exit rate is a web analytics metric that measures the percentage of visits that end on a specific page. It's calculated by dividing the number of exits from a page by the total number of pageviews for that page. This metric is crucial for understanding user behavior and identifying which pages are the last ones viewed before users leave your website.
Unlike bounce rate, which only considers single-page sessions, exit rate takes into account all sessions that end on a particular page, regardless of how many pages were viewed beforehand.
Let's better illustrate the difference.
Bounce Rate: A user visits your homepage via organic search and leaves without interacting with any other pages. This is counted as a bounce.
Exit Rate: A user enters your site through a blog post, navigates to the 'About Us' page, then visits the 'Contact Us' page where they fill out a form before leaving. The 'Contact Us' page would have an exit for this session, contributing to its exit rate.
Let's now consider a practical example:
Imagine a user journey on an e-commerce site:
- User enters through the homepage
- Navigates to a product category page
- Views a specific product page
- Adds the product to cart
- Proceeds to checkout
- Completes the purchase and exits from the order confirmation page
In this scenario, the order confirmation page would have an exit recorded, contributing to its exit rate. This is not a negative outcome, as the user completed the desired action before leaving. However, if many users were exiting from the product page or cart page, it might indicate issues in the purchase funnel that need addressing.
How Exit Rate is computed
Exit rate is computed as follow:
- Identify the total number of pageviews for a specific page.
- Count the number of times that page was the last one viewed in a session.
- Divide the number of exits by the total pageviews and multiply by 100.
Formula: Exit Rate = (Number of Exits / Total Pageviews) * 100
For example, if a page has 1000 pageviews and 300 exits, its exit rate would be: (300 / 1000) * 100 = 30%
Most analytics tools, including Google Analytics 4 (GA4), automatically calculate this metric for you.
Why to use Exit Rate
Exit rate is valuable for several reasons:
Identifying problem areas: High exit rates on important pages can indicate issues with content, design, or user experience.
Optimizing user flow: By understanding where users tend to leave, you can improve navigation and content to guide them towards desired actions.
Evaluating content effectiveness: For informational pages, a high exit rate might be positive, indicating users found what they needed.
Improving conversion paths: Low exit rates on pages leading to conversions can suggest an effective funnel.
Comparing page performance: Exit rates help you compare how different pages retain user interest.
How to track Exit Rate using GA4 native console
In GA4, you can analyze exit rate as follows:
- Log into your GA4 account.
- Navigate to the Explore tab and select the Free From template.

- Add the Exit metric and landing page dimension.

This allows you to identify pages with unusually high or low exit rates for further investigation.
How to connect Rows with Google Analytics
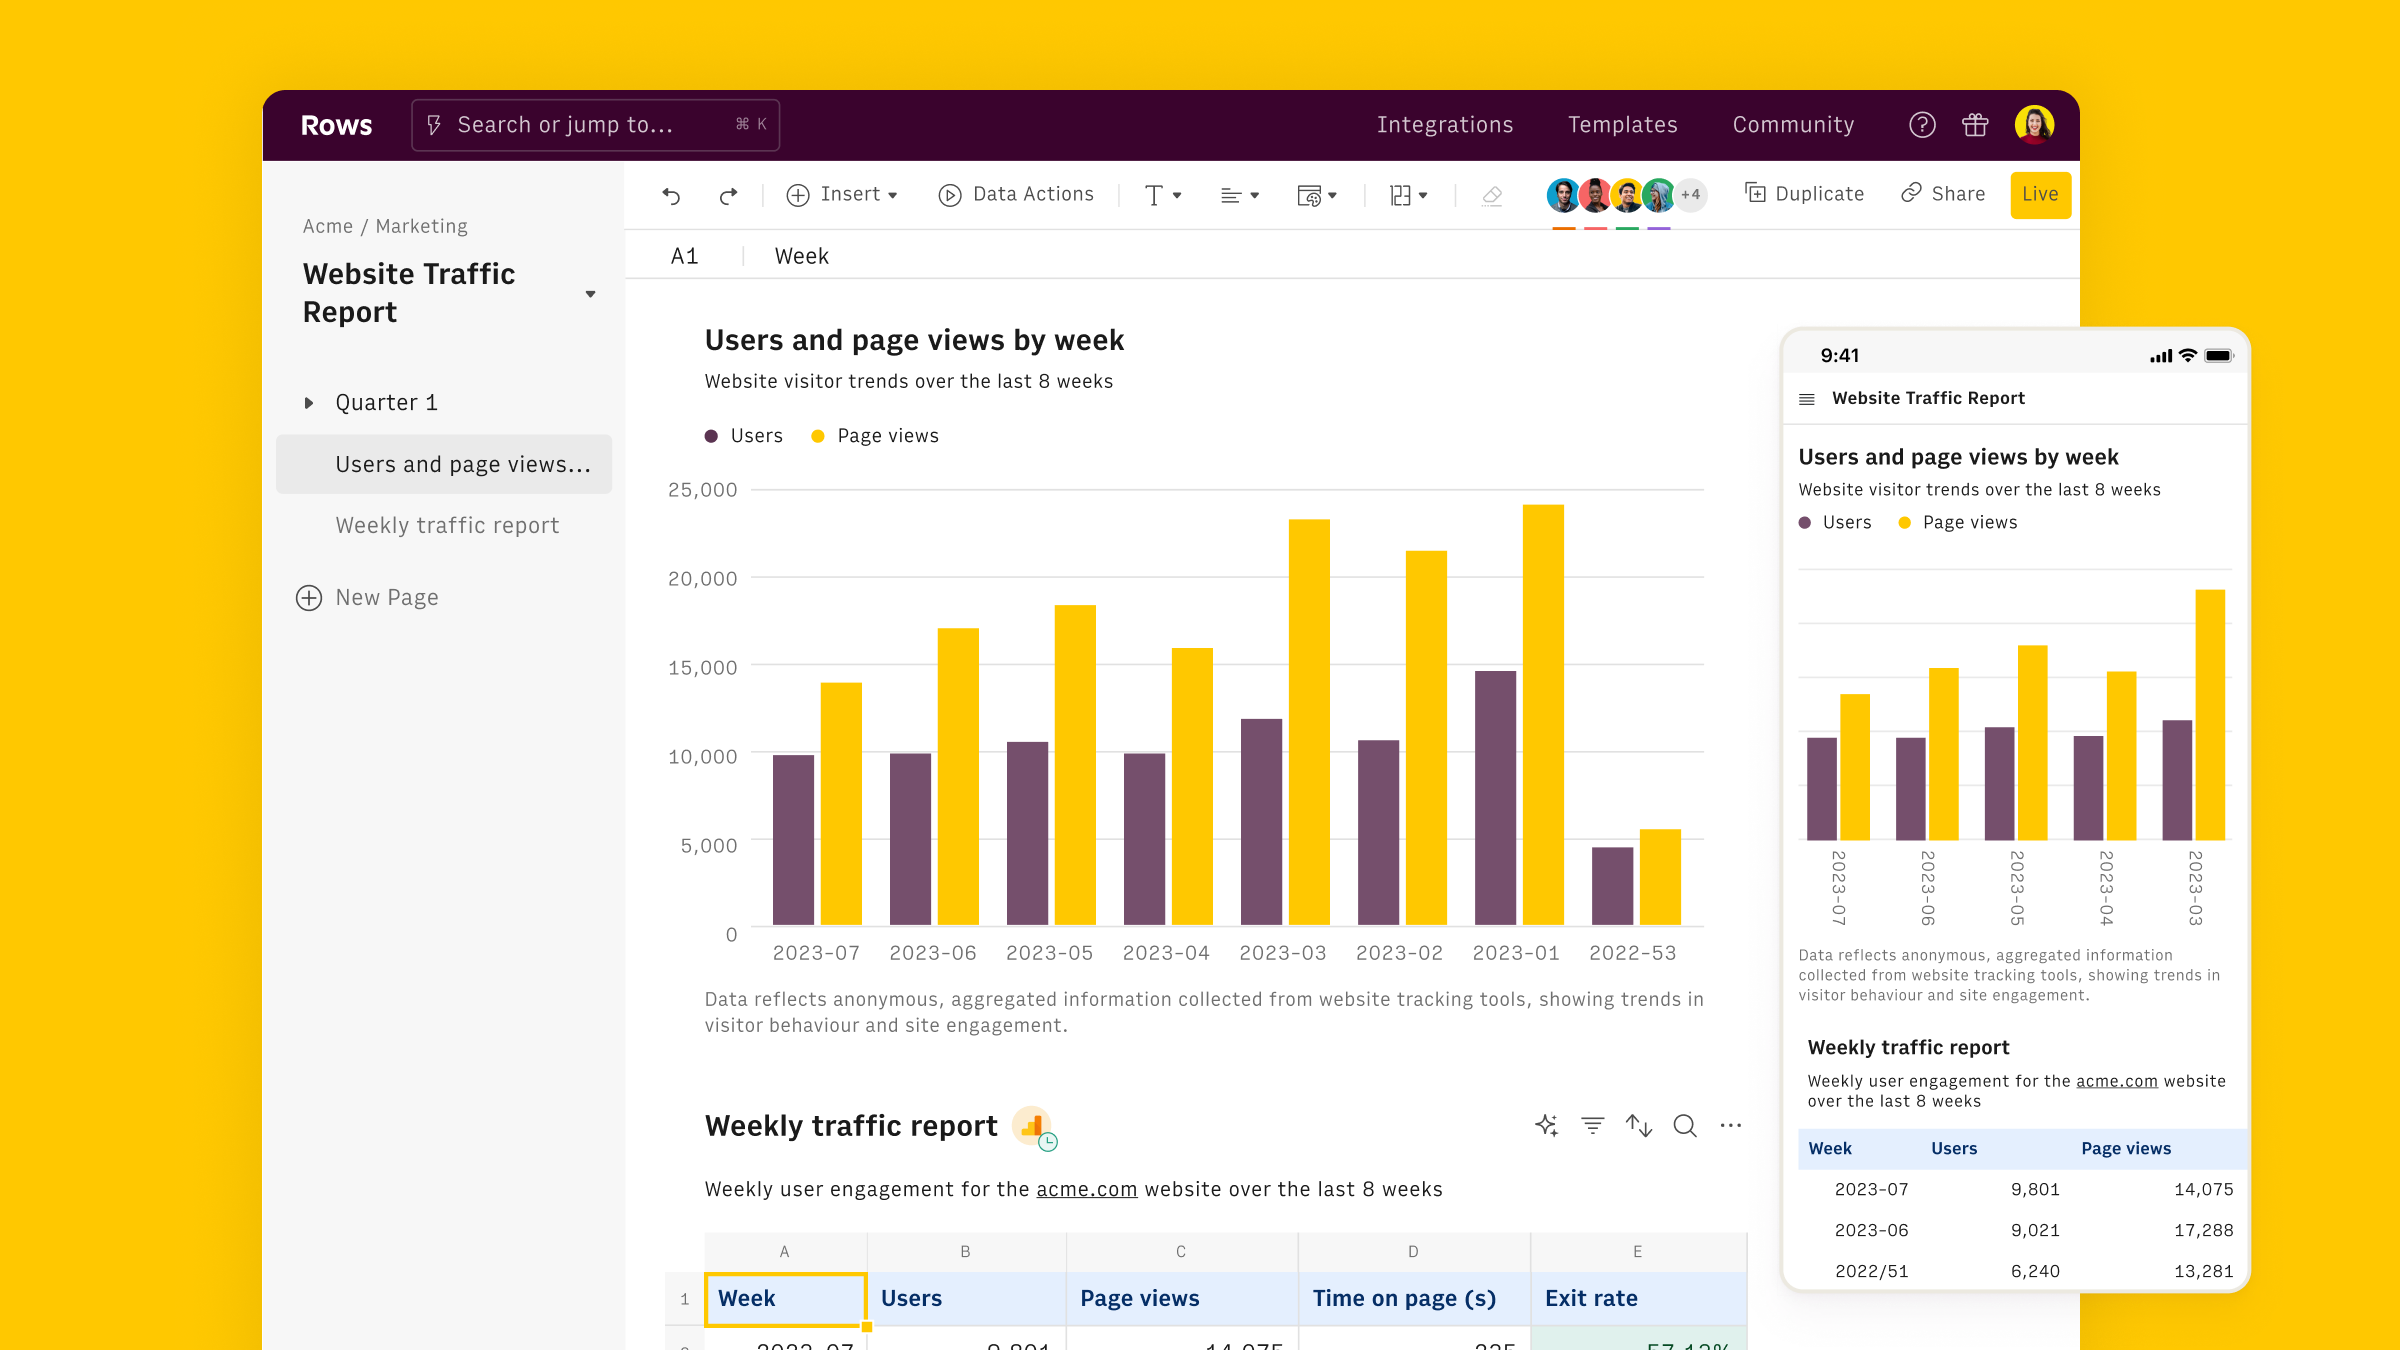
As just seen, Exit Rate can be analyzed with Google Analytics 4 native reports, but Rows offers a more flexible and user-friendly approach, that leverage the familiarity of spreadsheets.
Rows is easiest way to access, transform and share your business data. It works 100% as a spreadsheet, but lets you bring live data from 50+ sources, including Exit Rate, directly into your spreadsheet, thanks to built-in API integration.
This makes it extra easy to track how users interact with your website.
To get started:
- Open a new spreadsheet in Rows
Use the Data Action menu to find Google Analytics 4 under the Import Data section
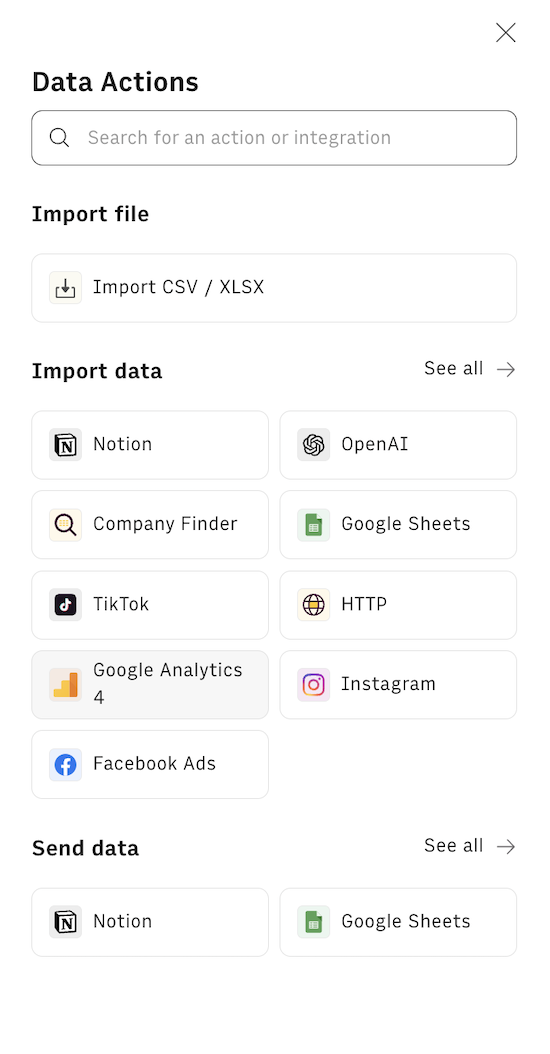
Connect your GA4 account by following the instructions - the typical oAuth procedure
Select one of the recommended templates or build a custom one

To get a head start, Rows offers templates specifically designed for marketing analytics, such as
- Google Analytics 4 User Report
- Google Analytics 4 Retention Report
- Google Analytics 4 Traffic Acquisition Report
- Google Analytics 4 User Acquisition Report
- Google Analytics 4 Journey Report
- Google Analytics 4 Demographics Report
- Website Analytics Dashboard
- Google Analytics 4 Event Conversions Report
- Google Analytics 4 Content Group Report
By combining these integrations and templates, you can create a powerful system for tracking and optimizing your exit rates across all your website pages. This data can inform decisions about content improvements, user experience enhancements, and overall site structure optimizations to guide users more effectively through your desired conversion paths.