How to Create SEO Reports for Clients [2025]

An SEO report answers the question “why” and “what” — What ROI did we get investing in this SEO Playbook? What metrics are outperforming the other? What can we do to improve rankings? Why is this working? And why is this strategy not working?
These questions and many more are what your clients ask all the time.
Other times, they scream like this:

Telling them what you did and the tools you used to get data isn't enough — you have to show them the outcomes of all SEO efforts within a time frame.
The challenge with reporting is that the data doesn’t always speak for itself. You have to back up your efforts with results and sometimes make a case for why you executed the tactic—all that, takes words on paper, visuals on dashboards, and insights on notes.
And to do so you need extra flexibility in manipulating your data and visualizing your reports in an appealing way — that's where Rows comes in — a spreadsheet software providing valuable dashboard report templates.
In this comprehensive guide, you'll learn how to create well-defined and organized SEO reports for your clients. In addition, you'll get a free template.

A modern, flexible report to monitor your SEO efforts
Rows lets you sync your SEO data, manipulate and visualize it with the ease of a spreadsheet.
Try it now (it's free)What Are SEO Reports for Clients, and Why Are They Important?
SEO reports are more than just data dumps — they're strategic narratives that translate complex technical information into actionable insights for clients.
They help bridge the gap between SEO efforts and business outcomes. It reveals the performance and results of your SEO efforts and relates them to your client's business goals. Some other benefits includes:
1. It helps measure the Impact of Your Efforts
SEO reports provide concrete evidence of ROI, showcasing how your strategies translate into higher rankings, increased traffic, and improved online visibility.
2. It helps you gain a holistic view of performance
SEO reports offer a comprehensive overview of your website's health, encompassing keyword rankings and backlink profiles to technical SEO issues and user experience metrics.
3. It helps you identify areas for improvement
Reports pinpoint weaknesses and opportunities, allowing you to refine your strategies and optimize for better results. They transform guesswork into data-driven decision-making.
4. It helps you track progress and trends
SEO is a marathon, not a sprint. Reports track your progress over time, revealing long-term trends and highlighting the effectiveness of your efforts.
5. It helps you communicate effectively with clients
Whether you're reporting to your team, boss, or clients, SEO reports clearly and concisely communicate performance, challenges, and future plans.
How to create an SEO report using Rows’ SEO Report Template
Rows is spreadsheet software with tens of templates, from marketing templates to SEO templates and templates for time-consuming daily business tasks.
We understand that pulling data from all your different SEO channels can be a time suck — especially when you have to pull data from each platform individually.
Your template needs to integrate with your preferred SEO data source to perform true SEO reporting.
With Rows, you can pull live data from GA4 and GSC without coding or engineering — and with fast data load time.
As you'll read in the next few paragraphs, all our templates have integrations with various data sources.
Below are some of our SEO report templates — with short descriptions of how to use them, the key metrics they measure, and why we created them.
Rows SEO report template
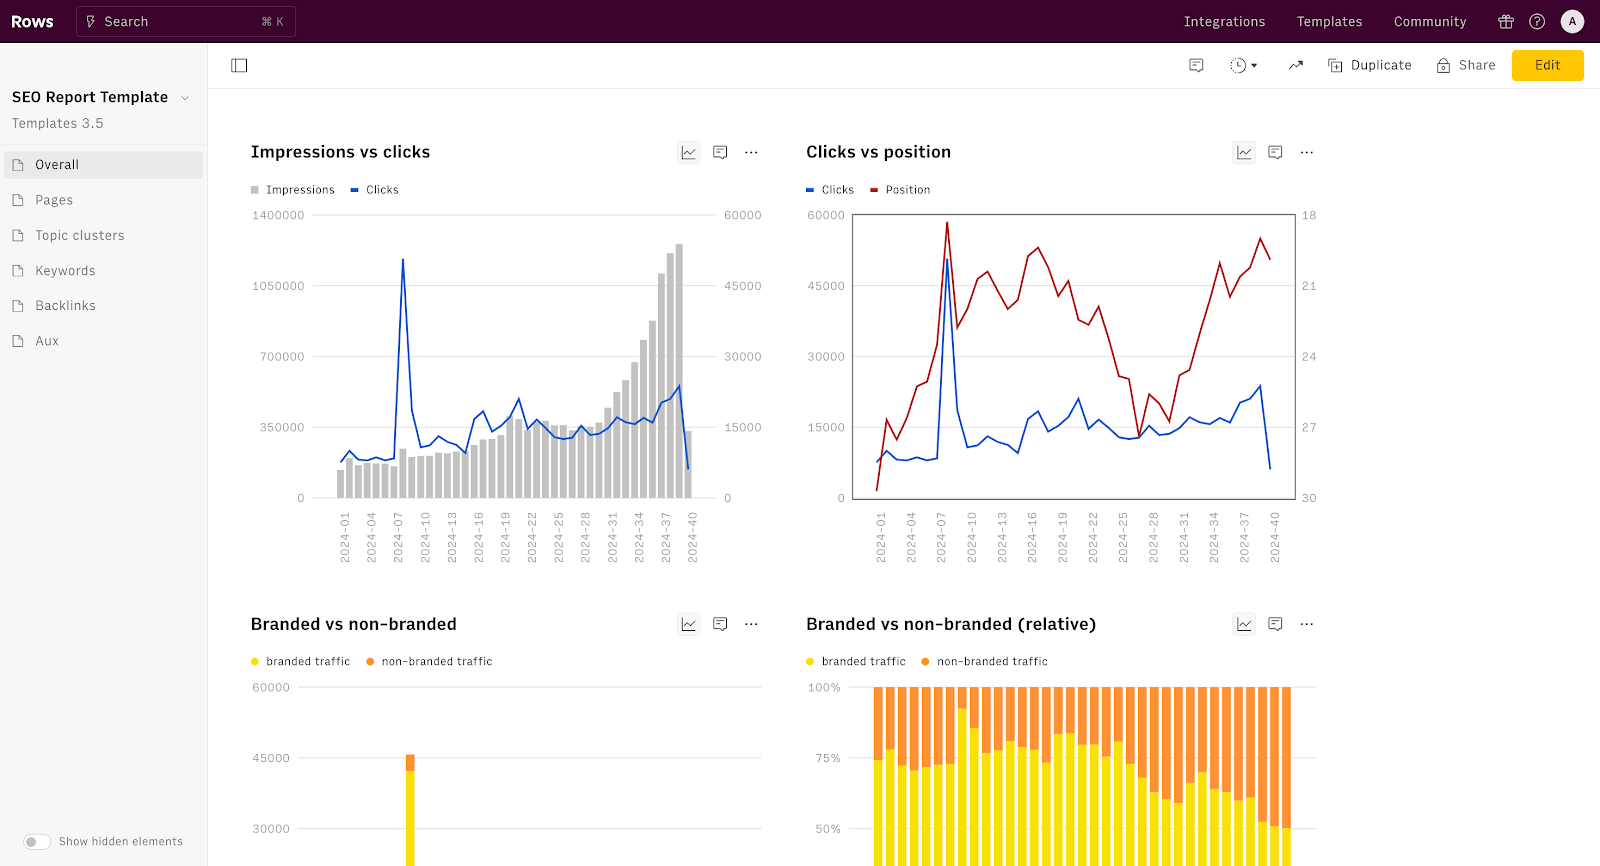
Our SEO Report template is a dashboard that consolidates all essential SEO metrics in one flexible and easy-to-manage spreadsheet interface. It is directly connected to your Google Analytics 4 and Google Search Console accounts and provides automated, real-time insights into your website's search performance, traffic patterns, content effectiveness, and backlink profile.
Step-by-step instructions on how to use our SEO report template
Step 1: Visit the SEO report template page and Click “use template.”
Step 2: Once you've completed this, click “create a spreadsheet.” You'll then be taken to the dashboard page.
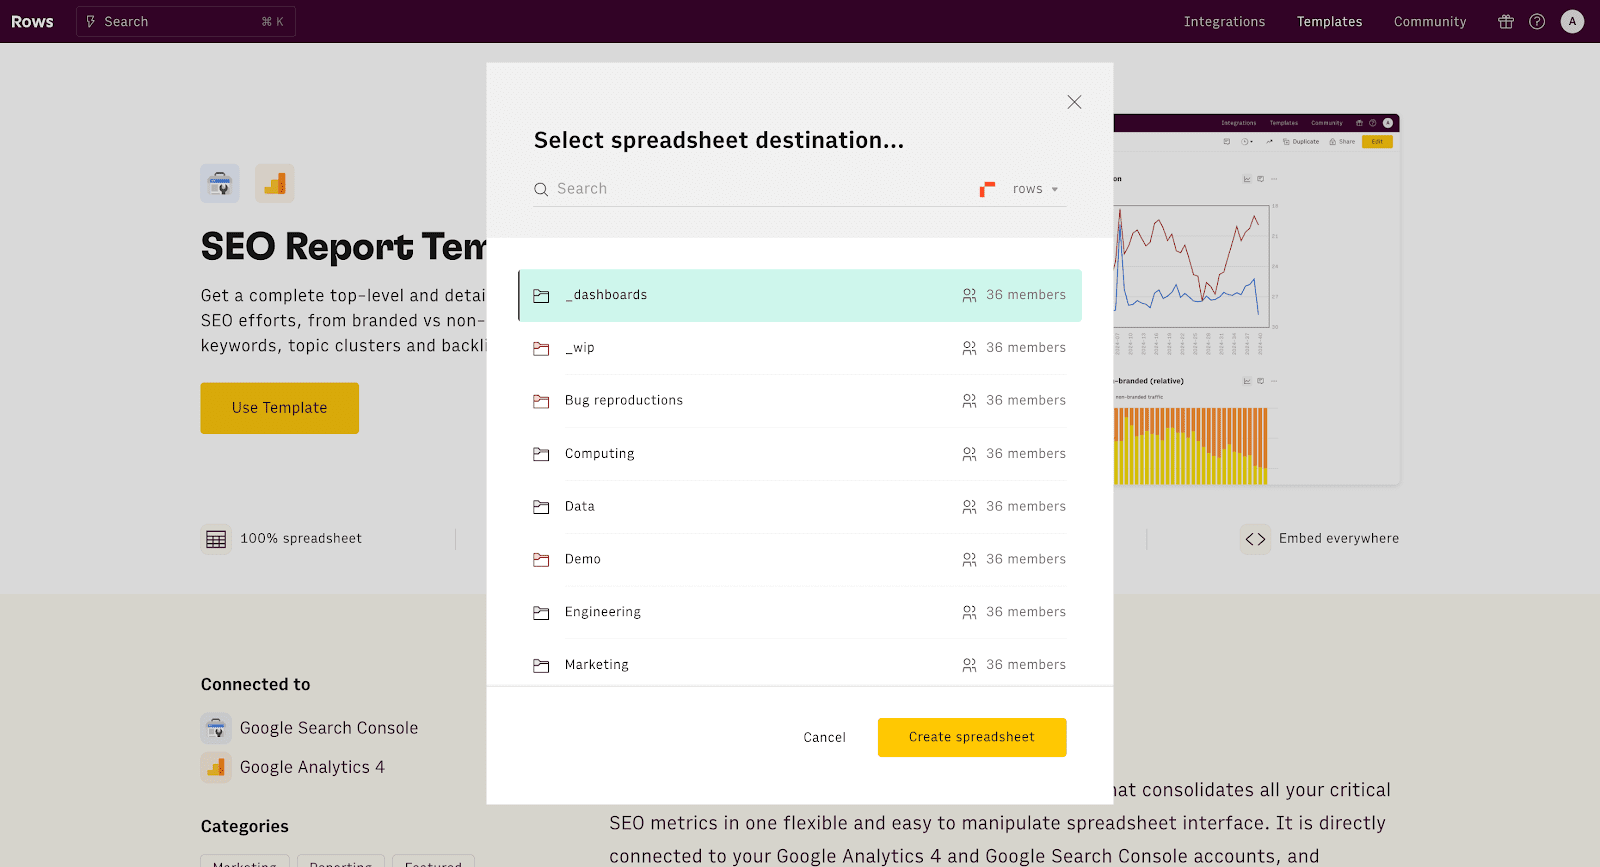
Step 3: You'll get a pop-up for configuration. You'll be asked to connect your GSC and GA4 account to Rows account. Without doing this, you'll be unable to pull out live data.
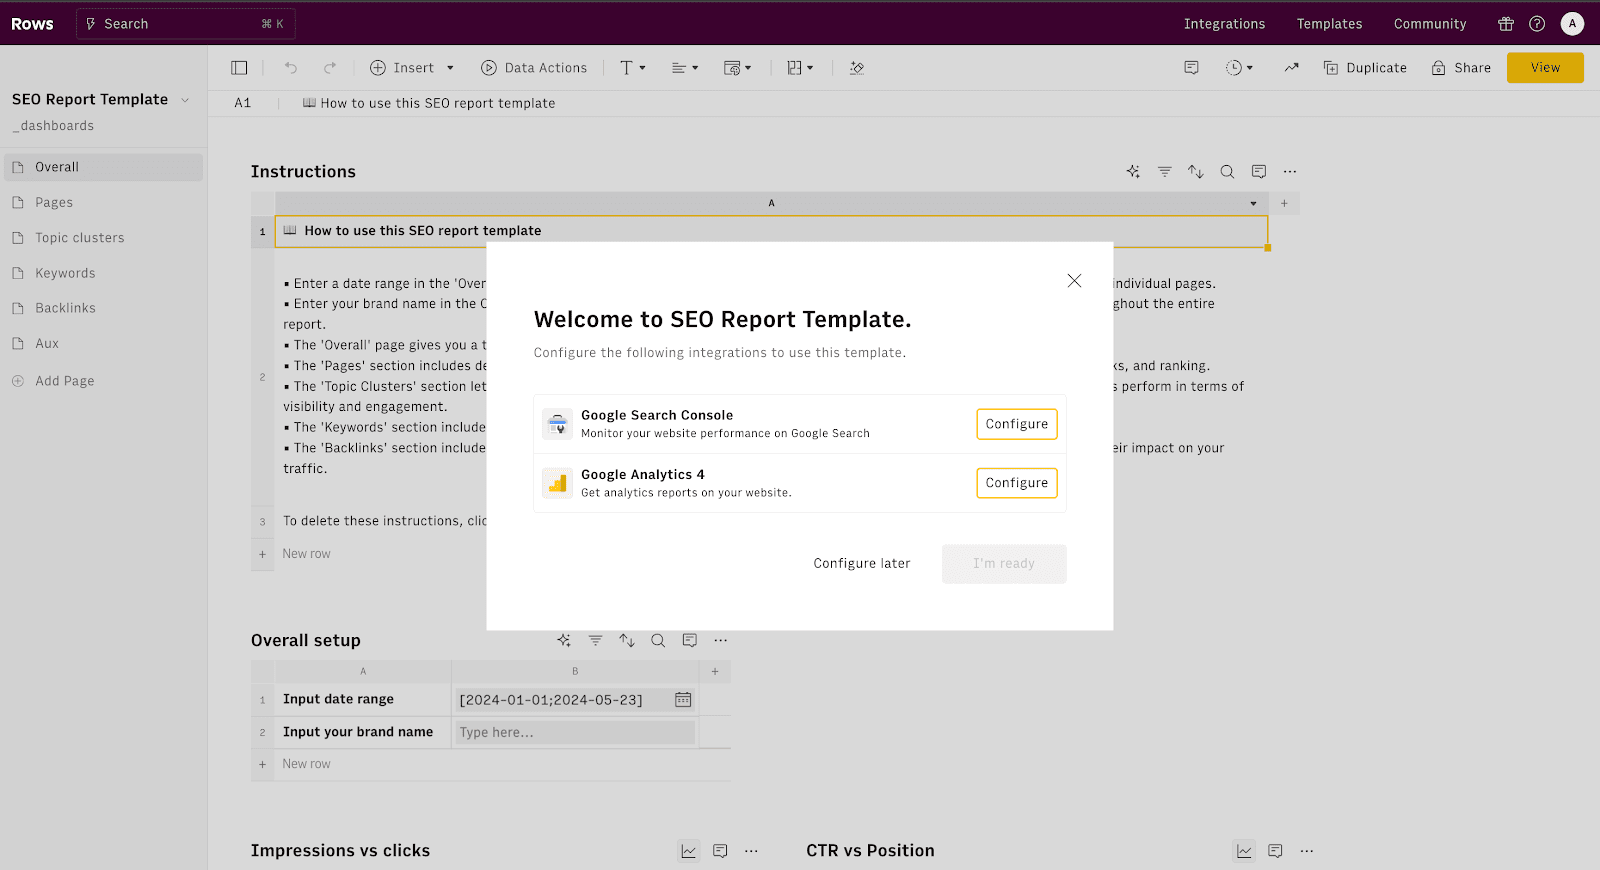
Step 4: Once you have confirmed integration, it's time to get to work. The next step is to enter a date range in the 'Overall' setup table. The date range will apply to the entire report, but you can overwrite it on individual pages.
Step 5: Enter your brand name in the Overall setup table. This will allow you to distinguish between branded and non-branded traffic throughout the report.
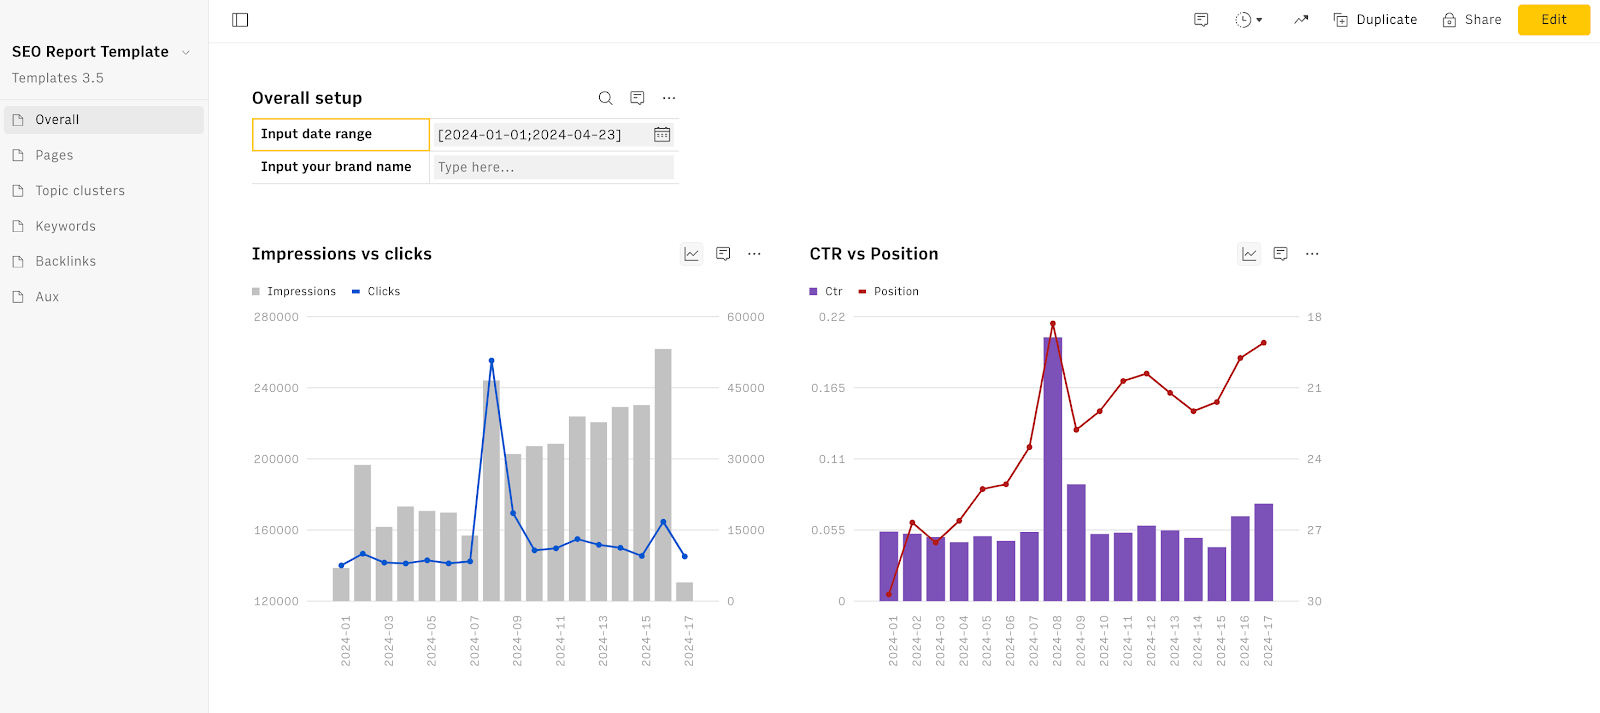
Look on the left side of your dashboard, and you'll see a pop-up of spreadsheets with different titles.
The “Overall” page gives you a top-level view of your traffic metrics, such as clicks, impressions, and position.
The “Pages” section includes detailed insights into the performance of individual pages, highlighting their traffic, impressions, clicks, and ranking.
The “Topic Clusters” section lets you organize your website into four different content clusters, showing how well your grouped topics perform in terms of visibility and engagement.
The “Keywords” section includes an analysis of your keywords
The “Backlinks” section includes a review of your backlink profile, showing the number of referring domains, total backlinks, new backlinks per month and their impact on your traffic.
How to customize Rows SEO report template
You can edit our SEO report template to fit your client's taste.
First of all you can resize your chart (pixel-perfectly) by just dragging the small arrow icon in the bottom right corner. Then, click on any of the three dotted lines on each table or chart to kick off customization.
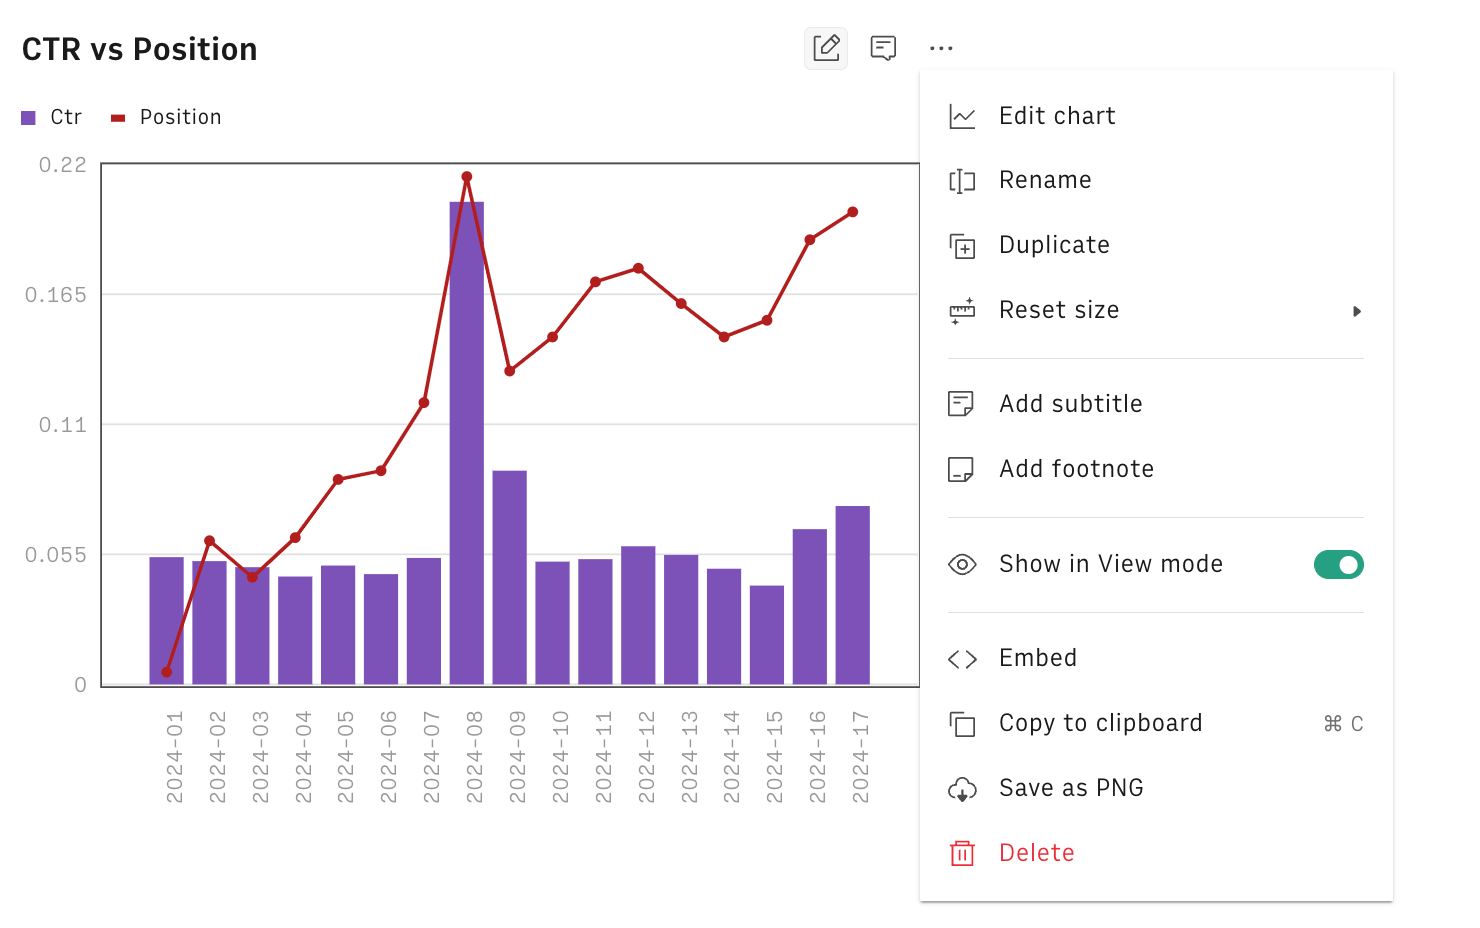
You'll see an array of options—you can edit the chart, rename it to fit any metric, and reset its size. But there's more: explore the Edit chart menu to:
- choose from 8 different chart types. - add you brand colors - you can add subtitle and footnote, to give better context to the reader - you can highlight some data point with different color and add a custom annotation, to make your narrative more effective
When it comes to tables, click on the Source icon (e.g. Google Search Console) to:

Customize metrics and dimensions: change the metrics retrieved from the data source (e.g. Google Search Console), or the dimension used to break down data (e.g. Page, or Date)
Set up automation: Schedule automatic data updates every hour, day, week, ... for seamless recurring reporting.
Apply permanent Sort and Filter: define criteria to filter or sort your data, then click Apply. Use the Limit feature to display only the first X results in your table—perfect for focused reporting
To add a column to the table, go to the + icon to the right border of the table and click on:
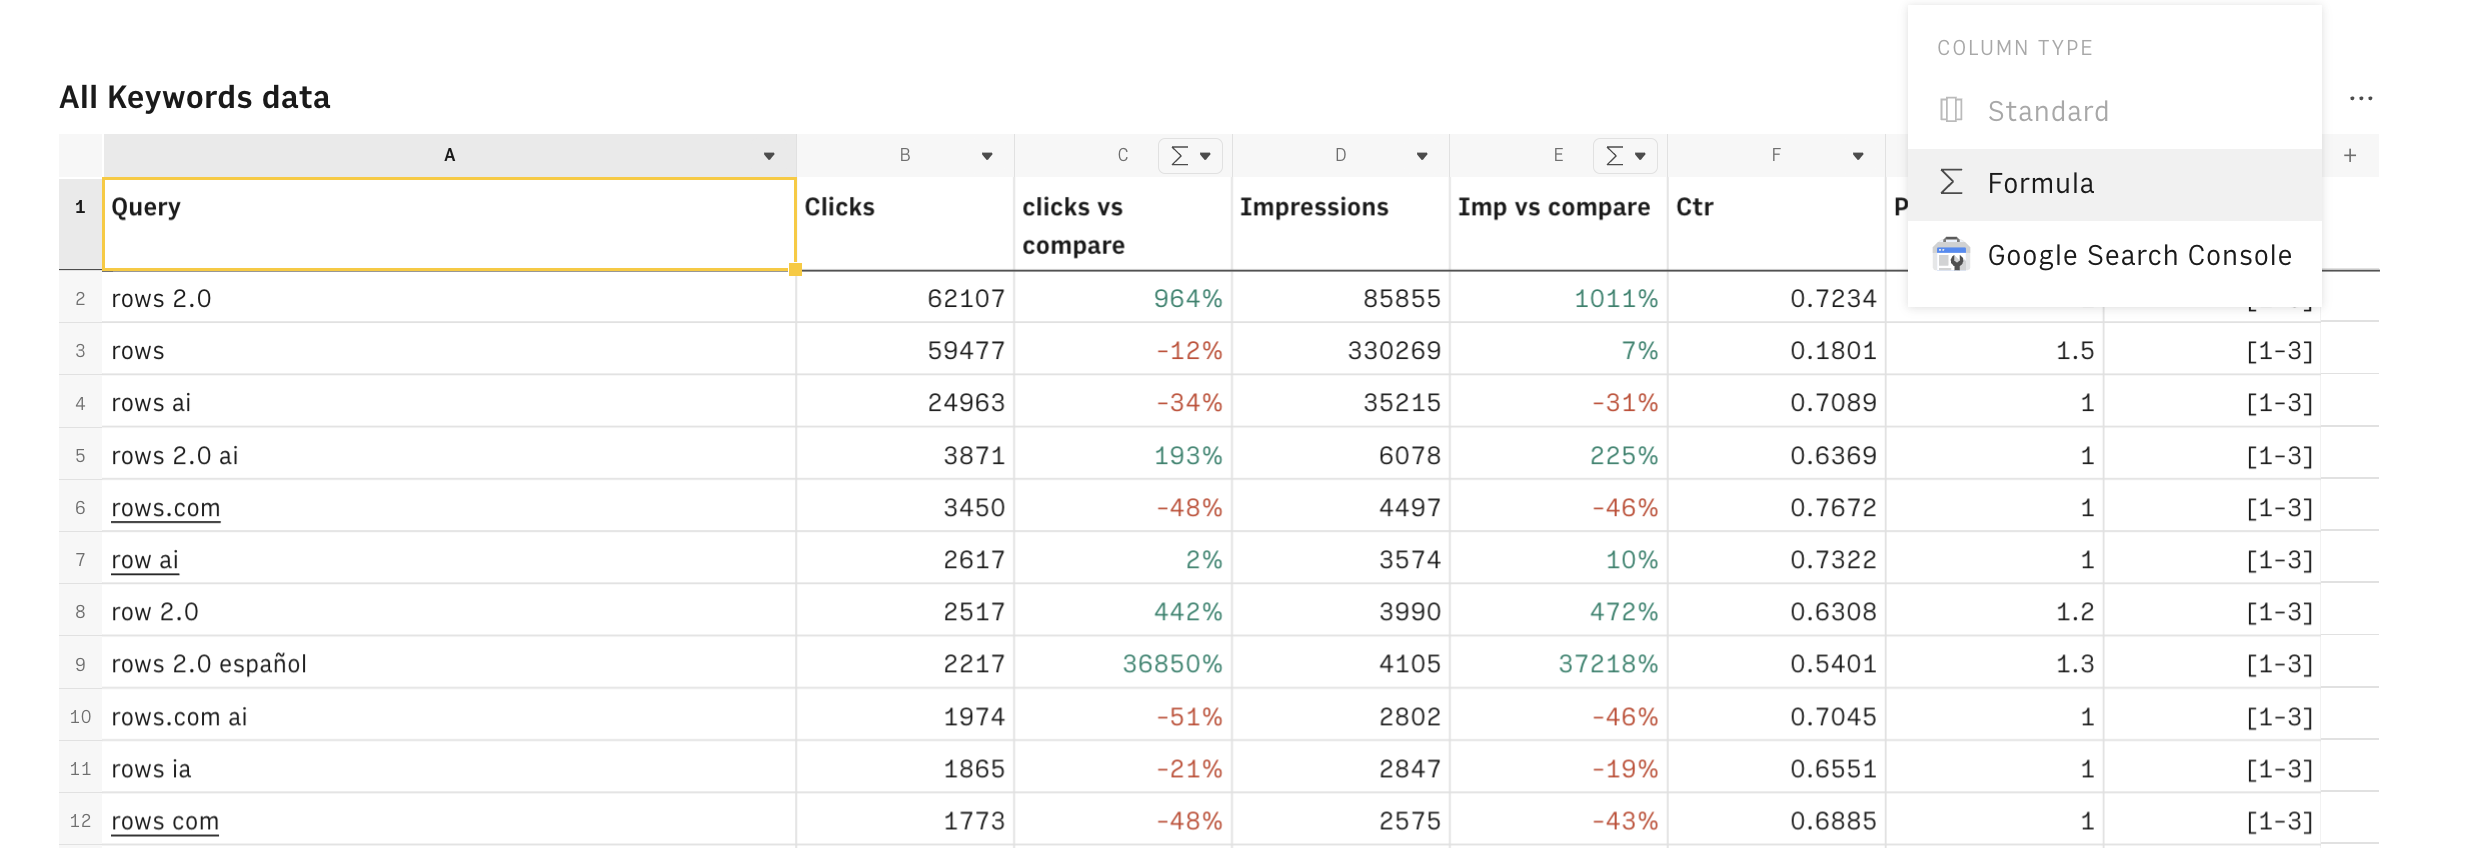
Add column (with formula): Create a calculated column using a custom formula.
Add column from source: Bring in additional metrics from the original data source for enhanced analysis.
So, feel free to tailor the charts to suit your client’s needs and service offerings. As a rule of thumb, remember to title your template.
One of the best features you've got in your hands is our AI Analyst. With this feature, you can do any task from asking questions — Rows has an OPENAI integration, which means you can use AI to analyze data. In addition to that, you can summarize tables and create more charts if you want.
Note💡: In addition to our SEO report template, we have some other templates for SEO reporting — this time around, we are looking at templates that are created for specific use cases ranging from keyword research, cannibalization, keywords clustering to CTR —
Check out the best SEO dashboard templates in 2024, from Rows.
How to Identify the Key Metrics to Include in SEO Reports?
The most effective SEO reports showcase a holistic overview of your efforts' performance as it relates to your client's business goals.
Then you know there's something wrong. So, before you send the next report, start by understanding your client's overarching business goals. Are they aiming to increase brand awareness, drive sales, generate leads, or something else? The metrics you choose should directly reflect these objectives.
If the goal is to boost e-commerce sales, focus on metrics like organic traffic to product pages, conversion rates, and revenue generated from organic search.
Identify the KPIs most critical to tracking progress towards the client's goals. These should be the stars of your report, presented prominently and with clear explanations.
How Can You Make SEO Reports Easy for Clients to Understand?
Here's how-to approach creating an easy to understand SEO report::
Ditch the Jargon and be clear
Use simple, everyday language that everyone can understand. Secondly, write your report in tandem with your client's industry language. Think "website visitors" instead of "organic traffic," and "better search rankings" instead of "improved SERP visibility." Per Seer Interactive, Unnecessary fillers are your enemy when writing SEO reports. “Fillers” are words or phrases that don’t add value to the report.
Show don't tell, lead with visuals.
Numbers alone can be boring. But when you weave them into a compelling narrative, they come alive. Instead of just saying "organic traffic increased by 20%," show what that means: "That's like 200 more people walking into your online store every day!" Use visuals, analogies, and real-world examples to make the data tangible and relatable.
Make your report interactive and organized
Consider creating an organized structure for your report — so that it can be digestible and delectable to read.
Use interactive dashboards when possible and make sure the report is clickable and sharable in PDF format.
Additionally, break your reports into digestible sections with clear headings. You can't do these without using a very good SEO reporting software. So, check out our compiled list of best SEO reporting software in 2025.

A modern, flexible report to monitor your SEO efforts
Rows lets you sync your SEO data, manipulate and visualize it with the ease of a spreadsheet.
Try it now (it's free)Supercharge your SEO Reporting with Rows
With Rows, you can say goodbye to untidy SEO reports and focus on sharing valuable insights that matter most in a flexible dashboard.
A structured SEO report template can transform your client reporting process, providing consistency, clarity, and value.
With Rows' free SEO reporting template, life becomes easier. It's free to use; all you have to do is sign up to get a Rows, and viola! You are on the way to creating your best SEO reports yet.
Start using the template for free today and see how Rows can help you make your clients happy with half the effort.
