How to Check Conversion Discrepancies between Facebook Ads and Google Analytics in 2024

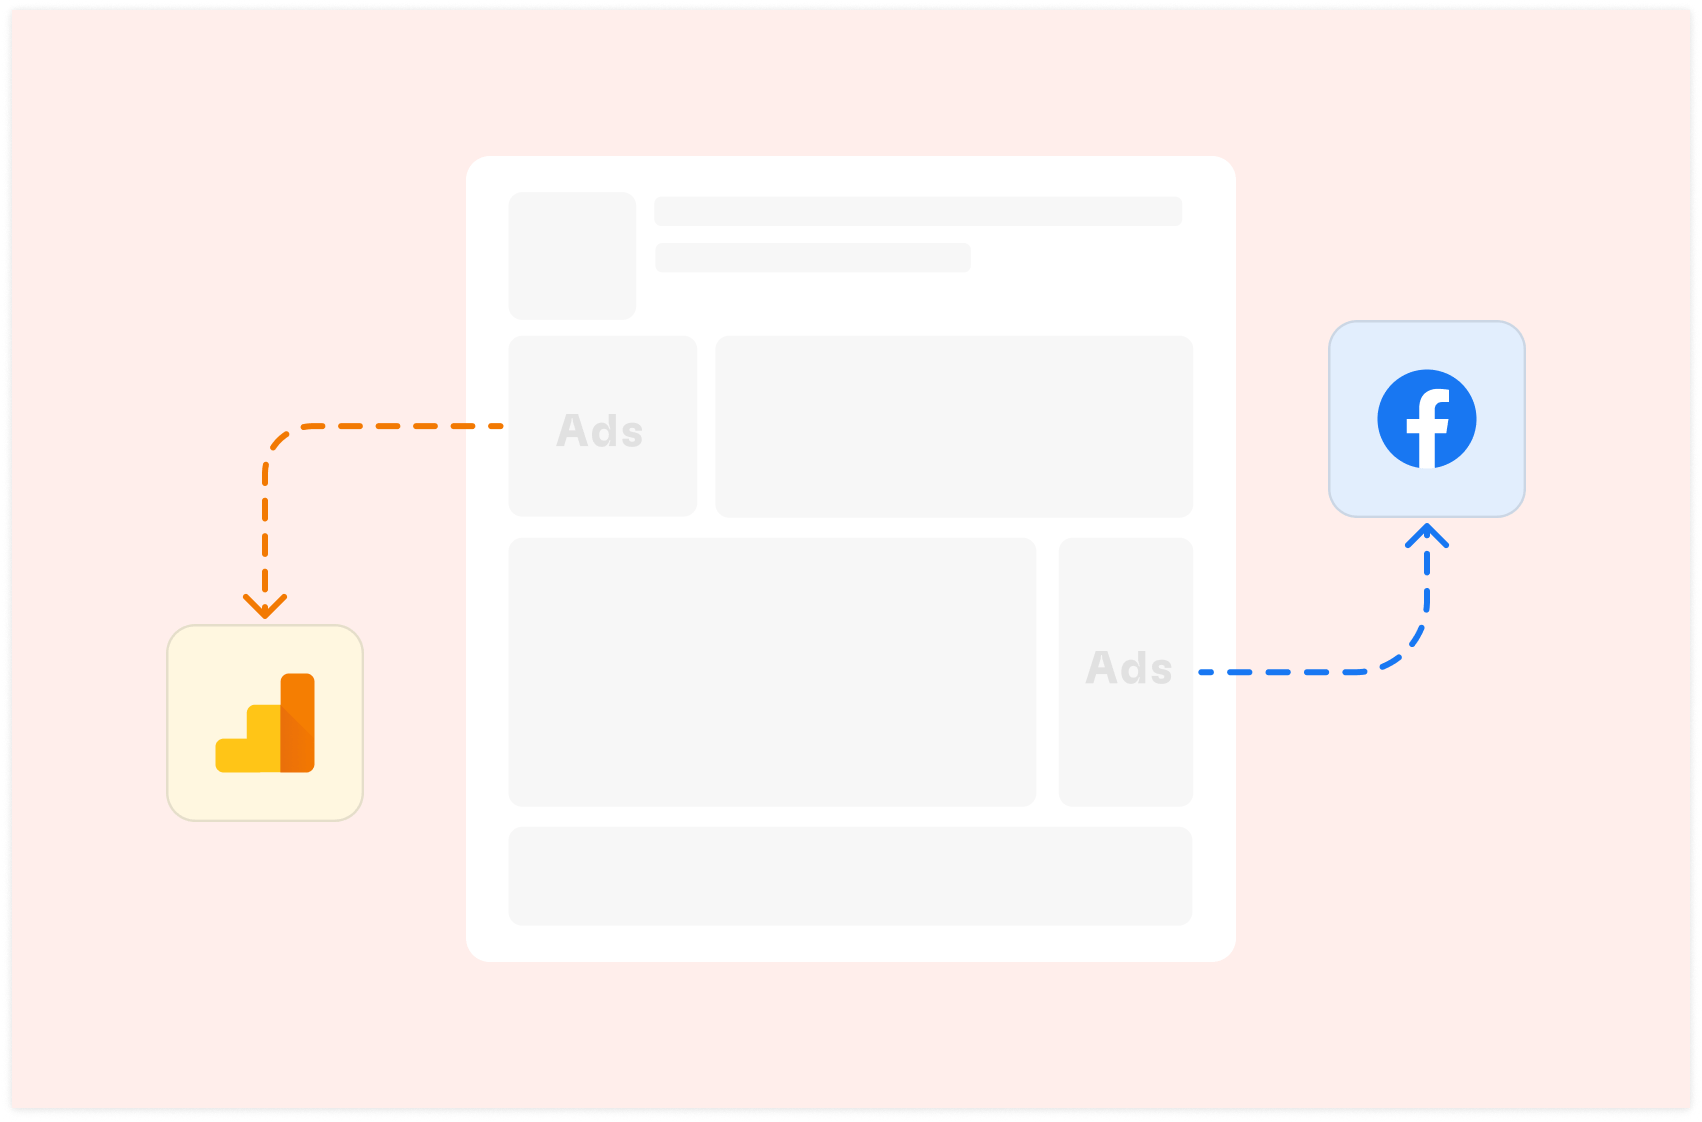
If you're running Facebook Ads and using Google Analytics 4 (GA4) to track your website's performance, you've likely encountered a frustrating issue: discrepancies in conversion events count.
These differences in reported conversions between the two platforms can leave you scratching your head, wondering which numbers to trust and how to make informed decisions about your marketing efforts.
Why Do These Discrepancies Matter?
Accurate conversion tracking is crucial for a number of reasons, including:
Evaluating campaign performance: Accurate data helps you identify which ads, keywords, or targeting options are most effective. It allows you to determine if campaigns are meeting their objectives and spot underperforming elements that need improvement.
Optimizing ad spend: With reliable conversion data, you can allocate budget to high-performing campaigns and cut wasteful spending. It enables you to adjust bids based on accurate information and calculate true cost per conversion for better budget planning.
Making data-driven decisions: Trustworthy data guides strategy and tactics more effectively. It allows you to A/B test with confidence, knowing results are accurate, and helps you identify trends and patterns to inform future campaigns.
Reporting: Accurate tracking enables you to provide reliable ROI figures and build trust by presenting consistent data across platforms. It helps you justify marketing investments with accurate performance metrics.
Understanding the customer journey: Precise conversion data allows you to track multi-touch attribution more effectively and identify which channels contribute most to conversions. This knowledge helps optimize the path to conversion across different platforms.
Compliance and auditing: Accurate data ensures proper financial reporting and audits. It helps maintain transparency in advertising performance claims.
When your numbers don't match up, it becomes challenging to know if you're truly hitting your goals or getting the most out of your advertising budget. Mismatched data makes it difficult to make informed decisions about campaign strategy and prove the value of your marketing efforts.

Your new AI Data Analyst
Extract from PDFs, import your business data, and analyze it using plain language.
Try Rows (no signup)Common Causes of Conversion Discrepancies
Several factors can contribute to differences in conversion reporting:
Attribution models: Facebook and GA4 use different methods to credit conversions to specific ads or touchpoints. This includes differences in lookback windows, first-click vs. last-click attribution, and multi-touch attribution models. Understanding these differences helps interpret data more accurately across platforms.
Tracking implementation: Errors in pixel or tag setup can lead to missed or duplicate conversions. This includes incorrect placement of tracking code, conflicts with other scripts, or failure to track all relevant conversion events. Regular audits of tracking implementation can help identify and resolve these issues.
Time zones: Differences in how platforms record event times can cause mismatches. This is particularly important for businesses operating across multiple time zones or running time-sensitive campaigns. Ensuring consistent time zone settings across all platforms can minimize these discrepancies.
Cookie settings: User privacy choices and browser settings can impact tracking accuracy. This includes issues like Intelligent Tracking Prevention (ITP) on Safari, third-party cookie blocking, and user opt-outs. Staying informed about privacy regulations and browser updates is crucial for maintaining accurate tracking.
Click-through vs. view-through conversions: Facebook may count conversions from users who saw but didn't click an ad, while GA4 typically doesn't. This can lead to significant differences in reported conversions, especially for awareness or branding campaigns. Understanding the distinction between these conversion types is essential for accurate performance analysis.
Cross-device tracking capabilities: Platforms differ in their ability to track users across multiple devices. Facebook's logged-in user base gives it an advantage in cross-device tracking, while GA4 may struggle to connect user journeys across different devices without proper setup.
Data sampling: Some platforms may use data sampling for high-volume accounts, which can lead to discrepancies in reported numbers. Understanding when and how sampling occurs can help interpret differences in conversion data.
Conversion window settings: Different default or custom conversion windows between platforms can result in varying conversion counts. Aligning these settings as closely as possible across platforms can help reduce discrepancies.
Recognizing these factors helps marketers diagnose reporting inconsistencies, set realistic expectations for data alignment, and develop strategies to mitigate discrepancies. Regular cross-platform data comparisons and ongoing tracking maintenance are essential for ensuring the most accurate and useful conversion reporting possible.
The Manual Checking Headache
Without a streamlined solution, marketers often resort to manually comparing data between Facebook Ads and GA4. This process is:
Time-consuming
Prone to human error
Difficult to visualize trends over time
Wouldn't it be great if there was a better way? Enter our automated spreadsheet template.
The Solution: Automated Report for Conversion Comparison
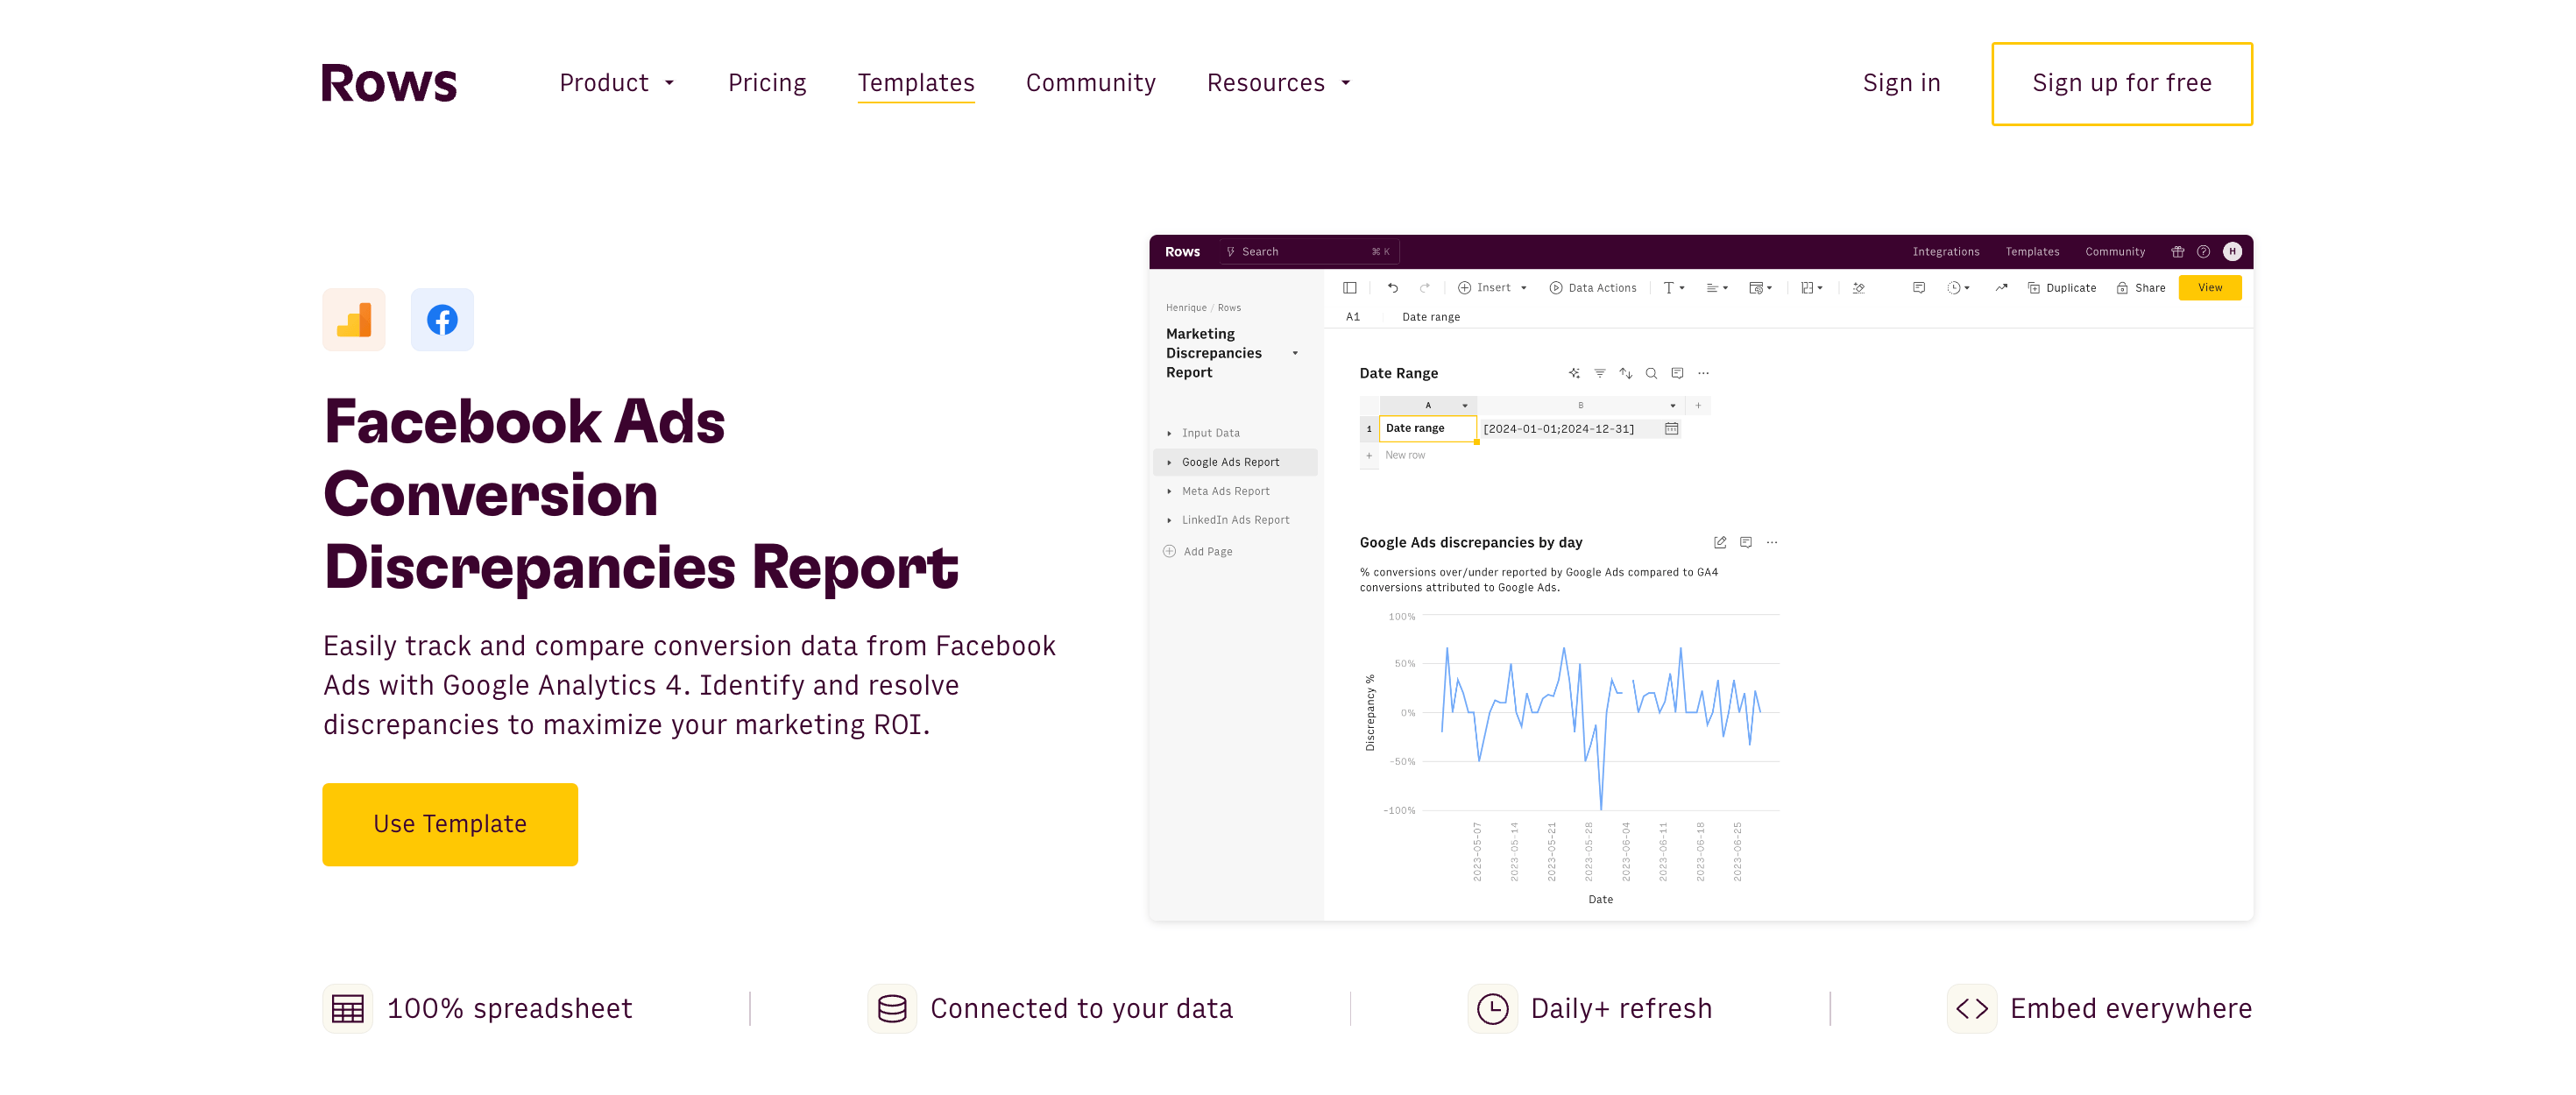
At Rows, we've created a Facebook Ads Conversion Discrepancies Report template that pulls live data from both Facebook Ads and GA4, allowing you to easily compare conversion data side-by-side.
This spreadsheet saves time, reduces errors, and provides clear visualizations of any discrepancies.
Do you use LinkedIn Ads and/or Google Ads? Try these templates too:
LinkedIn Ads Conversion Discrepancies Report
Google Ads Conversion Discrepancies Report
What is Rows?
Rows is a modern spreadsheet that comes 50+ data integrations to ingest live data directly in the grid, AI capabilities that streamline data analysis and transformation and a beautiful document-like layout
Rows is particularly useful for performance marketers who need to analyze ads data from various platforms on a daily or weekly basis.
See below an example of how to import Facebook Ads campaign data:
How the Facebook Ads Discrepancies template works
Let's break down the key components of this time-saving tool and walk through how to use it effectively:
Step 1: Open the template
To start using the template, follow the steps below:
Access the template: Go to the spreadsheet template page and save it to one of your workspace folder.
Connect the integrations: Follow the provided instructions to connect your Google Analytics 4 and Facebook Ads accounts.
These connections allow the template to automatically fetch up-to-date data, eliminating the need for manual data entry.
Step 2: Setup
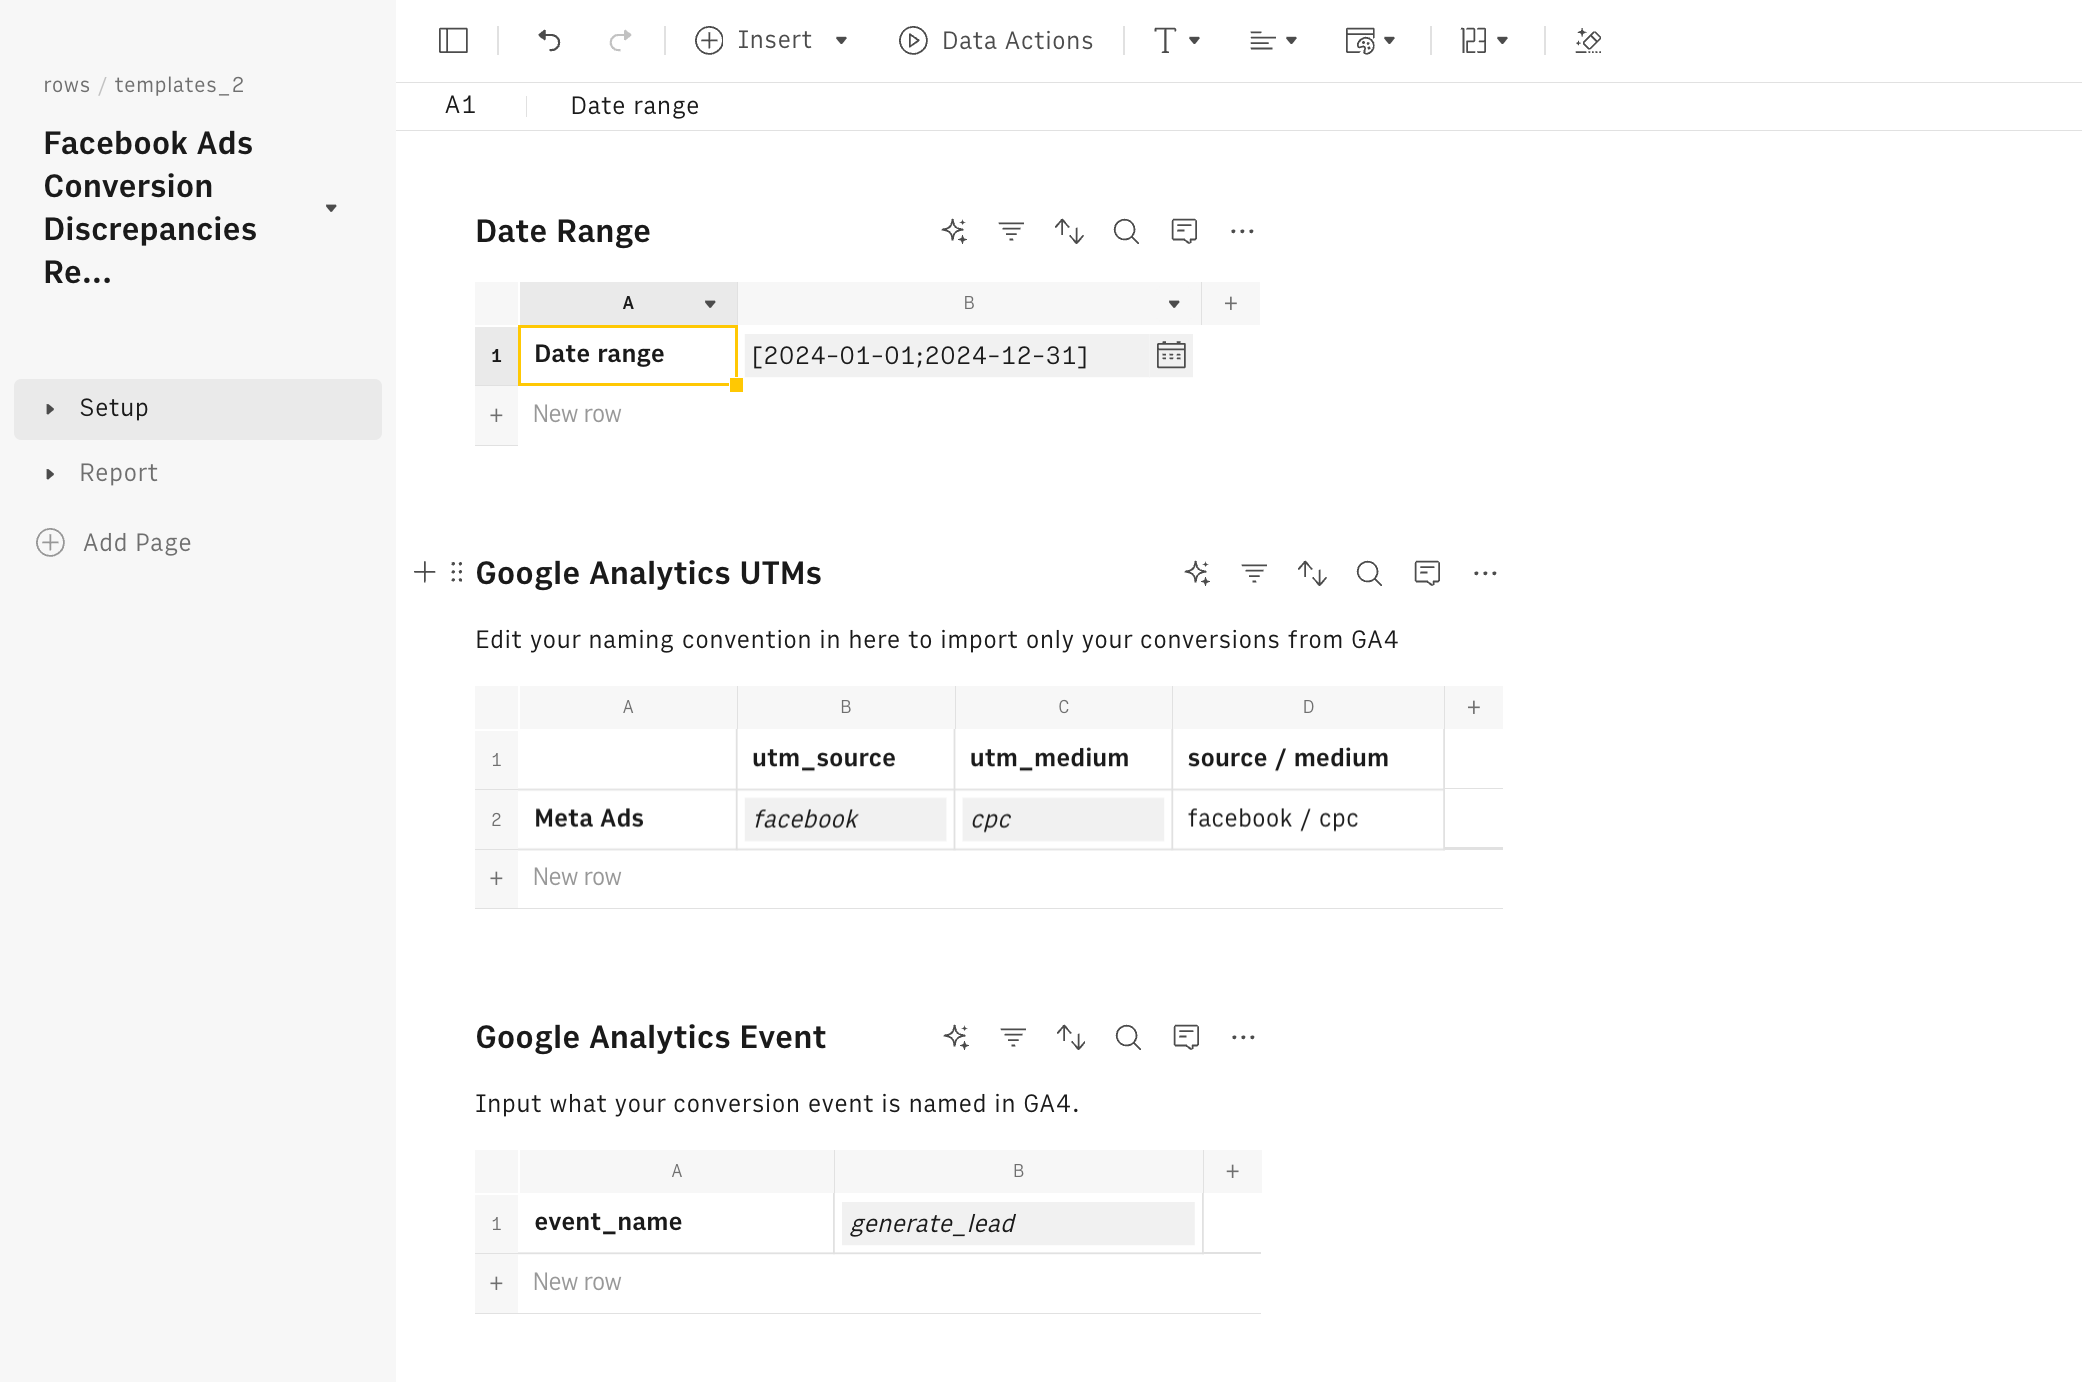
The Setup page is where you'll configure the essential parameters for your analysis:
Set the date range: Choose the period you want to analyze. This flexibility allows you to focus on specific campaigns or compare performance over time.
Edit naming conventions: Input your specific UTM parameters for utm_source and utm_medium. This ensures you're pulling the correct data from GA4 based on your campaign structure.
Specify the event name: Enter the conversion event you want to track (e.g., "generate_lead"). This further filters your GA4 data to focus on the right conversion metric.
Step3: The Report
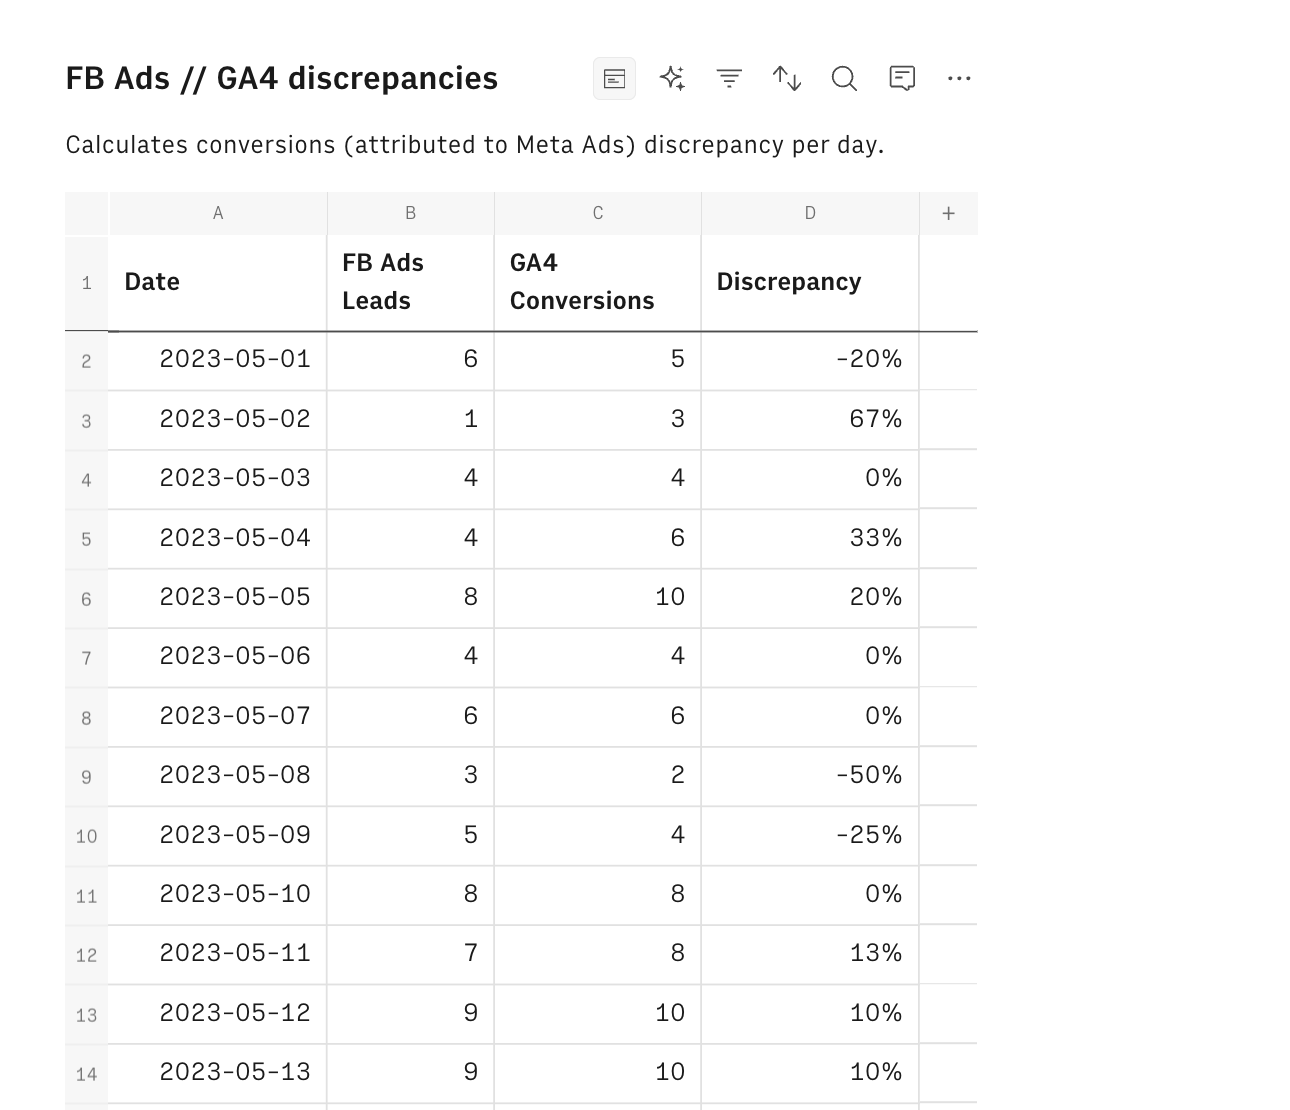
The Report page is where the magic happens. It consists of three main data tables and a visualization:
GA4 Data Table:
Automatically pulls conversion data from Google Analytics 4 based on your specified parameters.
Review this table to see your GA4-reported conversions for each day in your selected range.
Facebook Ads Data Table:
Retrieves conversion data from your Facebook Ads account for the same period.
Examine this table to understand how Facebook is tracking your conversions.
Combined Data Table:
Merges the data from both sources, displaying daily conversions side-by-side.
Highlights any discrepancies between the two platforms.
Pay close attention to days with significant differences, as these may require further investigation.
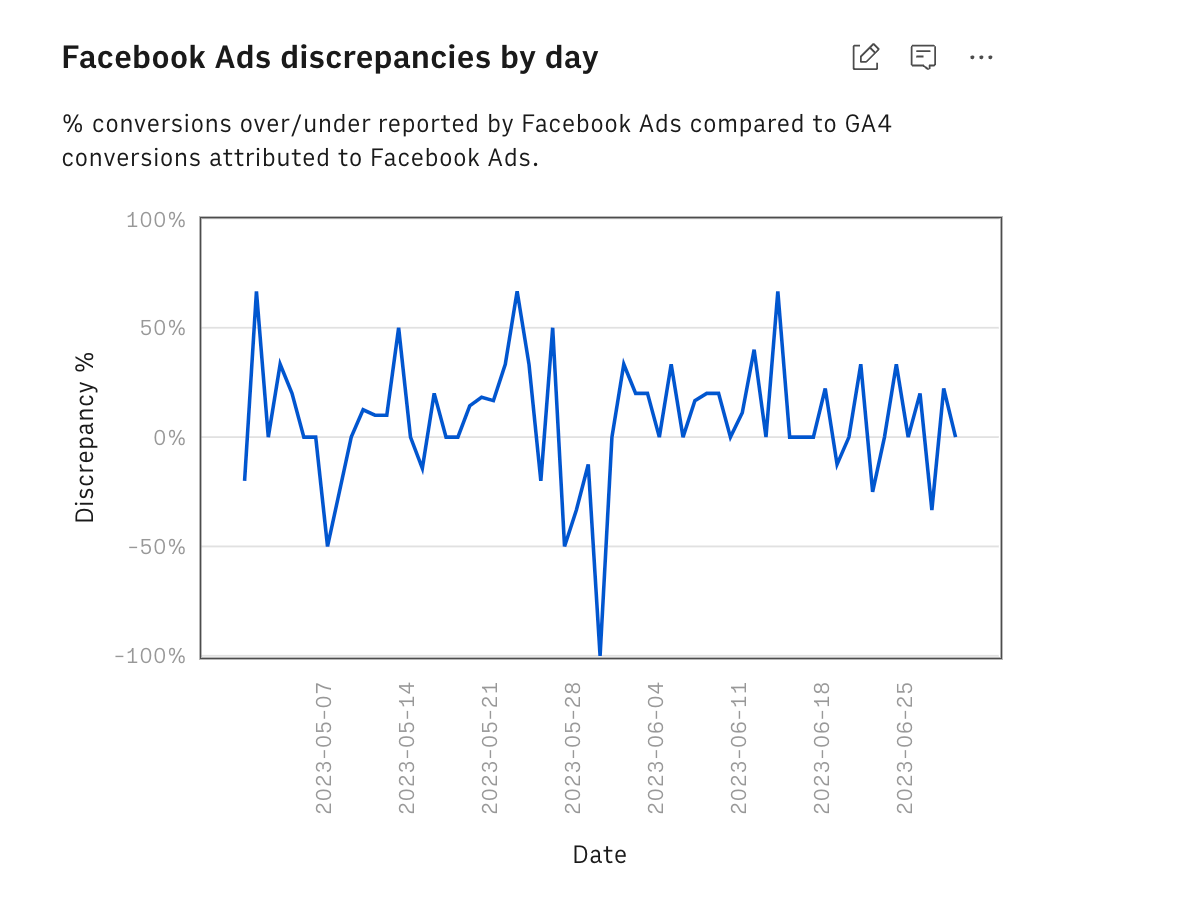
Discrepancy Trend Chart:
A line graph that visually represents the daily differences between Facebook and GA4 conversions.
Use this chart to easily spot patterns or trends in the discrepancies over time.
Analyzing the Results
Once your data is flowing into the template, it's time to start your analysis:
Review the individual data tables: Compare the raw numbers from GA4 and Facebook Ads to get a sense of the overall picture. Look for any days with unusually high or low conversions on either platform.
Examine the combined table: Focus on days with significant discrepancies, which are highlighted for easy identification. Consider what might have caused these differences (e.g., changes in ad spend, new campaigns launched, tracking issues).
Study the trend chart: Observe any patterns in the discrepancies over time. Ask yourself:
Are the discrepancies consistent?
Are they growing or shrinking over time?
Do they correlate with any specific events or changes in your campaigns?
How to Use Rows for Ongoing Monitoring
The real power of the Facebook Ads Conversion Discrepancies Report template lies in its ability to provide ongoing, automated monitoring. Here's how you can make the most of it:
Set Up Regular Data Refreshes
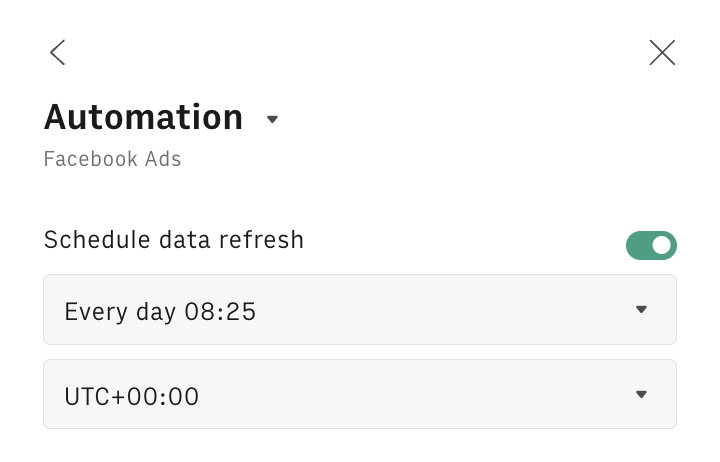
Rows allows you to schedule automatic data refreshes. Set up daily or weekly updates to ensure you're always working with the most current data.
To do so, click on the Option menu (...) on both data tables and pick 'Edit Data Table'. Then select the Automation table and toggle on the refresh, as follows:
Create Custom Alerts
Use Rows' functionality to set up custom alerts. For example, you could create an alert that notifies you when the disparity between Facebook Ads and Google Analytics conversions exceeds a certain threshold.
You can do so by using our SEND_EMAIL function. Let's try together step-by-step:
Add a formula column to the Facebook Ads // GA4 discrepancies table, by clicking on the + button in the top right corner
Name the column as Alert and enclose the SEND_EMAIL formula into a IF condition that checks if the discrepancy is above some threshold, let's say 10%, as follows:
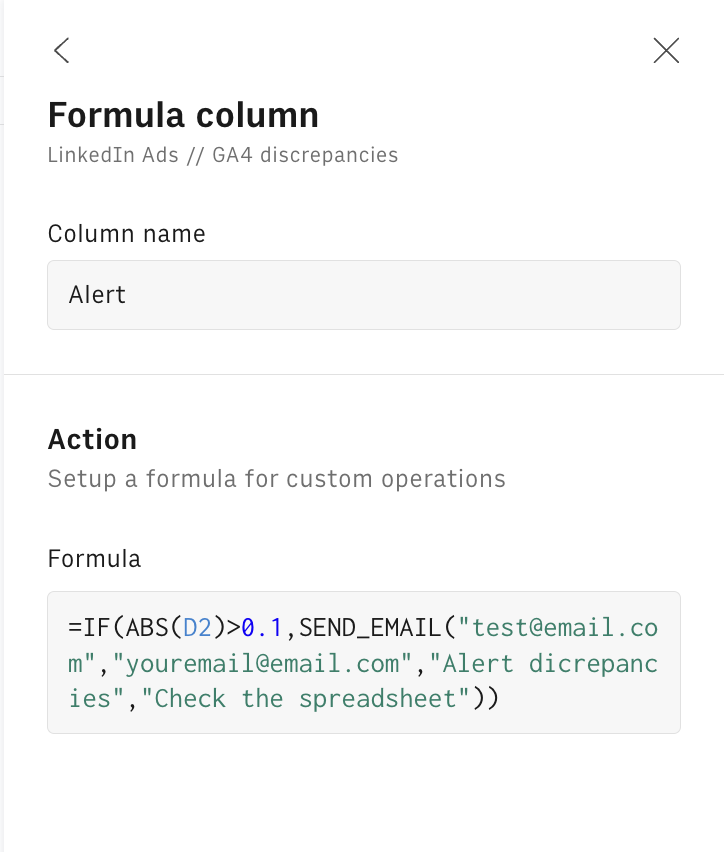
The SEND_EMAIL syntax includes the following parameters in order:
=IF(ABS(D2)>0.1,SEND_EMAIL("test@email.com","youremail@email.com","Alert dicrepancies","Check the spreadsheet"))the [from] address
the [to] address
the [object] of the email
the [body] of the email
4. Click on 'Save all changes'. The email function will be triggered only above the threshold and send an email to the specified [to] address notifying of any abnormal discrepancies.
Utilize AI-Powered Insights
Take advantage of Rows' AI capabilities to gain deeper insights into your data and streamline otherwise complex syntaxes just by using natural languages.
In the following example, we used our AI Analyst to automate data pivoting from Google Search Console data:
Or alternatively, we used our EXTRACT_OPENAI function to extract only the CRMs tools from an array of software names:
Taking Action Based on Insights
Based on your findings, you can now make informed decisions:
Investigate large discrepancies: If you notice substantial differences on specific days, dig deeper into those campaigns or ad sets. Check for any tracking issues, changes in ad delivery, or external factors that might have influenced performance.
Check tracking setup: Persistent discrepancies might indicate issues with your pixel or tag implementation. Review your setup on both platforms to ensure everything is configured correctly.
Adjust reporting: Consider using an average of both platforms or explaining the discrepancies in your reports to stakeholders. This transparency can help build trust and demonstrate your thorough approach to data analysis.
Optimize campaigns: Use the insights gained to refine your targeting, ad creative, or landing pages. For example, if you notice that certain types of campaigns consistently show larger discrepancies, you might need to adjust your attribution model or tracking approach for those specific efforts.
By regularly using this template and following these steps, you'll gain a much clearer picture of your true conversion performance across both Facebook Ads and Google Analytics 4.
This data-driven approach will empower you to make more informed decisions about your advertising strategy, optimize your campaigns more effectively, and provide more accurate reporting to stakeholders.
Remember, the goal isn't to achieve perfect alignment between platforms, but rather to understand the differences and use that knowledge to drive better results. With this automated tool at your disposal, you're well-equipped to tackle the challenge of conversion discrepancies and take your digital advertising efforts to the next level.

Your new AI Data Analyst
Extract from PDFs, import your business data, and analyze it using plain language.
Try Rows (no signup)Best Practices for Minimizing Conversion Discrepancies
While our template helps you identify and track discrepancies, it's also important to work on reducing them. Here are some tips:
Consistent naming conventions: Use clear, consistent UTM parameters across all your campaigns.
Regular audits: Periodically check your tracking implementation on both platforms.
Time zone alignment: Ensure Facebook Ads and GA4 are set to the same time zone.
Consider attribution windows: Be aware of the different default attribution models and adjust as needed.
Education: Help your team understand the reasons for discrepancies and how you're addressing them.
Conclusion: Empowering Data-Driven Marketing
In the world of digital advertising, accurate conversion tracking is essential for success. While discrepancies between Facebook Ads and Google Analytics 4 can be frustrating, our automated spreadsheet template offers a powerful solution.By streamlining the process of comparing conversion data, you can:
Save valuable time
Increase accuracy in reporting
Gain deeper insights into your campaign performance
Make more informed decisions about your advertising strategy
Remember, the goal isn't necessarily to achieve perfect alignment between platforms, but rather to understand the differences and use that knowledge to drive better results. Start using the template today, and take control of your conversion tracking..
Do you use LinkedIn Ads and Google Ads too? Check out the following articles:

