How to Check Conversion Discrepancies between LinkedIn Ads and Google Analytics in 2025

As a performance marketer, you know the drill. You pull up your latest campaign reports, and there it is again - a glaring discrepancy between the conversion numbers in LinkedIn Ads and Google Analytics.
It's frustrating, but it's also a common issue that can significantly impact your decision-making and campaign optimization.Let's dive into a quick solution to this problem, helping you ensure your marketing efforts are based on accurate, reliable data.
Why Tracking Conversions Accurately Matters
Understanding and addressing discrepancies in conversion tracking between LinkedIn Ads and Google Analytics is crucial for effective digital marketing. Here's why:
Precise Campaign Performance Evaluation
Accurate conversion data is key to assessing performance. When numbers don't match up, you're left questioning which set truly reflects your campaign's success. This uncertainty can lead to misinterpretation of results, potentially causing you to misjudge campaign effectiveness.
Optimizing Ad Spend for Maximum ROI
In PPC advertising, every dollar counts. Discrepancies in conversion data can lead to misallocation of your advertising budget. You might increase spending on campaigns that appear successful in one platform but underperform in another, or cut budget from campaigns that are actually delivering strong results.
Making Truly Data-Driven Decisions
When faced with conflicting data sets, the principle of data-driven decision making becomes challenging to uphold. Discrepancies force you to question which data source to trust, potentially leading to decision paralysis or decisions based on flawed assumptions.
Building Trust Through Accurate Reporting
Whether you're reporting to clients or upper management, consistency and accuracy in your data are crucial for maintaining credibility. Conflicting numbers from different platforms can undermine confidence in your reporting and, by extension, your marketing strategy.

Your new AI Data Analyst
Extract from PDFs, import your business data, and analyze it using plain language.
Try Rows (no signup)How Marketers Usually Tackle Discrepancies
Faced with these discrepancies, many marketers resort to manually comparing data between LinkedIn Ads and Google Analytics. While this approach might seem straightforward, it comes with several drawbacks:
It's time-consuming
It's prone to error and inconsistencies
It's challenging for identifying long-term patterns
These challenges highlight the need for a more efficient, automated solution that can provide consistent, accurate comparisons between LinkedIn Ads and Google Analytics data.
The Solution: The LinkedIn Ads Conversion Discrepancies Report Template
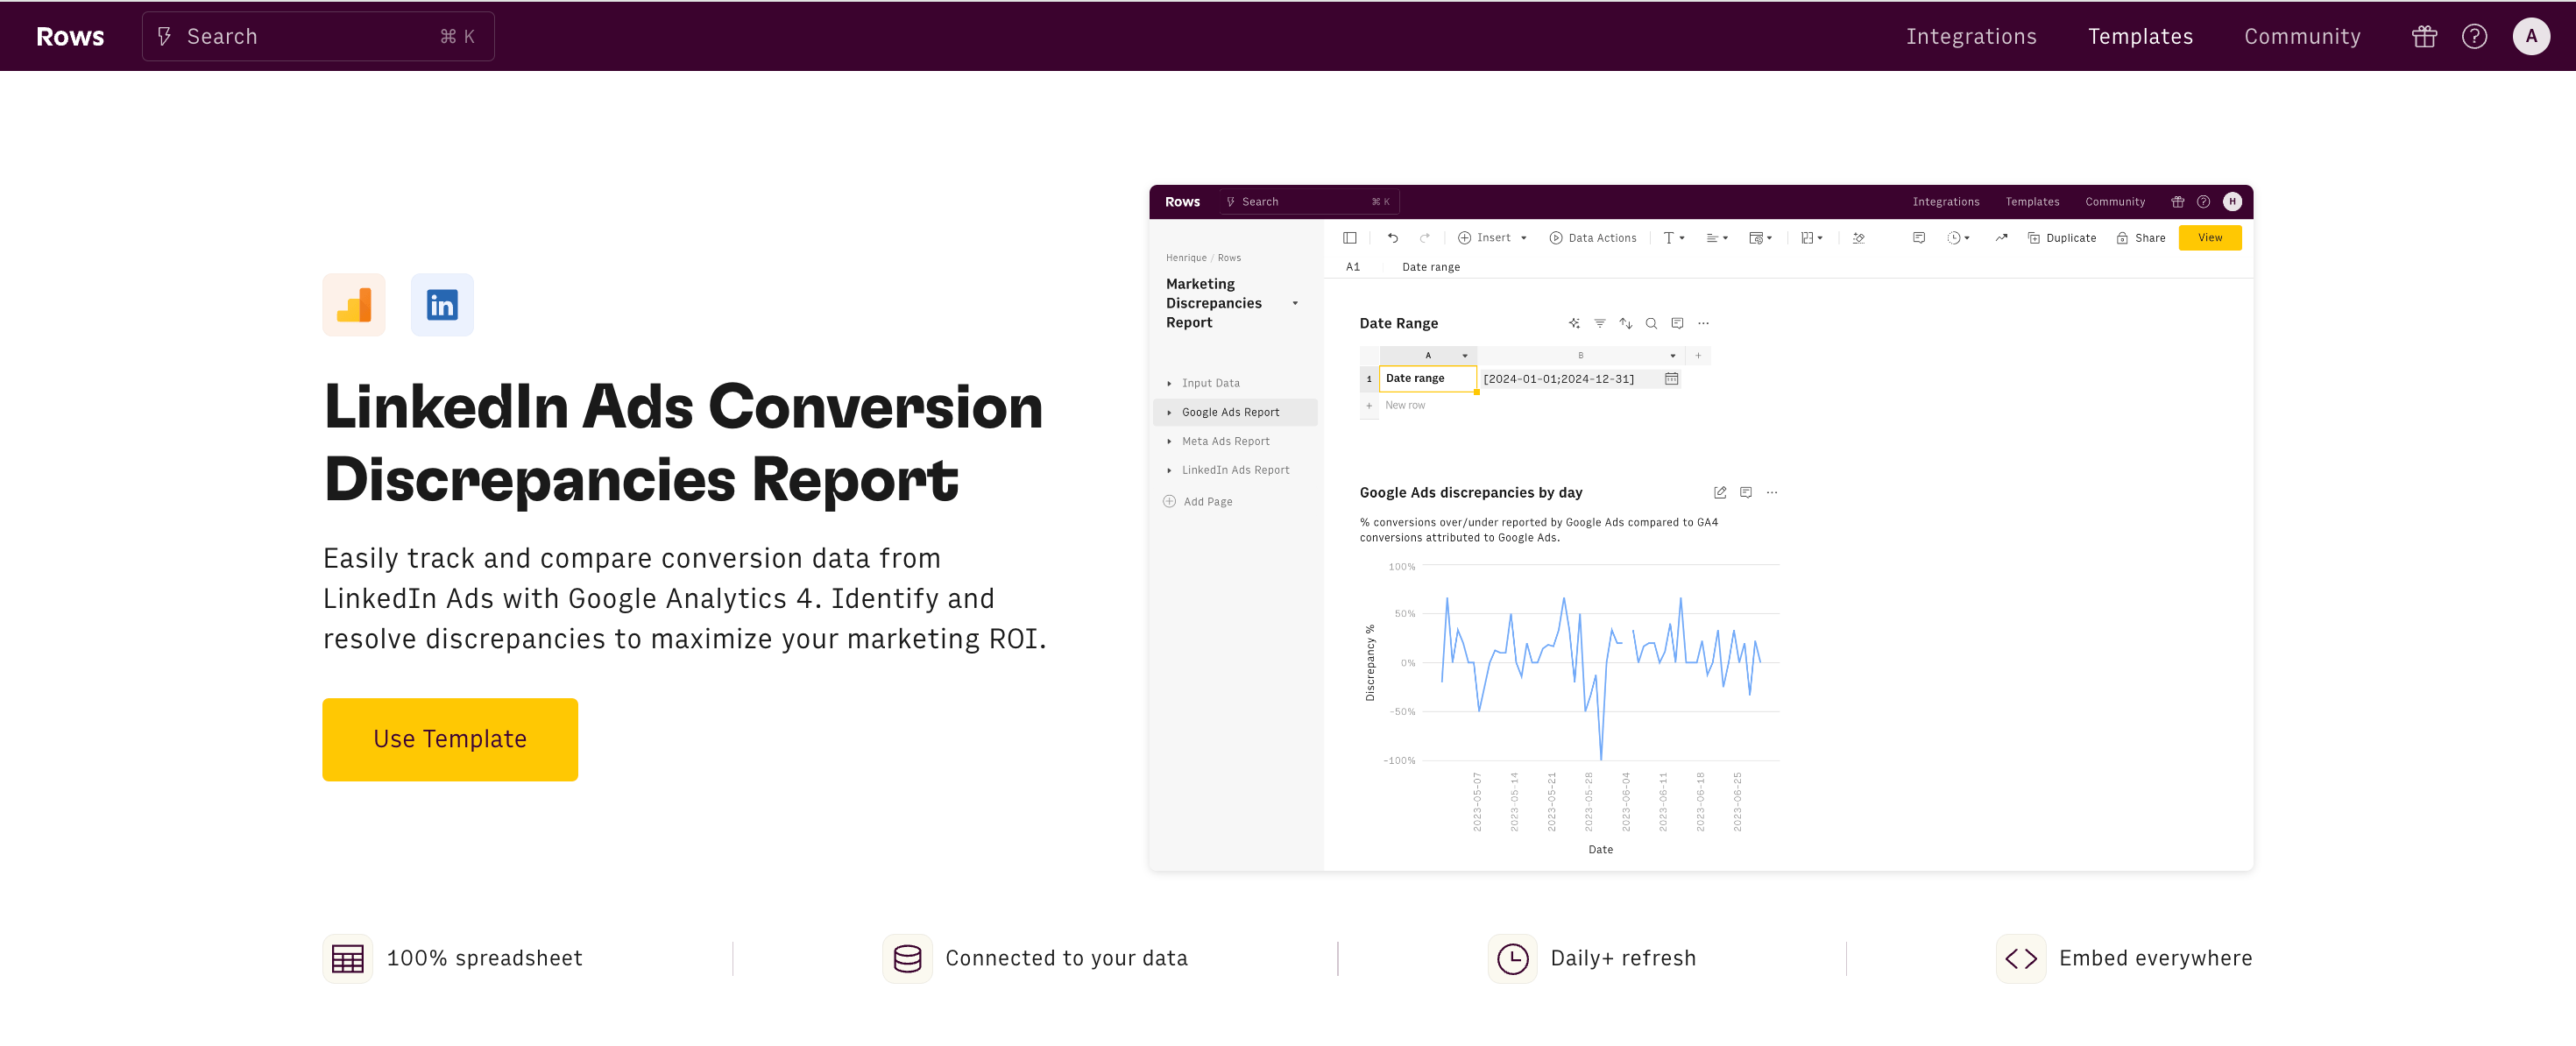
To address the challenge of mismatched conversion data, we've developed the LinkedIn Ads Conversion Discrepancies Report template using Rows.
This powerful spreadsheet automates the process of comparing conversion metrics between LinkedIn Ads and Google Analytics, saving you hours of manual work and reducing the risk of human error.
Do you use Facebook Ads and/or Google Ads? Try these templates too:
Facebook Ads Conversion Discrepancies Report
Google Ads Conversion Discrepancies Report
What is Rows?
Rows is a modern spreadsheet that comes 50+ data integrations to ingest live data directly in the grid, AI capabilities that streamline data analysis and transformation and a beautiful document-like layout
Rows is particularly useful for performance marketers who need to analyze ads data from various platforms on a daily or weekly basis.
See below an example of how to import LinkedIn Ads campaign data:
How to use the LinkedIn Ads Discrepancies template
Step 1: Setup and Configuration
Access the template: Navigate to the Rows template page and click on "Use Template". Then pick a folder and save it to your workspace.
Connect your accounts: Link your Google Analytics and LinkedIn Ads accounts following the provided instructions.
In the Setup page, configure the parameters:
Define your date range for analysis
Input your specific UTM parameters for utm_source and utm_medium
Specify the conversion event you want to track (e.g., "form_submission")
Step 2: Data Analysis
Once configured, the template populates automatically with data from both platforms. The Report page consists of four key components:
Google Analytics Data Table: Daily conversion data from Google Analytics
LinkedIn Ads Data Table: Daily conversion data from LinkedIn Ads
Consolidated Data Table: Side-by-side comparison highlighting disparities
Disparity Trend Graph: Visual representation of daily differences over time
Step 3: Interpreting Results and Taking Action
With your data now visualized, it's time to dig into the analysis:
Examine individual tables: Look for anomalies or unusual conversion numbers.
Focus on the consolidated table: Pay attention to days with significant disparities.
Study the trend graph: Identify patterns, trends, or specific days with notable discrepancies.
Based on your findings, take informed action:
Investigate major disparities: Dig into specific campaigns or ad groups running during periods of significant discrepancy.
Review tracking setup: Double-check your LinkedIn Ads conversion tracking and Google Analytics event configuration.
Refine campaigns: Optimize targeting, ad creatives, or landing pages based on your insights.
Adjust reporting methods: Be transparent about known disparities when presenting results to stakeholders.
How to Use Rows for Ongoing Monitoring
The real power of the LinkedIn Ads Conversion Discrepancies Report template lies in its ability to provide ongoing, automated monitoring. Here's how you can make the most of it:
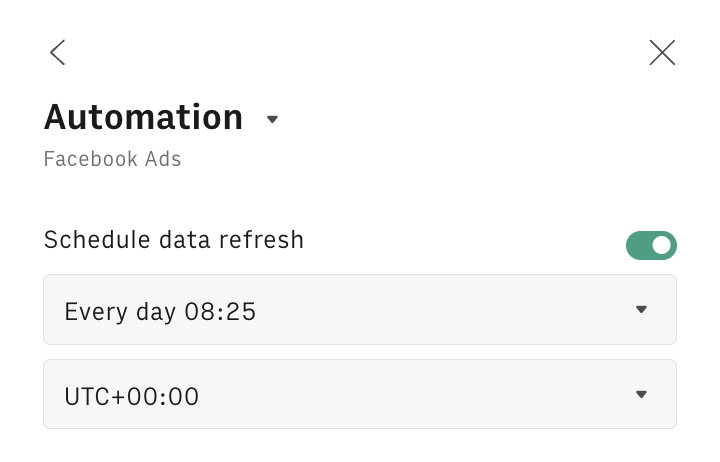
Set Up Regular Data Refreshes
Rows allows you to schedule automatic data refreshes. Set up daily or weekly updates to ensure you're always working with the most current data.
To do so, click on the Option menu (...) on both data tables and pick 'Edit Data Table'. Then select the Automation table and toggle on the refresh, as follows:
Create Custom Alerts
Use Rows' functionality to set up custom alerts. For example, you could create an alert that notifies you when the disparity between LinkedIn Ads and Google Analytics conversions exceeds a certain threshold.
You can do so by using our SEND_EMAIL function. Let's try together step-by-step:
Add a formula column to the LinkedIn Ads // GA4 discrepancies table, by clicking on the + button in the top right corner
Name the column as Alert and enclose the SEND_EMAIL formula into a IF condition that checks if the discrepancy is above some threshold, let's say 10%, as follows:
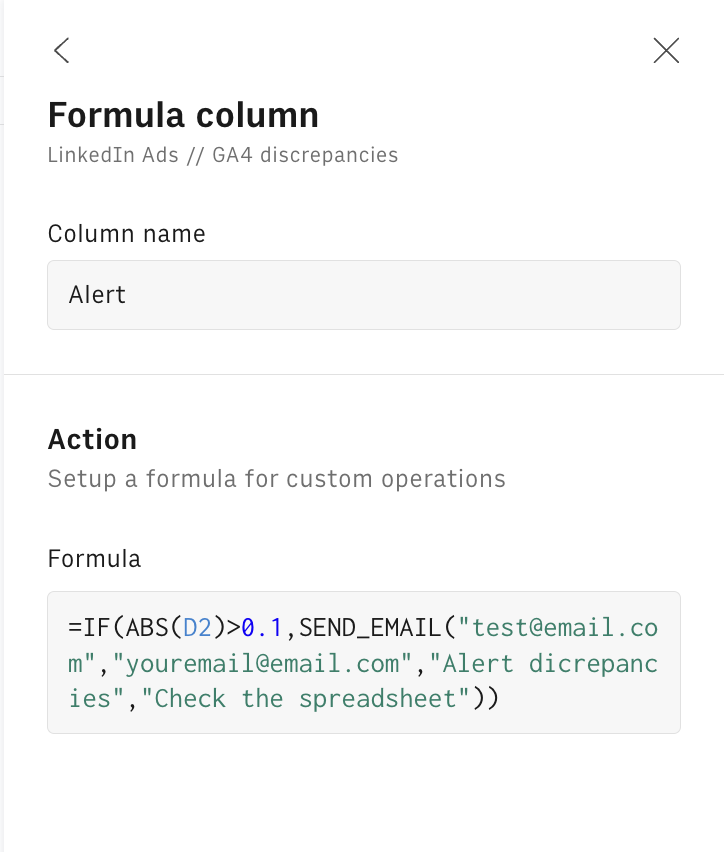
The SEND_EMAIL syntax includes the following parameters in order:
=IF(ABS(D2)>0.1,SEND_EMAIL("test@email.com","youremail@email.com","Alert dicrepancies","Check the spreadsheet"))the [from] address
the [to] address
the [object] of the email
the [body] of the email

4. Click on 'Save all changes'. The email function will be triggered only above the threshold and send an email to the specified [to] address notifying of any abnormal discrepancies.
Utilize AI-Powered Insights
Take advantage of Rows' AI capabilities to gain deeper insights into your data and streamline otherwise complex syntaxes just by using natural languages.
In the following example, we used our AI Analyst to automate data pivoting from Google Search Console data:
Or alternatively, we used our EXTRACT_OPENAI function to extract only the CRMs tools from an array of software names:
Your new AI Data Analyst
Extract from PDFs, import your business data, and analyze it using plain language.
Try Rows (no signup)Understanding the Root Causes of Conversion Disparities
To effectively address these discrepancies, it's crucial to understand their potential causes:
1. Different Attribution Models
LinkedIn Ads and Google Analytics often use different models to credit conversions to specific touchpoints in the user journey.
LinkedIn Ads: Offers various attribution models, including last-touch, first-touch, and multi-touch attribution.
Google Analytics: Typically defaults to a last-click attribution model, though it offers options for first-click, linear, and time decay models.
2. Incorrect Tag or Event Setup
Proper implementation of tracking codes is crucial for accurate conversion reporting.
LinkedIn Ads: Requires the LinkedIn Insight Tag and conversion tracking setup.
Google Analytics: Relies on proper event tracking setup.
Common issues include tags placed on the wrong pages, duplicate tags leading to over-counting, and incorrect event parameters.
3. Misaligned Settings Between Platforms
Time zone settings can cause conversions to be attributed to different days or even months in extreme cases.
4. User Preferences Affecting Tracking
Privacy concerns and user settings can impact tracking capabilities, including cookie restrictions, ad blockers, and Intelligent Tracking Prevention (ITP).
5. Click-Through vs. View-Through Conversions
LinkedIn Ads can track view-through conversions, while Google Analytics typically doesn't. This difference can lead to LinkedIn Ads reporting more conversions than Google Analytics.
6. Cross-Device Tracking Limitations
Users often interact with ads on one device and convert on another, presenting tracking challenges that can result in discrepancies.
7. Potential Use of Sampled Data in Google Analytics Reports
Data sampling can introduce discrepancies, especially for high-traffic websites.
Best Practices for Minimizing Conversion Disparities
While the Rows template helps identify discrepancies, it's equally important to work on reducing them:
Maintain consistent naming conventions across campaigns
Regularly audit your tracking implementation
Align time zones in LinkedIn Ads and Google Analytics
Understand and adjust attribution models as needed
Educate your team on the reasons for disparities and your approach to addressing them
Implement server-side tracking where possible
Leverage first-party data for improved accuracy
Stay informed about platform updates that may impact tracking
Conclusion
By implementing these practices and utilizing the LinkedIn Ads Conversion Discrepancies Report template in Rows, you'll be well-equipped to navigate the complexities of conversion tracking across platforms.
This approach will lead to more accurate reporting, deeper insights, and ultimately, more effective campaign optimization. Remember, perfect alignment between platforms is often unrealistic due to the inherent differences in how they track and attribute conversions.
Do you use Facebook Ads and Google Ads too? Check out the following articles: