How to Segment Branded and Non-Branded Conversions in 2025


SEO has become a major focus for businesses, with many investing significant resources into targeting non-branded long-tail keywords and creating in-depth content for specific user needs across various niches. However, the real challenge lies in measuring the return on this investment.
The key question is: what queries did ultimately generate more revenue? The only way to solve this is to effectively separate organic traffic generated by branded vs non-branded.
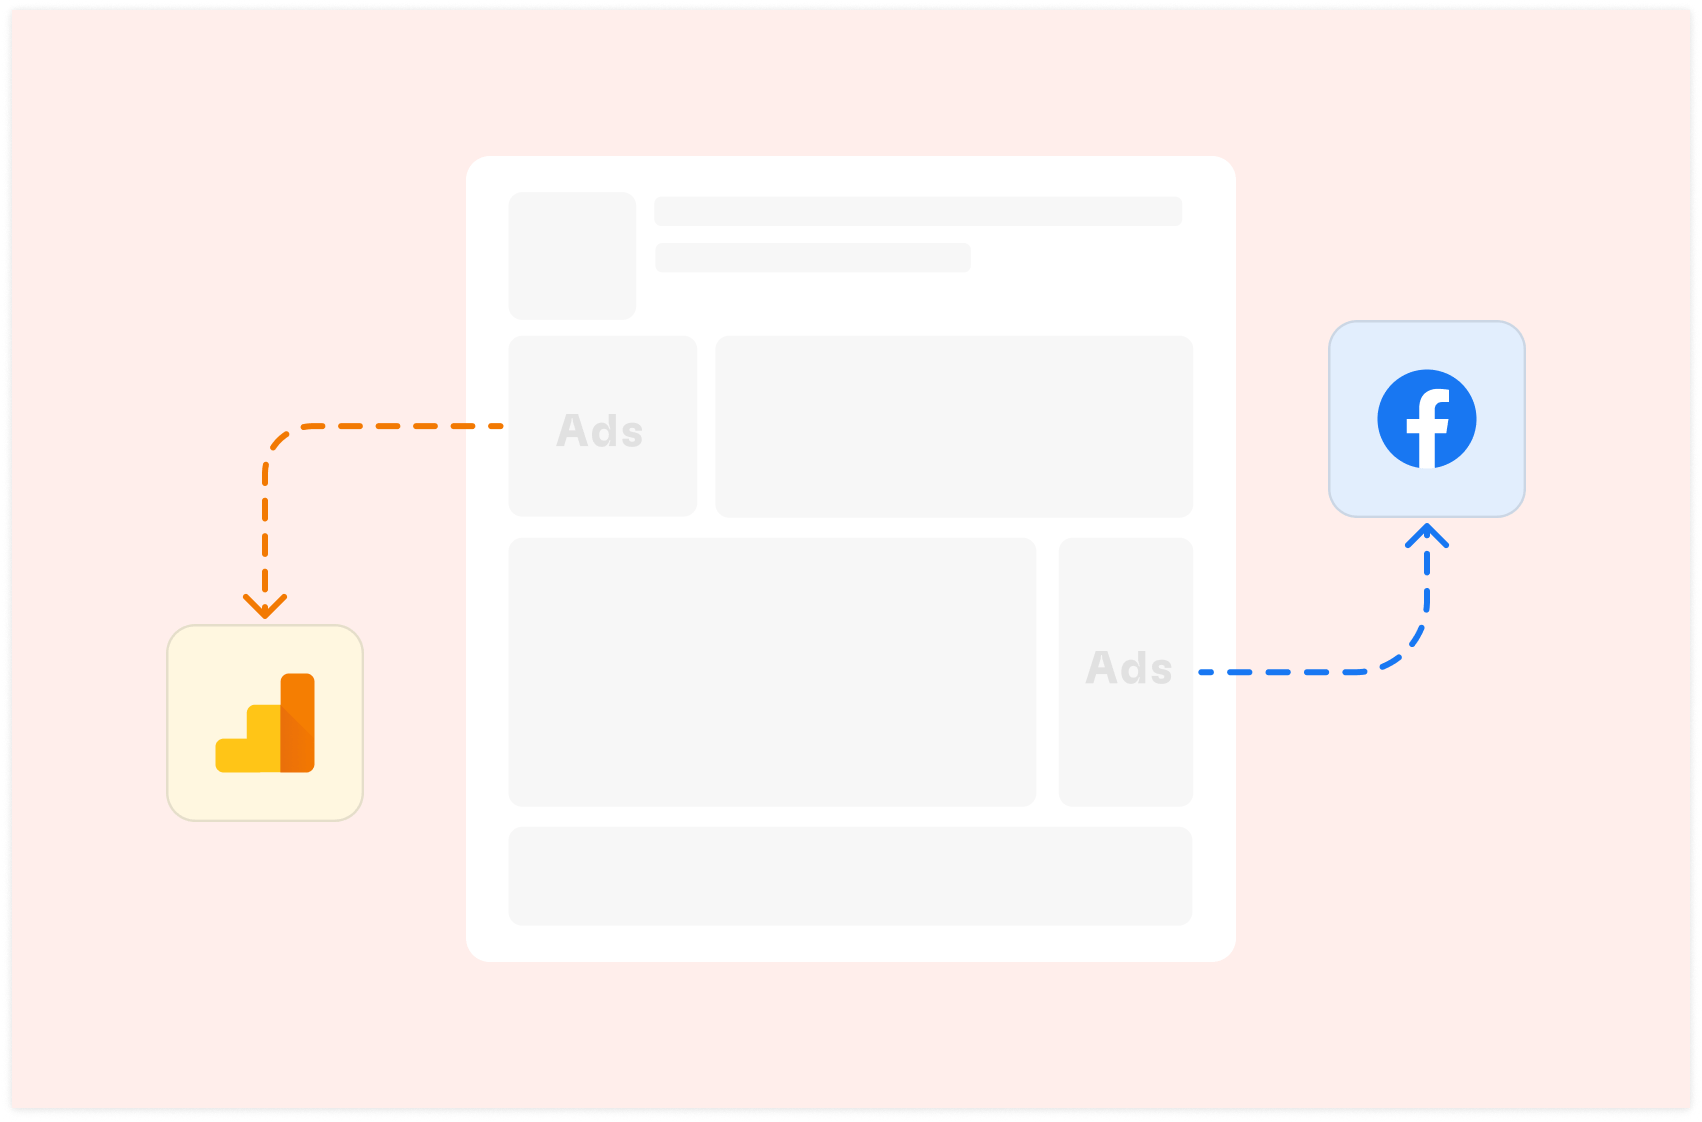
While being the gold standard for web analytics, many marketers have found themselves facing a challenge when using Google Analytics 4: GA4 doesn't provide a built-in way to distinguish between these two types of conversions.
This article aims to address this issue by presenting a practical solution that combines data from Google Search Console (GSC) and GA4 to approximate conversion events originating from branded and non-branded organic search traffic, ultimately helping you assessing the impact of your SEO efforts.

Your new AI Data Analyst
Extract from PDFs, import your business data, and analyze it using plain language.
Try Rows (no signup)Understanding Branded vs. Non-Branded Keywords
Before diving into the solution, it's essential to clearly define what I mean by branded and non-branded keywords.
Branded Keywords
Branded keywords include your company name, product names, and variations thereof. These are terms that are unique to your brand and that users would likely only search for if they were already aware of your company or products. For example:
If your company is "TechGadgets," branded keywords might include:
TechGadgets
Tech Gadgets store
TechGadgets smartwatch
TechGadget customer service
For a company like Nike, branded keywords could include:
Nike
Nike shoes
Air Jordan
Nike running gear
Non-Branded Keywords
Non-branded keywords are generic terms related to your products or services that don't include your brand name. These are terms that potential customers might use when searching for solutions in your industry, regardless of whether they're familiar with your brand. Examples include:
For "TechGadgets":
Best smartwatch
Affordable fitness tracker
Waterproof smartwatch
Smartwatch for athletes
For Nike:
Running shoes
Basketball sneakers
Athletic wear
Sports equipment
The Importance of Distinguishing Between the Two
Branded traffic typically comes from users already familiar with your brand. These users are often further along in the customer journey and may be more likely to convert. Non-branded traffic, on the other hand, often represents new potential customers discovering your website through generic searches. These users may require more nurturing before converting.
Understanding the balance between these two types of traffic and their respective conversion rates can provide valuable insights:
Brand Strength: A high volume of branded searches and conversions indicates strong brand awareness and loyalty.
SEO Effectiveness: Success in non-branded searches shows that your SEO efforts are effectively capturing new potential customers.
Customer Journey: By comparing conversion rates between branded and non-branded traffic, you can better understand how brand awareness impacts your sales funnel.
Resource Allocation: This data can help you decide where to focus your efforts – on building brand awareness or improving general SEO for non-branded terms.
The Problem with GA4
Google Analytics 4, while offering many advanced features and a more event-driven data model, does not provide a straightforward way to segment conversions based on branded vs. non-branded organic search traffic.
This limitation creates several challenges for marketers:
Incomplete Performance Assessment: Without being able to distinguish between branded and non-branded conversions, it's difficult to accurately assess the performance of brand awareness efforts separately from general SEO activities.
Difficulty in Strategy Evaluation: Marketers can't easily evaluate the effectiveness of their non-branded SEO strategies in driving conversions, as these are mixed with conversions from branded searches.
Inefficient Resource Allocation: as a result, without clear data on which type of traffic is driving more valuable conversions, it's challenging to make informed decisions about where to allocate marketing resources.
Limited Insight into Customer Journey: The inability to track how users move from non-branded to branded searches over time limits understanding of the customer journey.
Complications in Reporting: When reporting to stakeholders, the lack of distinction between these two types of conversions can lead to misinterpretations of marketing effectiveness.
The Solution: Combining GSC and GA4 Data

To overcome the limitations of GA4 in distinguishing between branded and non-branded conversions, we've developed the Branded Vs Non-Branded Conversion report, a template that combines live data from Google Search Console and GA4. This solution allows you to approximate the number of conversion events coming from branded and non-branded organic search traffic.
Here's the logic behind the template.
Step 1: Breakdown of Branded vs. Non-Branded Traffic
In this first step, I prepare the data from Google Search Console:
I retrieve data from Google Search Console and create a query-page report (not available in the original platform) that list all the queries that drove traffic to each page.
I employ basic spreadsheet syntax to add a column that classify each query, by returning 'branded' if the keyword contains your brand name, 'non-branded' otherwise.
I added another column that uses Rows proprietary formula to extract the relative path of any of the page URL, to make it compatible with data in GA4
Step 2: GA4 Event Data Extraction
In the second step, I prepare the data from GA4:
I pull event data from GA4, broken down by landing pages.
I filter for specific conversion events (e.g. 'purchase', 'lead_form_submit', etc.).
I ensure to include only organic search traffic, by setting an additional filter: 'First user default channel group' equals to 'Organic Search'
Step 3: Applying Traffic Shares to Conversion Events
In the third step, I combine the two datasets built at the previous steps and prepare the estimators.
I combine the categorization built in Step 1 with the data in Step 2 to compute the number of branded and unbranded clicks generated through search traffic for each page.
To compute the number of branded vs non-branded clicks, I use SUMIFS in the GA4 table and use the respective relative path and keyword category as filter, e.g. page equals to 'XYZ' and keyword is 'branded'.
I compute the respective percentage shares
I apply these shares to the conversion events data from step 2.
This provides an approximation of how many conversions came from branded vs. non-branded searches.
How the Branded vs Non-Branded Conversion Report works
Now, let's go through the Branded Vs Non-Branded Conversion report itself and examine the main components:
The Setup table

Use the Setup table to:
Pick a date range for your analysis
Input your brand name to filter for branded keyword.
Here, please make sure that potential truncation errors might still be considered branded intent, e.g. Rows is often searched as 'Row'. So for us to properly filter for branded traffic, I should include the word 'row'.
At the same time, the field allows for only one formulation, so potential other misspelling errors, e.g. 'Rose', won't be filtered out
Input the exact name of the event you want to track. Make sure not to include wrong characters or space, e.g. 'sign_up' or 'first_form_filled'
GSC and GA4 data tables
The Data Tables in pages 2 and 3 will automatically update with fresh live data from Google Search Console and Google Analytics 4.
The 'Search traffic: Query-Page' table displays all query-page combination ordered by number of clicks.

The table includes a formula column 'Classification' that checks whether the query includes the brand name inputted in the Setup table, as follows:
=IF(IFERROR(SEARCH('Input'!$B$2,A2),0)=0,"non-branded","branded")
and a column that extracts the relative url of each page's URL with the following proprietary syntax:
=RELATIVE_URL(B2)
The 'Events by Landing Page' table breaks down the number of events by landing page.

On the same table, I added five formula columns that respectively:
sum the branded traffic by landing page (via SUMIFS)
sum the non-branded traffic by landing page (via SUMIFS)
compute the respective ratios
applies the ratios to the number of event per page
Pro tip 💡
Rows lets you pull and aggregate live data from 50+ sources, thanks to built-in data integrations in various domains:
- Marketing: GA4, GSC, Facebook, Instagram, TikTok, ...
- Productivity software: OpenAI, Notion, Slack, Email, Translate, ...
- Data Warehouse: MySQL, BigQuery, PostgreSQL, Snowflake, Amazon Redshift Additionally, if the source you want to pull data from is not in our catalog, you can create custom connections via our HTTP functions: GET, POST, PUT, PATCH, which makes the catalog of integrable tools virtually infinite.
The Report page

The Report page includes:
Stacked bar chart that display the top 10 pages by event (both branded and non-branded)
Stacked bar chart that display the top 10 pages by event generated by branded traffic
Stacked bar chart that display the top 10 pages by event generated by non-branded traffic
Respective tables that extract the top pages from the 'Events by Landing Page' using basic SQL language.
Interpreting and Using the Results
Now that you have estimates for branded and non-branded conversions, you can use this data to inform your marketing strategies:
Evaluate Brand Strength: If a large portion of your conversions come from branded searches, it indicates strong brand awareness and loyalty. This might suggest focusing on customer retention and upselling strategies.
Assess SEO Effectiveness: A high number of non-branded conversions suggests your SEO efforts are successfully attracting and converting new customers. This might indicate an opportunity to further expand your non-branded keyword targeting.
Optimize Landing Pages: Look at which pages have the highest conversion rates for branded and non-branded traffic. Use these insights to optimize other pages accordingly.
Refine Content Strategy: If certain types of content are driving more non-branded conversions, consider creating more similar content to capture additional non-branded traffic.
Adjust PPC Strategies: Use the insights to inform your paid search strategies. You might bid differently on branded vs. non-branded keywords based on their respective conversion rates.
Track Over Time: Monitor how the balance between branded and non-branded conversions changes over time. This can help you assess the long-term impact of your branding efforts.

Your new AI Data Analyst
Extract from PDFs, import your business data, and analyze it using plain language.
Try Rows (no signup)Limitations and Considerations
While this method provides valuable insights, it's important to keep a few limitations in mind:
Approximation: This method provides an estimate, not an exact count of branded vs. non-branded conversions. If the ultimate conversion rate, for that specific event, would differ substantially by the user search intent, the final estimate would turn out to be misleading.
Data Discrepancies: GSC and GA4 data don't always align perfectly, which can affect the accuracy of the results.
Complex Customer Journeys: This method doesn't account for users who might use both branded and non-branded searches in their journey to conversion.
Conclusion
While GA4 doesn't provide a built-in way to distinguish between branded and non-branded conversions, the Rows template outlined in this article offers a practical workaround. By combining data from Google Search Console and GA4, marketers can gain valuable insights into the performance of their branded and non-branded organic search efforts.
This approach allows for more informed decision-making in SEO and marketing strategies, helping to optimize resource allocation between brand-building and general SEO activities. As with any data analysis, it's important to use these insights as part of a broader analytical approach, taking into account other relevant metrics and business goals.
To know more about how Rows can help marketers make sense of web analytics data, have a look to the following articles:

