
TikTok Ads Dashboard
Get a comprehensive report of your TikTok Ads campaigns, focus on spending and objectives and determine the ROI of your marketing investment.
 100% spreadsheet
 Connected to your data
 Daily+ refresh
 Embed everywhere
About TikTok Ads Dashboard
Introduction to the TikTok Ads Dashboard
Our TikTok Ads Dashboard template is designed to provide comprehensive insights into your TikTok ad campaigns. This powerful tool aggregates crucial data points to help you track and optimize your advertising performance. With features like a weekly performance summary, adgroup performance breakdown, spending by objective, and demographic analysis, this dashboard offers everything you need to make informed decisions about your TikTok advertising strategy.
Key Components of the TikTok Ads Dashboard
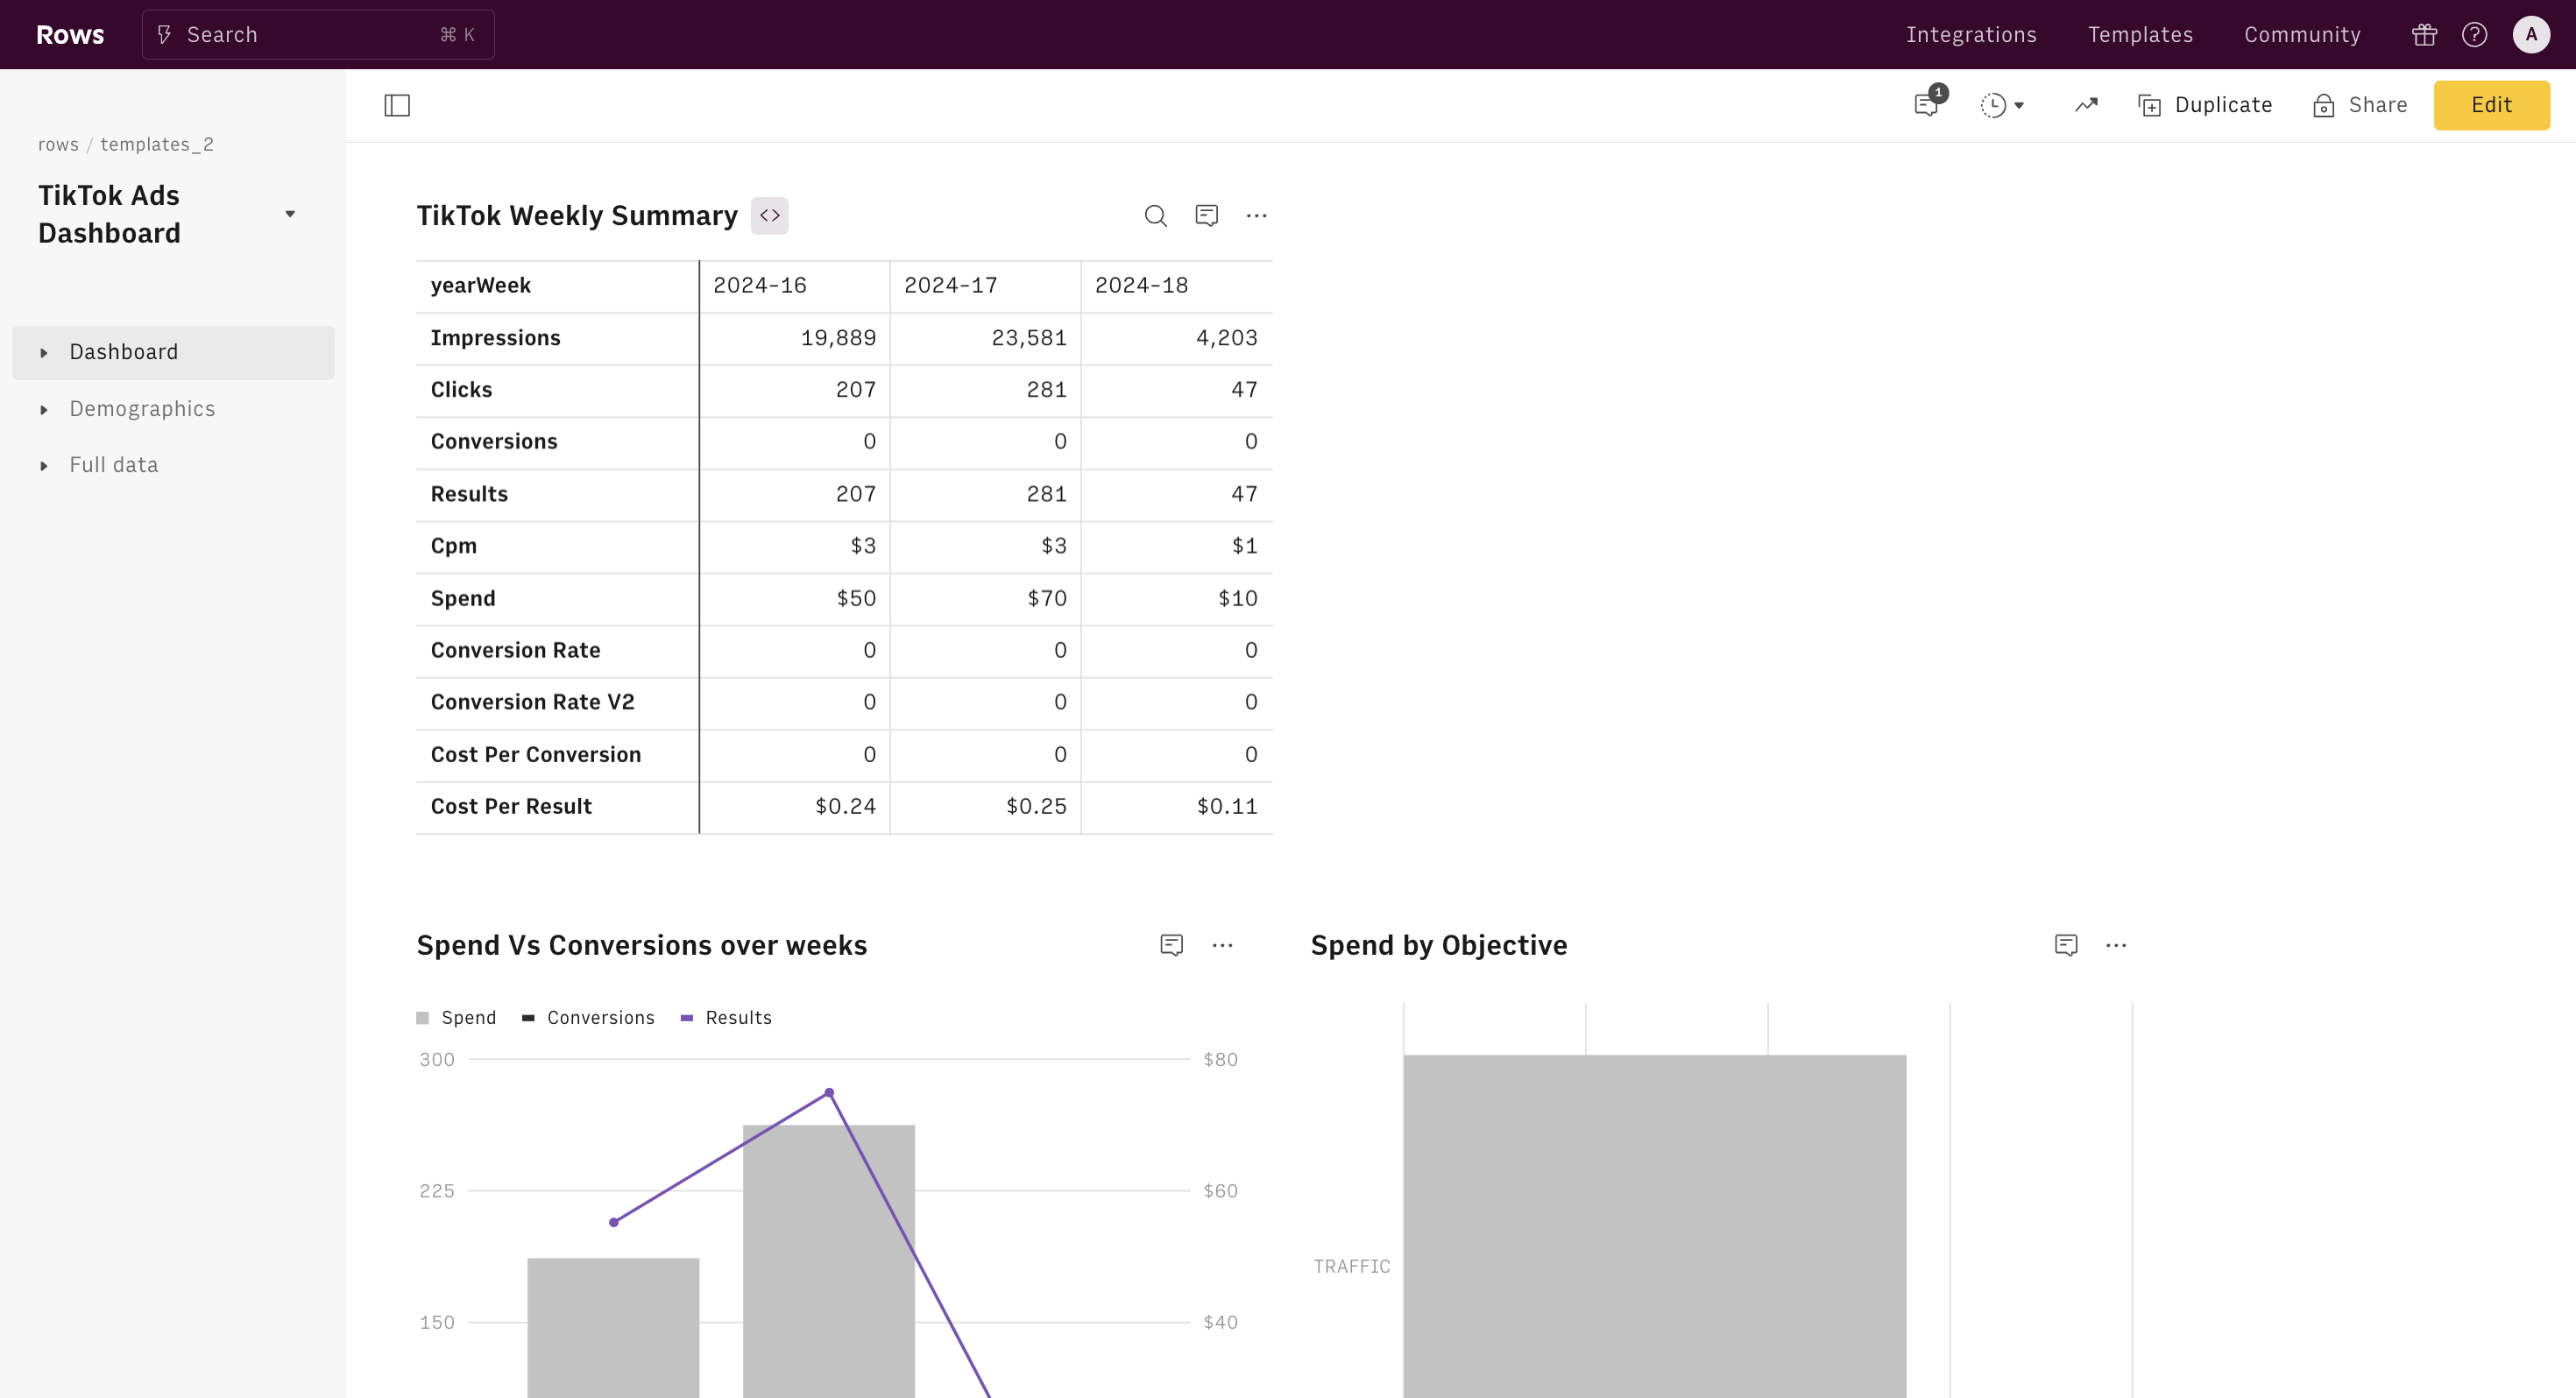
Weekly Performance Summary
Stay on top of your campaigns with our detailed weekly performance summary. Monitor key metrics including impressions, spend, leads, purchases, cost per lead, and cost per order. Each week's data is clearly labeled by Year-Week to provide a chronological view of your campaign's progress.
Adgroup Performance Summary
Analyze the effectiveness of your ad groups with our adgroup performance summary. Track metrics such as campaign name, clicks, CPC, CPM, CPP, CTR, reach, spend, leads, purchases, cost per order, cost per lead, and ROAS. This section helps you identify high-performing campaigns and areas for improvement.
Spending by Objective Breakdown
Understand where your budget is going with a detailed breakdown of spending by objective. This insight allows you to allocate your resources more effectively and ensure you're investing in the right areas to meet your advertising goals.
Conversions vs. Spend Chart
Visualize the relationship between your spend and conversions with our easy-to-read chart. This feature helps you quickly identify trends and make data-driven decisions to maximize your ROI.
Demographics Breakdown
Gain a deeper understanding of your audience with our demographics breakdown. Analyze your audience by age, interest, gender, and country to tailor your campaigns to the right demographics and improve your targeting strategies.
How to Use the TikTok Ads Dashboard
Using our TikTok Ads Dashboard is simple and straightforward. Follow the instructions in the panel to connect your integration account. Once connected, the dashboard will automatically fetch and update your data, providing real-time insights into your TikTok ad campaigns. This automated process saves you time and ensures you always have the most current data at your fingertips.
Importance of Monitoring Key Metrics
Monitoring the key metrics included in the TikTok Ads Dashboard is crucial for optimizing your advertising strategy. By regularly reviewing these metrics, you can identify trends, measure the effectiveness of your campaigns, and make data-driven decisions to enhance your ROI. The dashboard's comprehensive data presentation allows you to stay informed and agile in your advertising efforts.
Practical Use Cases and Beneficiaries
The TikTok Ads Dashboard is ideal for digital marketers, advertising agencies, and businesses of all sizes looking to maximize their TikTok ad performance. Whether you're running a small business or managing large-scale campaigns, this template provides the insights needed to optimize your ad spend and achieve your marketing goals. Social media managers, performance marketers, and data analysts will particularly benefit from the detailed breakdowns and visualizations offered by the dashboard.
How it works


How it works
Get started
Click on 'Use template' and start using it right away. No forms, no signup. Your data first.
Connect your TikTok account
Once landed on the spreadsheet, follow the instructions to connect the required integration and pick your account.
Customize the template and schedule refresh
Once the integration has been connected, all tables will update automatically with your own data. Click on 'Edit Source' to change the retrieved data and automate the data refresh. You can then insert a chart or a pivot table, add a column or personalize formats, using all the regular functions and shortcuts that make spreadsheets great.
Embed tables and charts
Click on the option menu to embed tables and chart on your Notion, Confluence or any other iframe-ready documents.


Questions and answers
Can I use Rows for free?
More than a TikTok Ads Dashboard
Rows is your new AI Data Analyst. It lets you extract from PDFs, import your business data, and analyze it using plain language.
Signup for free

Import your business data
Extract from PDFs and images, import from files, marketing tools, databases, APIs, and other 3rd-party connectors.
Know moreAnalyze it with AI
Ask AI✨ any question about your dataset - from VLOOKUPs to forecasting models - and surface key insights, trends, and patterns.
Know moreCollaborate and Share
Seamlessly collaborate and share stunning reports with dynamic charts, embed options, and easy export features.
Know more