LinkedIn Page Analytics Dashboard
Discover key insights about your LinkedIn Page and posts, such as engagement, impressions, and followers growth.

 100% spreadsheet
 Connected to your data
 Daily+ refresh
 Embed everywhere
About LinkedIn Page Analytics Dashboard
Introduction to the LinkedIn Page Analytics Dashboard
The LinkedIn Page Analytics Dashboard is your ultimate LinkedIn profile analytics tool designed to provide comprehensive insights into your LinkedIn Company Page. This template helps you monitor and analyze key performance indicators (KPIs), making it an indispensable LinkedIn page analyzer. Whether you're a marketer, social media manager, or business owner, this dashboard simplifies the process of understanding and leveraging your LinkedIn data.
Main Components of the Dashboard
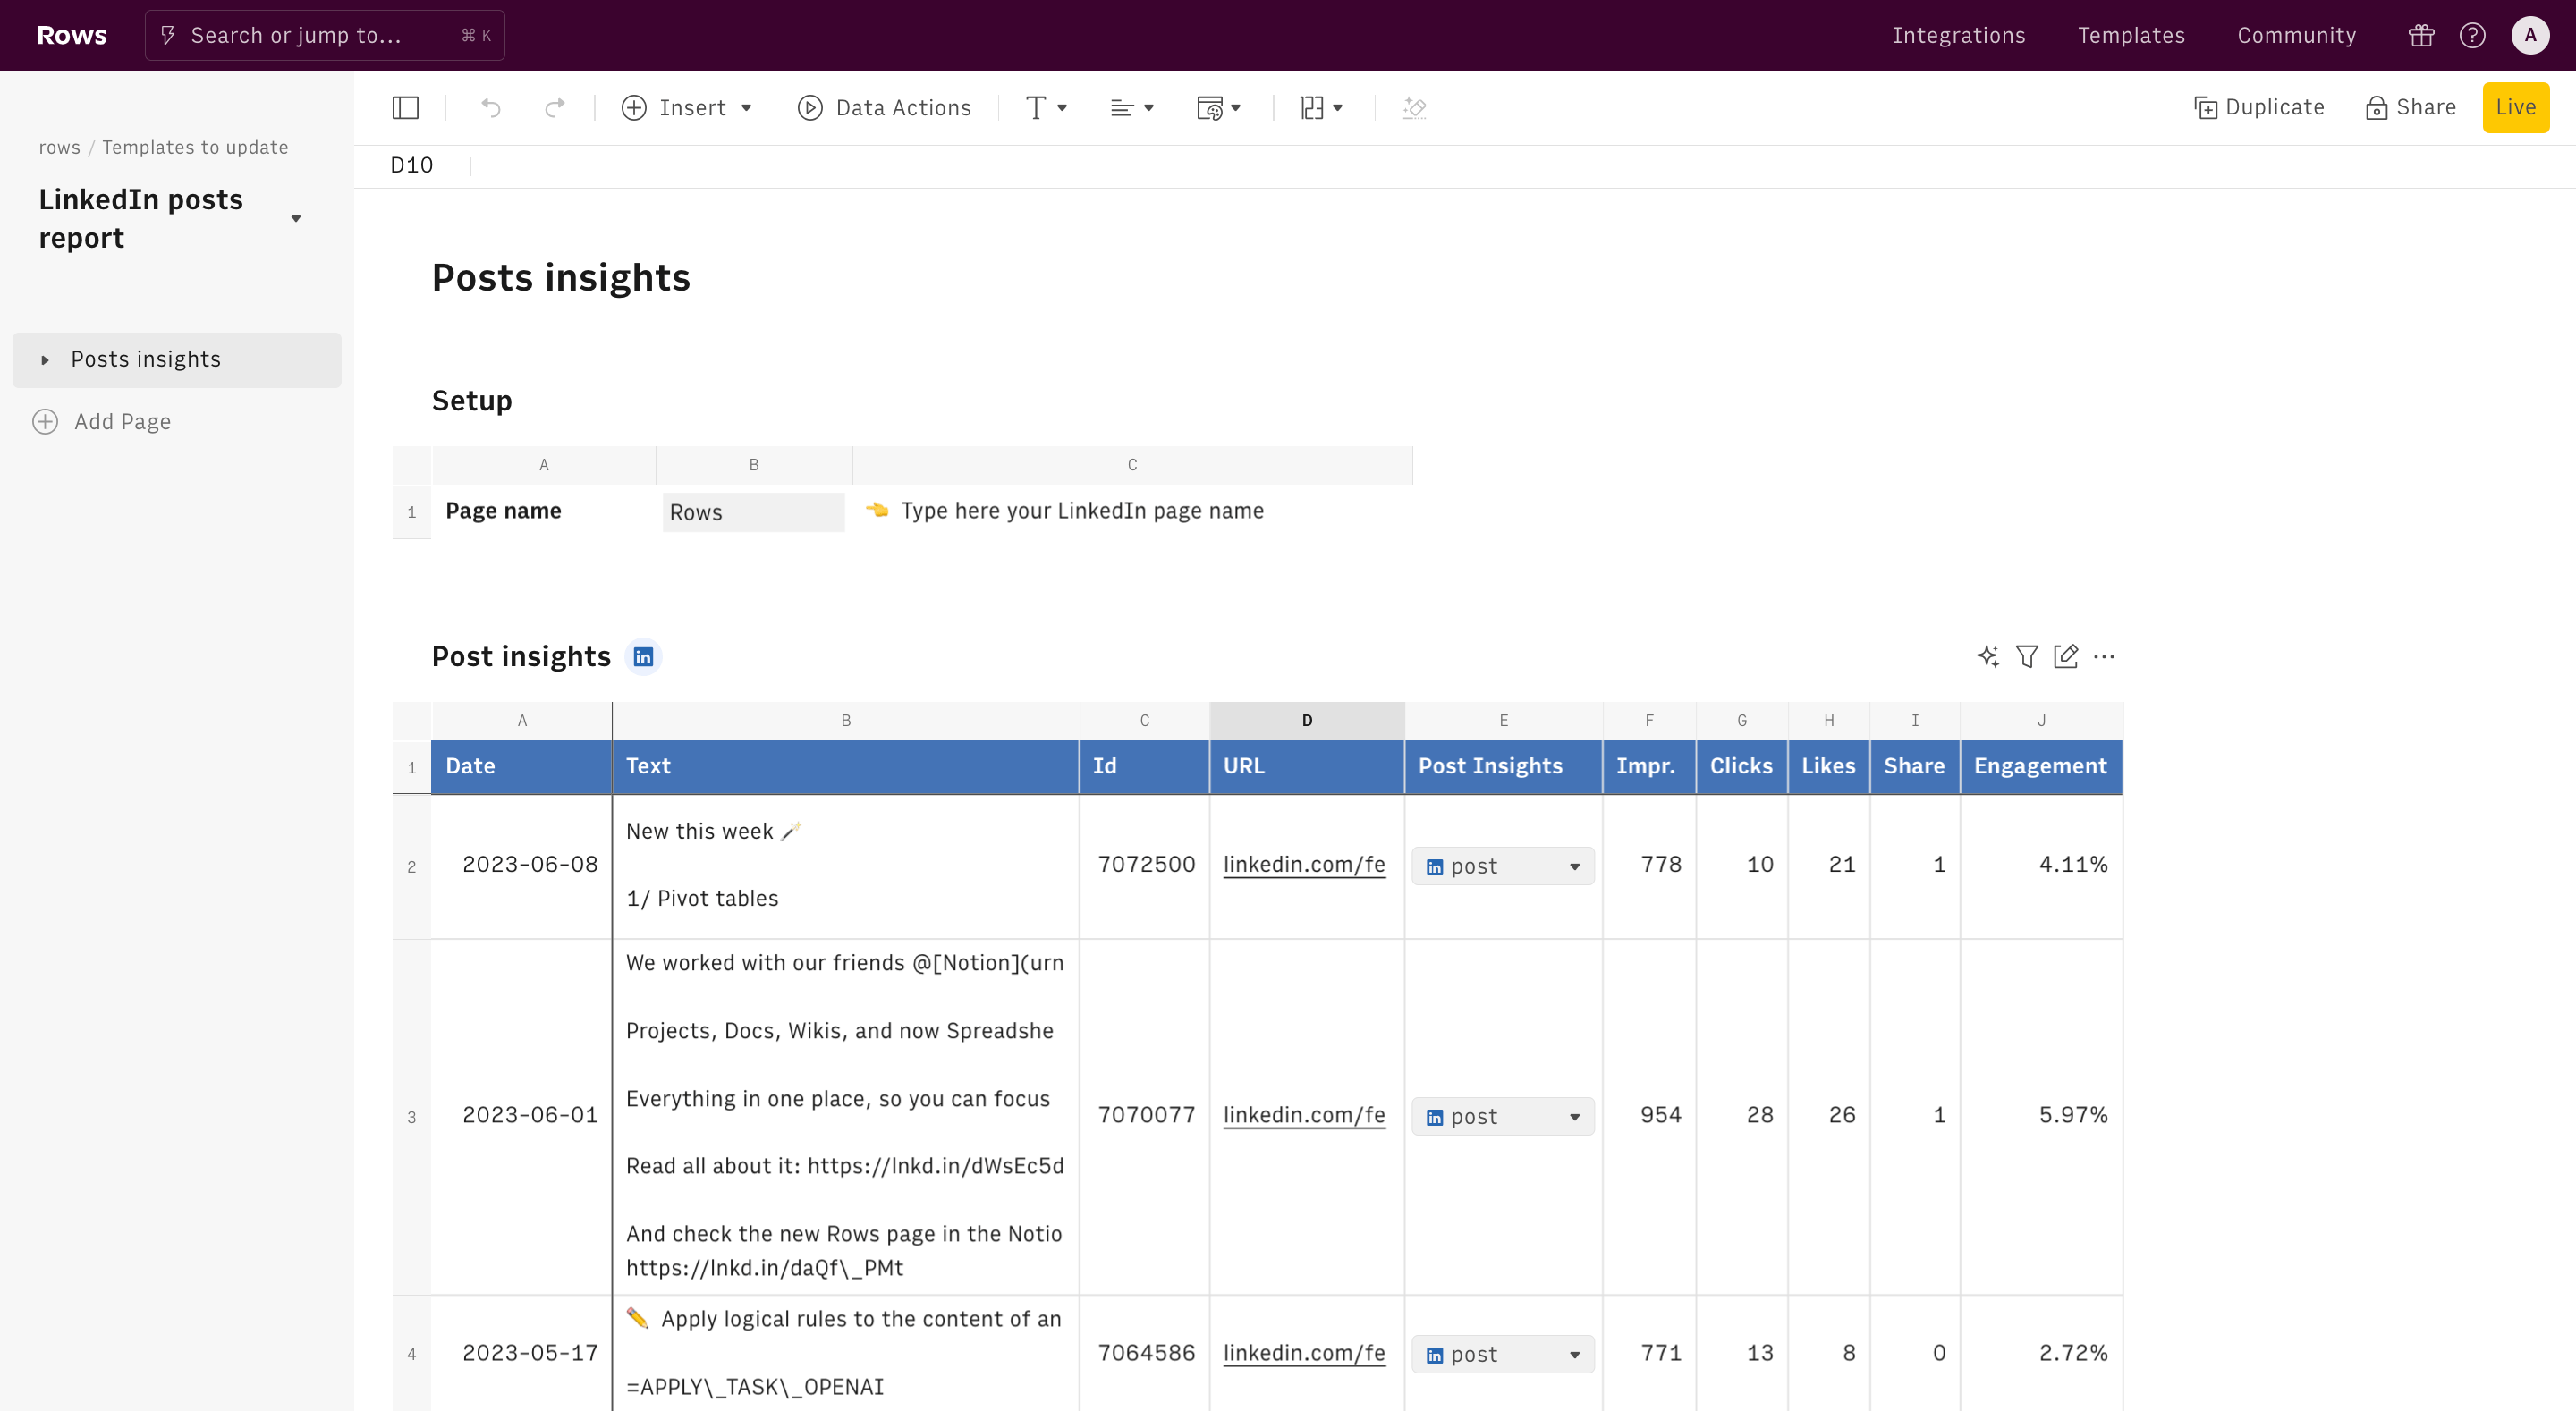
Our LinkedIn Page Analytics Dashboard includes:
- A summary of the top KPIs from all your posts.
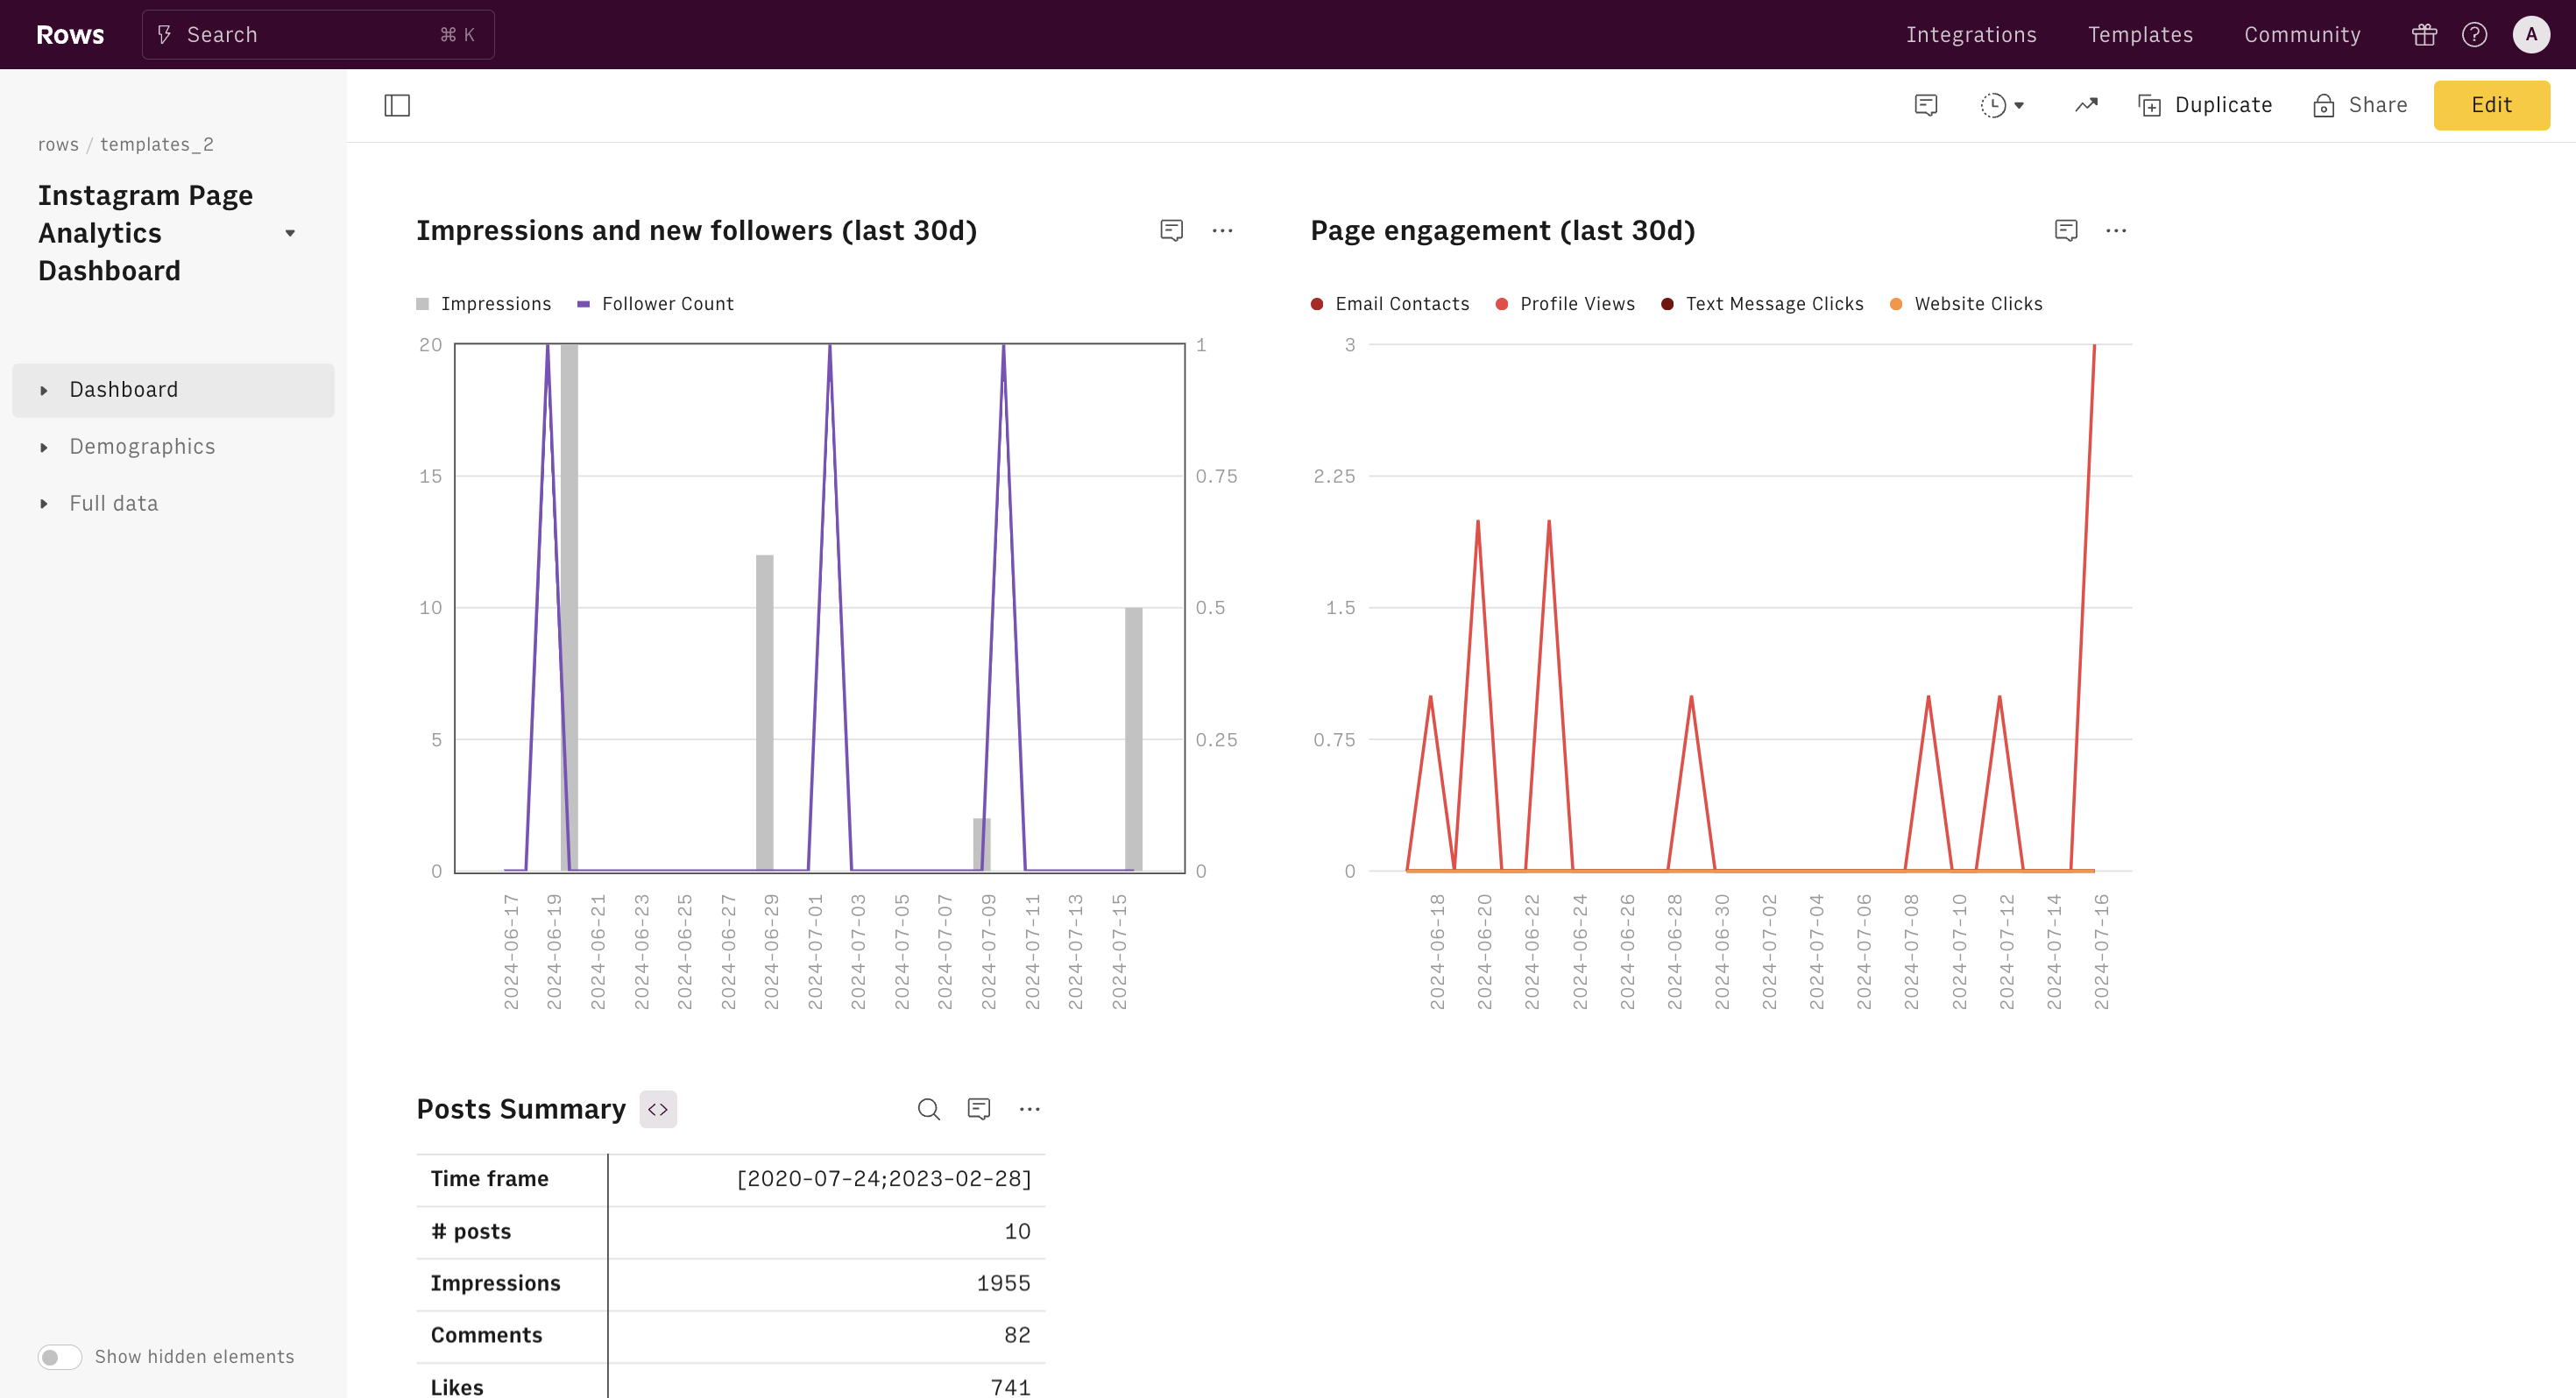
- A chart displaying Page views by device.
- A weekly breakdown with the chart of posts per week.
- Insights into your audience growth with the Total followers gained chart, split into organic and paid.
- Highlights of your best content with the Top 5 Posts by Impressions.
- Quick access to your most recent activity with the Last 5 posts.
How to Use This Template
Using this LinkedIn profile analytics tool is straightforward. Simply follow the instructions in the panel to connect your integration account. Once connected, the data will automatically get fetched and displayed in the dashboard. This seamless integration ensures that you have real-time access to your LinkedIn page analytics free of hassle.
Importance of Monitoring Key Metrics
Monitoring key metrics on your LinkedIn Page is crucial for understanding your audience and optimizing your content strategy. This social media analytics tool helps you track the performance of your posts, understand your audience's behavior, and make data-driven decisions. The LinkedIn Page Analytics Dashboard is not just a LinkedIn analyzer; it’s a vital resource for anyone looking to improve their social media presence and engagement.
Practical Use Cases and Beneficiaries
This LinkedIn analysis tool is perfect for:
- Marketers aiming to improve their content strategy and increase engagement.
- Social media managers needing comprehensive LinkedIn reports.
- Business owners looking to understand their audience and increase impressions on LinkedIn.
- Analysts who need a robust social media analytics report template for presentations and strategy planning.
With this LinkedIn Page Analytics Dashboard, you gain access to powerful social media analytics examples that highlight the importance of monitoring your performance. The integration with the LinkedIn analytics API ensures that you always have up-to-date information to make informed decisions.
Harness the power of your LinkedIn data with our LinkedIn page analyzer and transform the way you understand and interact with your audience.
How it works


How it works
Get started
Click on 'Use template' and start using it right away. No forms, no signup. Your data first.
Connect your LinkedIn Page
Once landed on the spreadsheet, follow the instructions to connect the required integration and pick your account.
Customize the template and schedule refresh
Once the integration has been connected, all tables will update automatically with your own data. Click on 'Edit Source' to change the retrieved data and automate the data refresh. You can then insert a chart or a pivot table, add a column or personalize formats, using all the regular functions and shortcuts that make spreadsheets great.
Embed tables and charts
Click on the option menu to embed tables and chart on your Notion, Confluence or any other iframe-ready documents.


Questions and answers
Is LinkedIn Page Analytics free?
More than a LinkedIn Page Analytics Dashboard
Rows is your new AI Data Analyst. It lets you extract from PDFs, import your business data, and analyze it using plain language.
Signup for free

Import your business data
Extract from PDFs and images, import from files, marketing tools, databases, APIs, and other 3rd-party connectors.
Know moreAnalyze it with AI
Ask AI✨ any question about your dataset - from VLOOKUPs to forecasting models - and surface key insights, trends, and patterns.
Know moreCollaborate and Share
Seamlessly collaborate and share stunning reports with dynamic charts, embed options, and easy export features.
Know more