Instagram Page Analytics Dashboard
Discover key insights about your Instagram page and posts, such as engagement, impressions, and followers growth.
 100% spreadsheet
 Connected to your data
 Daily+ refresh
 Embed everywhere
About Instagram Page Analytics Dashboard
The Instagram Page Analytics Dashboard unlocks deep insights into your Instagram performance. This comprehensive template provides full data from the last 30 days, empowering you with detailed analytics and visualizations to optimize your social media strategy.
Key Dashboard Components
The Instagram Page Analytics Dashboard include the following main components:
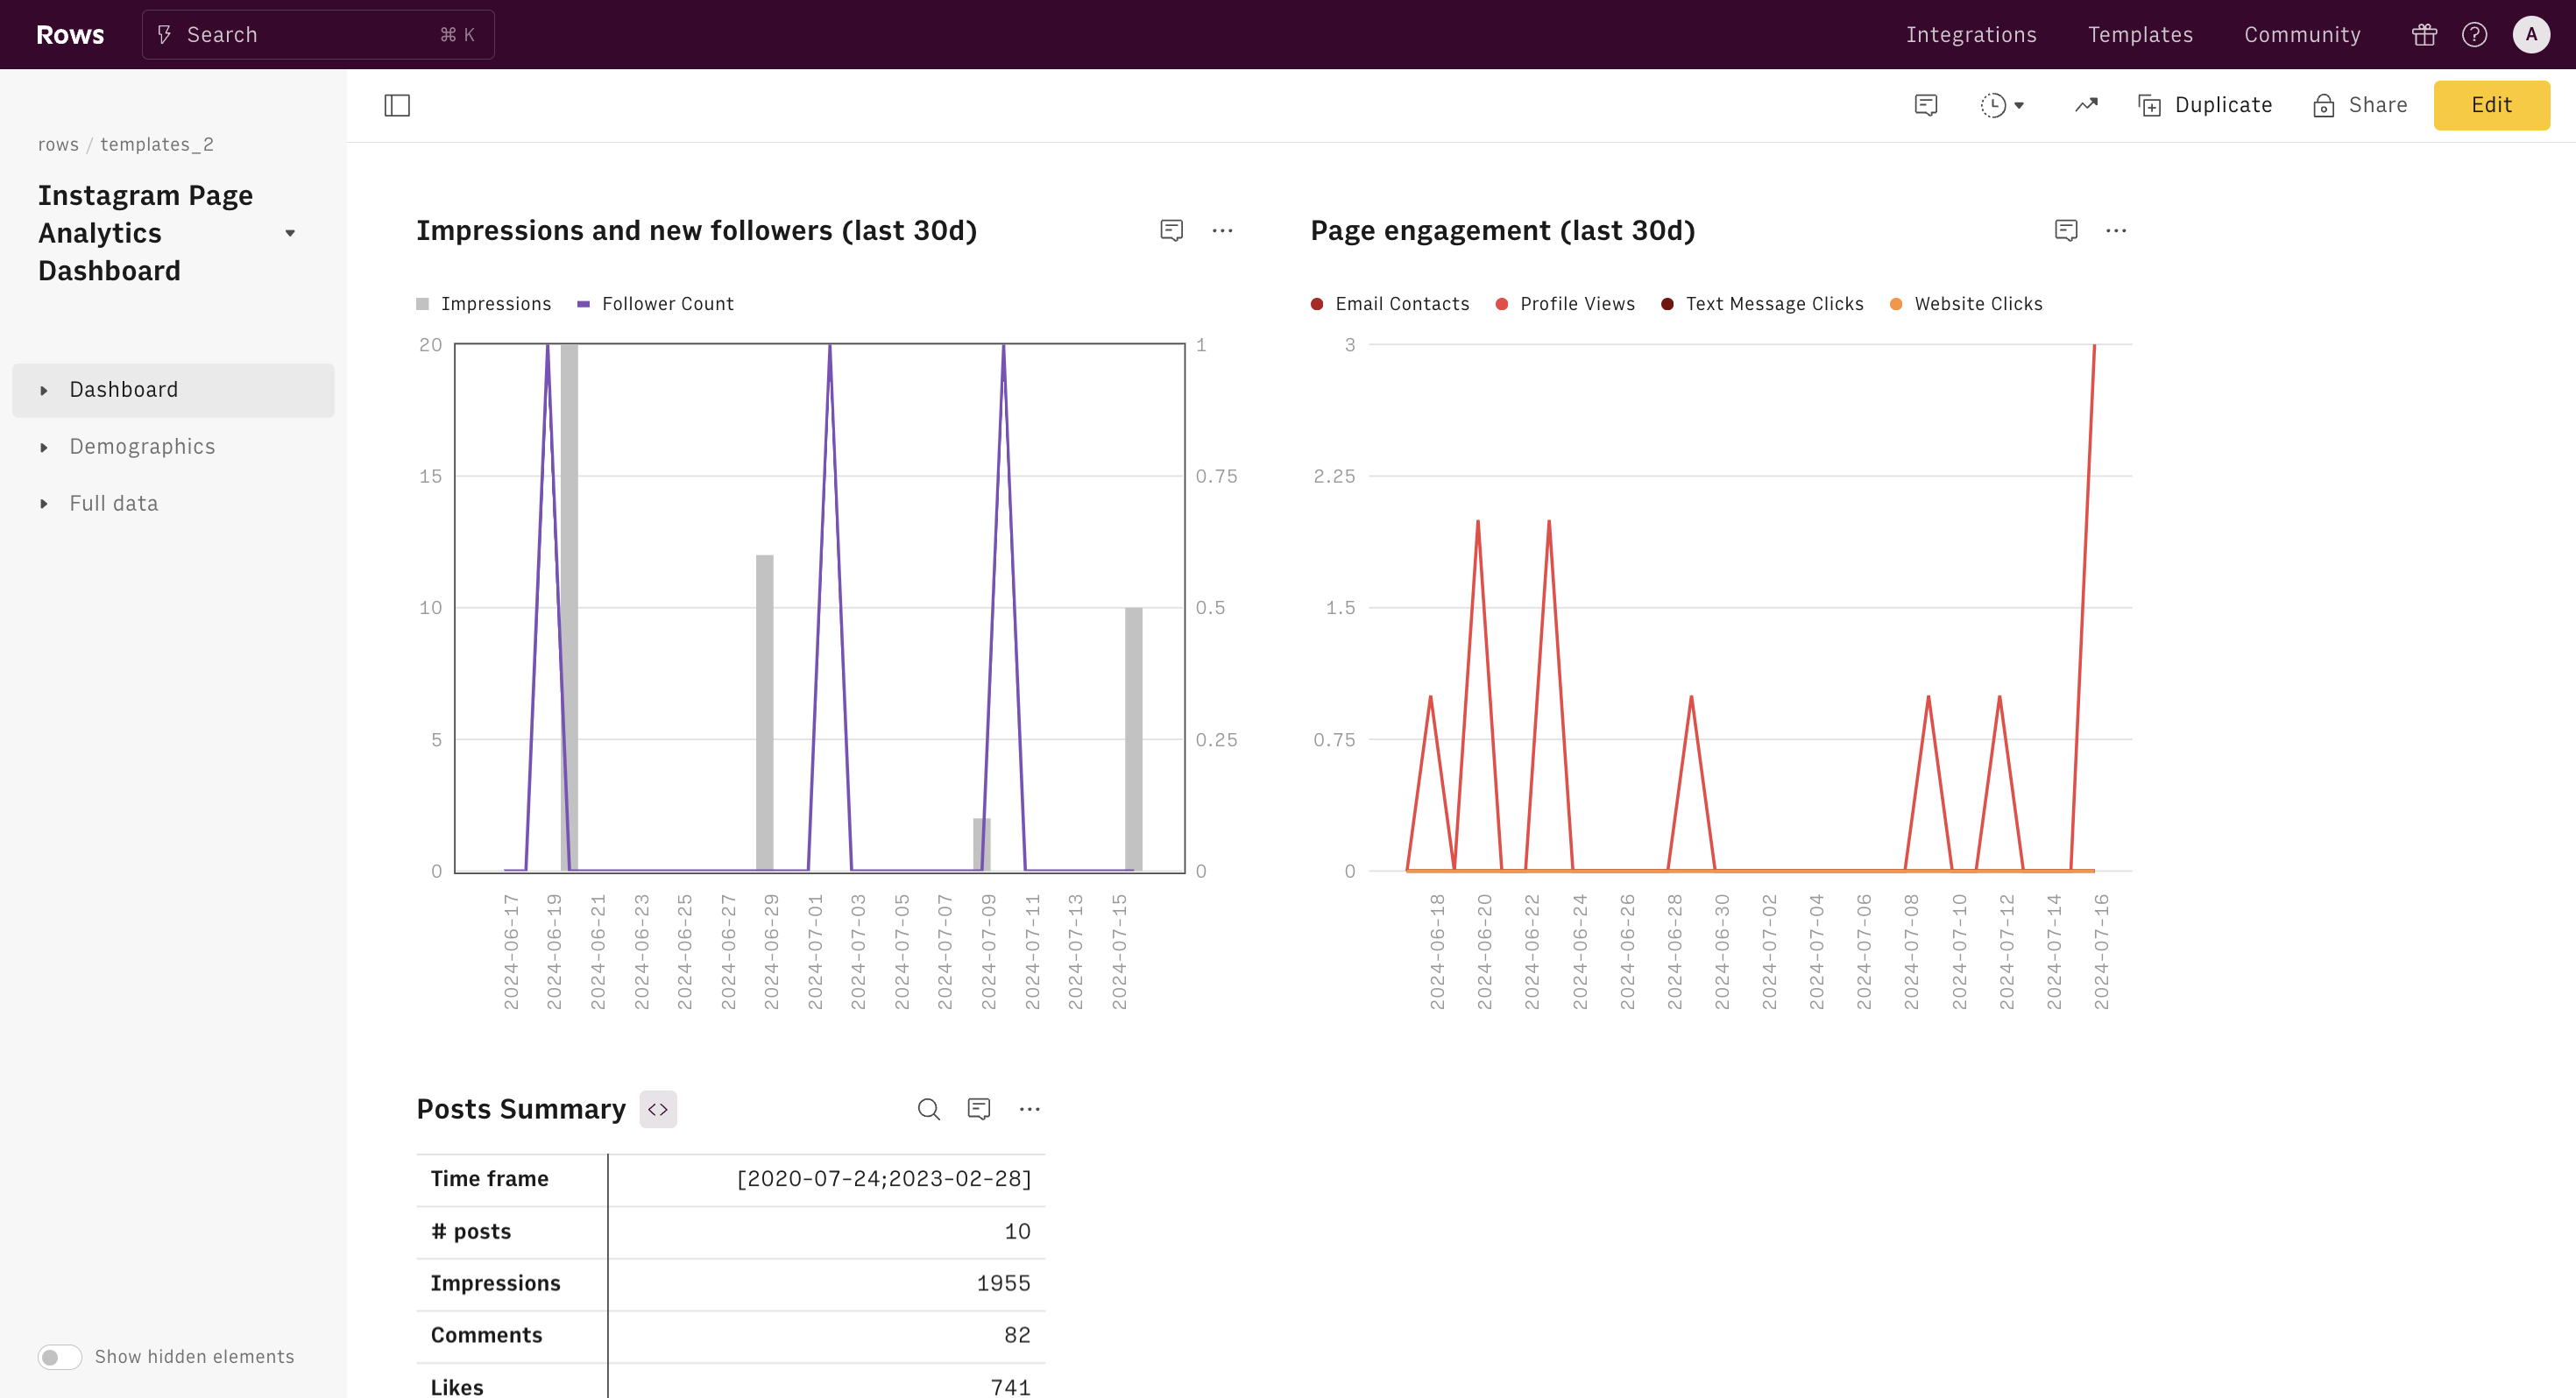
Daily Performance Charts: Track your Instagram growth with daily charts showing impressions and new followers. Understand how your content resonates with your audience and adjust your strategy accordingly.
Engagement Over Time: Monitor overall page engagement through a dynamic chart that includes email contacts, profile views, text message clicks, and website clicks. This helps you pinpoint peak interaction times and refine your engagement tactics.
Post Insights: Gain a summary of your last posts, detailing impressions, comments, likes, and new followers. Stay informed about which posts are driving the most engagement and which need improvement.
Top Performing Posts: Easily identify your most impactful content with a table showcasing the top 5 most liked posts. Leverage this information to replicate successful content strategies.
Recent Posts: Stay up-to-date with a table of your 5 most recent posts, enabling you to track their performance in real-time.
Demographics Breakdown: Understand your audience better with detailed demographics, including age, gender, country, and city breakdowns. Tailor your content to meet the preferences of your diverse audience.
Post Performance Chart: Analyze individual post performance to see how each piece of content contributes to your overall growth and engagement.
Practical Use Cases and Ideal Persona
This Instagram Page Analytics Dashboard is perfect for social media managers, digital marketers, and influencers who want to maximize their Instagram presence. By providing actionable insights and visual representations of key metrics, this template helps you:
- Optimize Content Strategy: Identify what works and what doesn’t, enabling you to create more engaging and effective content.
- Increase Engagement: Understand the best times to post and the type of content that drives interaction, boosting your overall engagement.
- Target Audience Better: Use demographics data to tailor your content to your audience's preferences, enhancing your reach and relevance.
- Track Growth: Monitor your follower growth and engagement trends over time, ensuring your strategy is on the right track.
Whether you're a seasoned marketer or just starting out, this dashboard equips you with the insights you need to elevate your Instagram game and achieve your social media goals.
How it works


How it works
Get started
Click on 'Use template' and start using it right away. No forms, no signup. Your data first.
Connect your Facebook Ads account
Once landed on the spreadsheet, follow the instructions to connect the required integration and pick your account.
Customize the template and schedule refresh
Once the integration has been connected, all tables will update automatically with your own data. Click on 'Edit Source' to change the retrieved data and automate the data refresh. You can then insert a chart or a pivot table, add a column or personalize formats, using all the regular functions and shortcuts that make spreadsheets great.
Embed tables and charts
Click on the option menu to embed tables and chart on your Notion, Confluence or any other iframe-ready documents.


Questions and answers
Can I use Rows for free?
More than an Instagram Page Analytics Dashboard
Rows is your new AI Data Analyst. It lets you extract from PDFs, import your business data, and analyze it using plain language.
Signup for free

Import your business data
Extract from PDFs and images, import from files, marketing tools, databases, APIs, and other 3rd-party connectors.
Know moreAnalyze it with AI
Ask AI✨ any question about your dataset - from VLOOKUPs to forecasting models - and surface key insights, trends, and patterns.
Know moreCollaborate and Share
Seamlessly collaborate and share stunning reports with dynamic charts, embed options, and easy export features.
Know more