Google Analytics 4 Country Report
Get a breakdown of your website users by country.

 100% spreadsheet
 Connected to your data
 Daily+ refresh
 Embed everywhere
About Google Analytics 4 Country Report
The Google Analytics 4 Country Report is your got-to template for quick, insightful analysis of your website's international audience. Designed with precision and ease of use in mind, this template offers a comprehensive breakdown of your total traffic by country. Whether you're a digital marketer, business owner, or data analyst, our report helps you understand where your visitors are coming from, enabling you to tailor your strategies and enhance your global reach.
Key Features
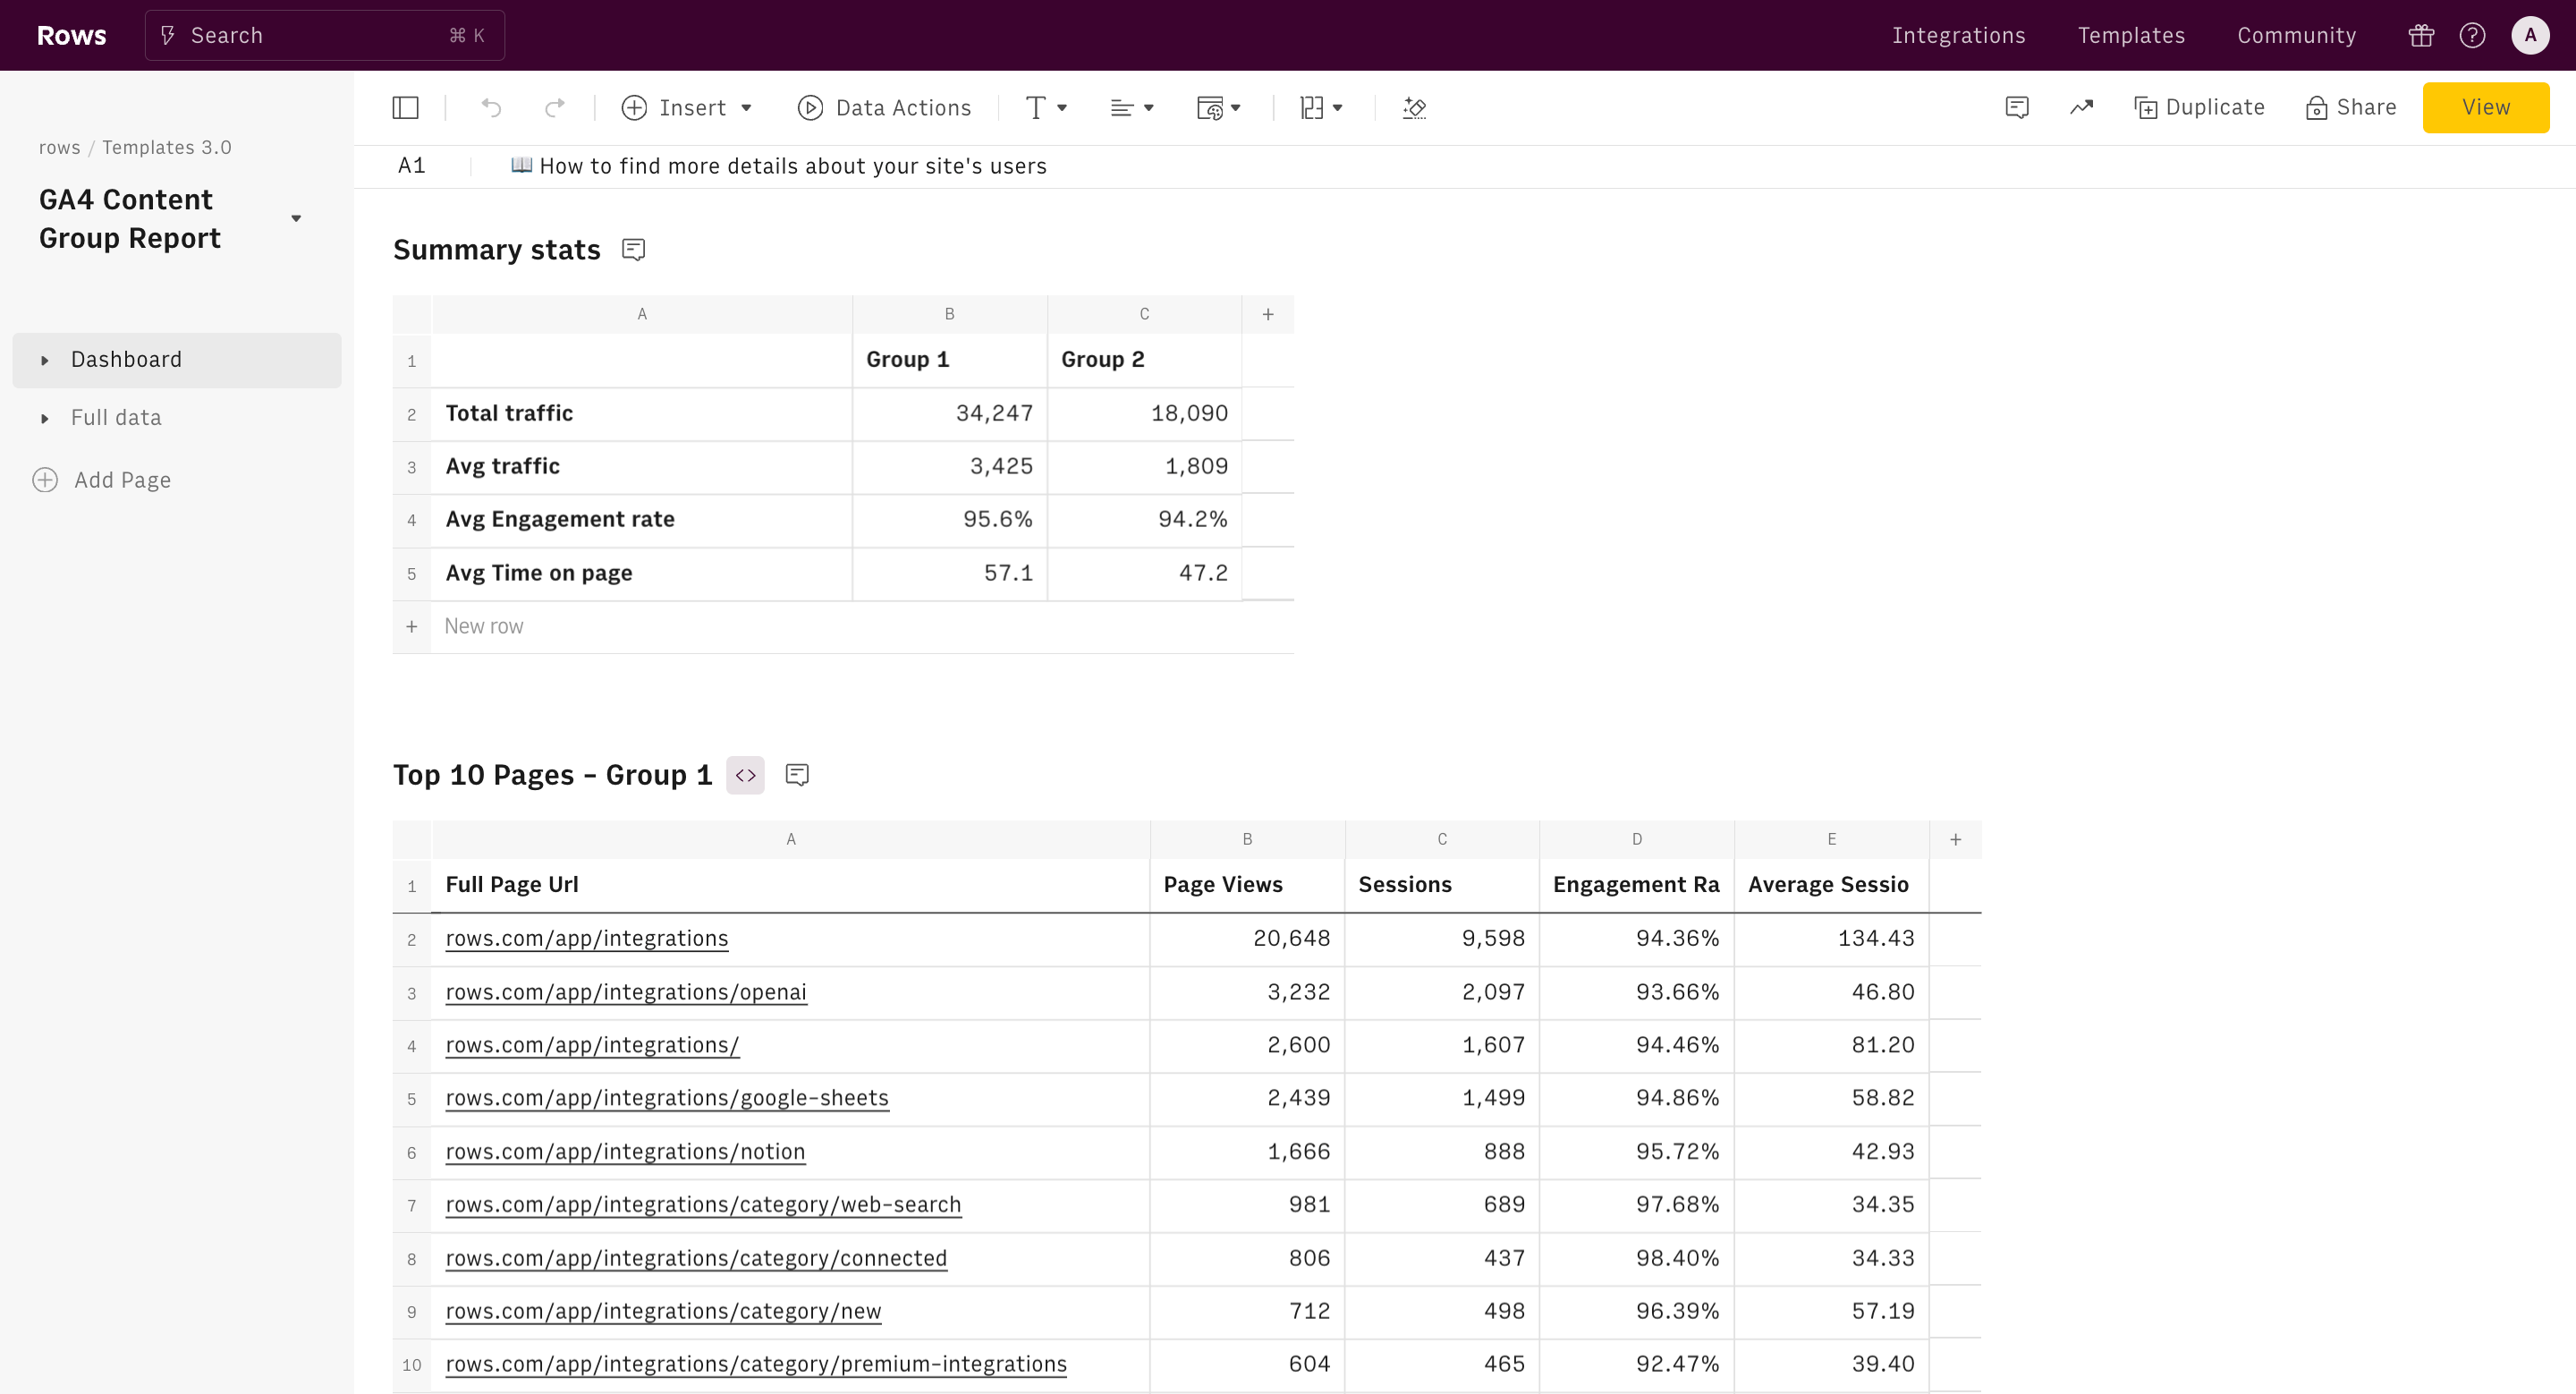
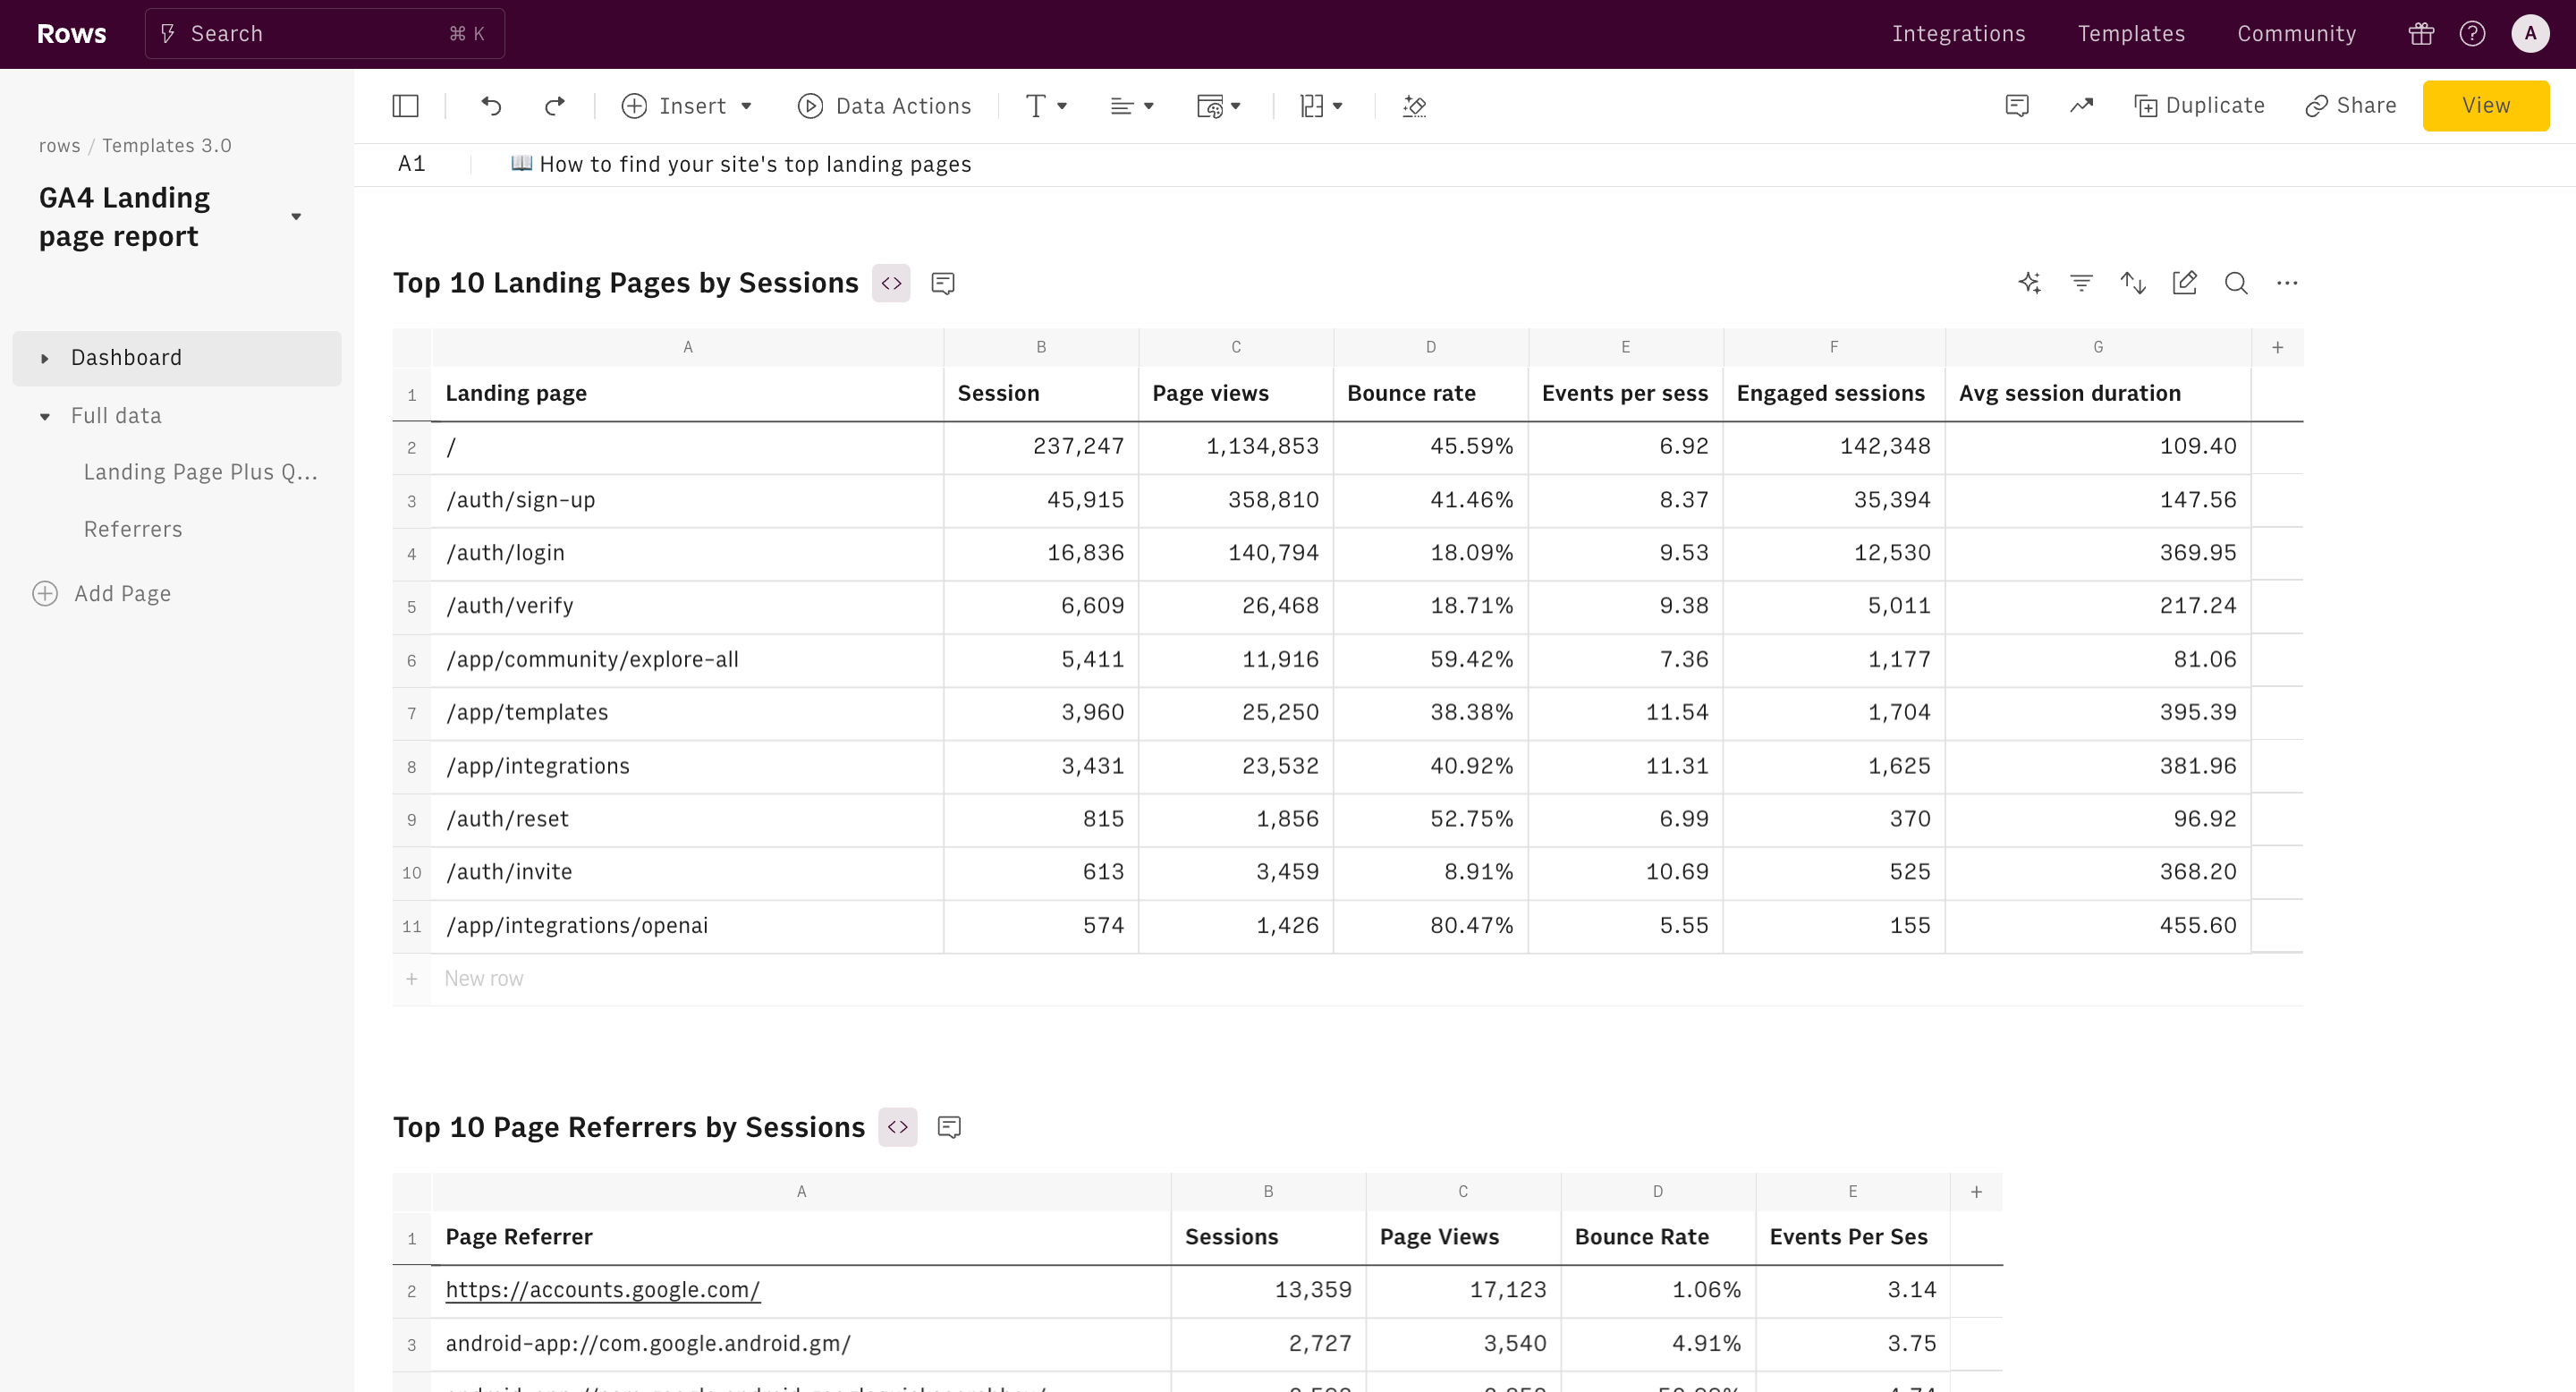
- Detailed Country Breakdown: Instantly see the distribution of your website's traffic across different countries and cities. This detailed report helps you identify key markets and emerging trends.
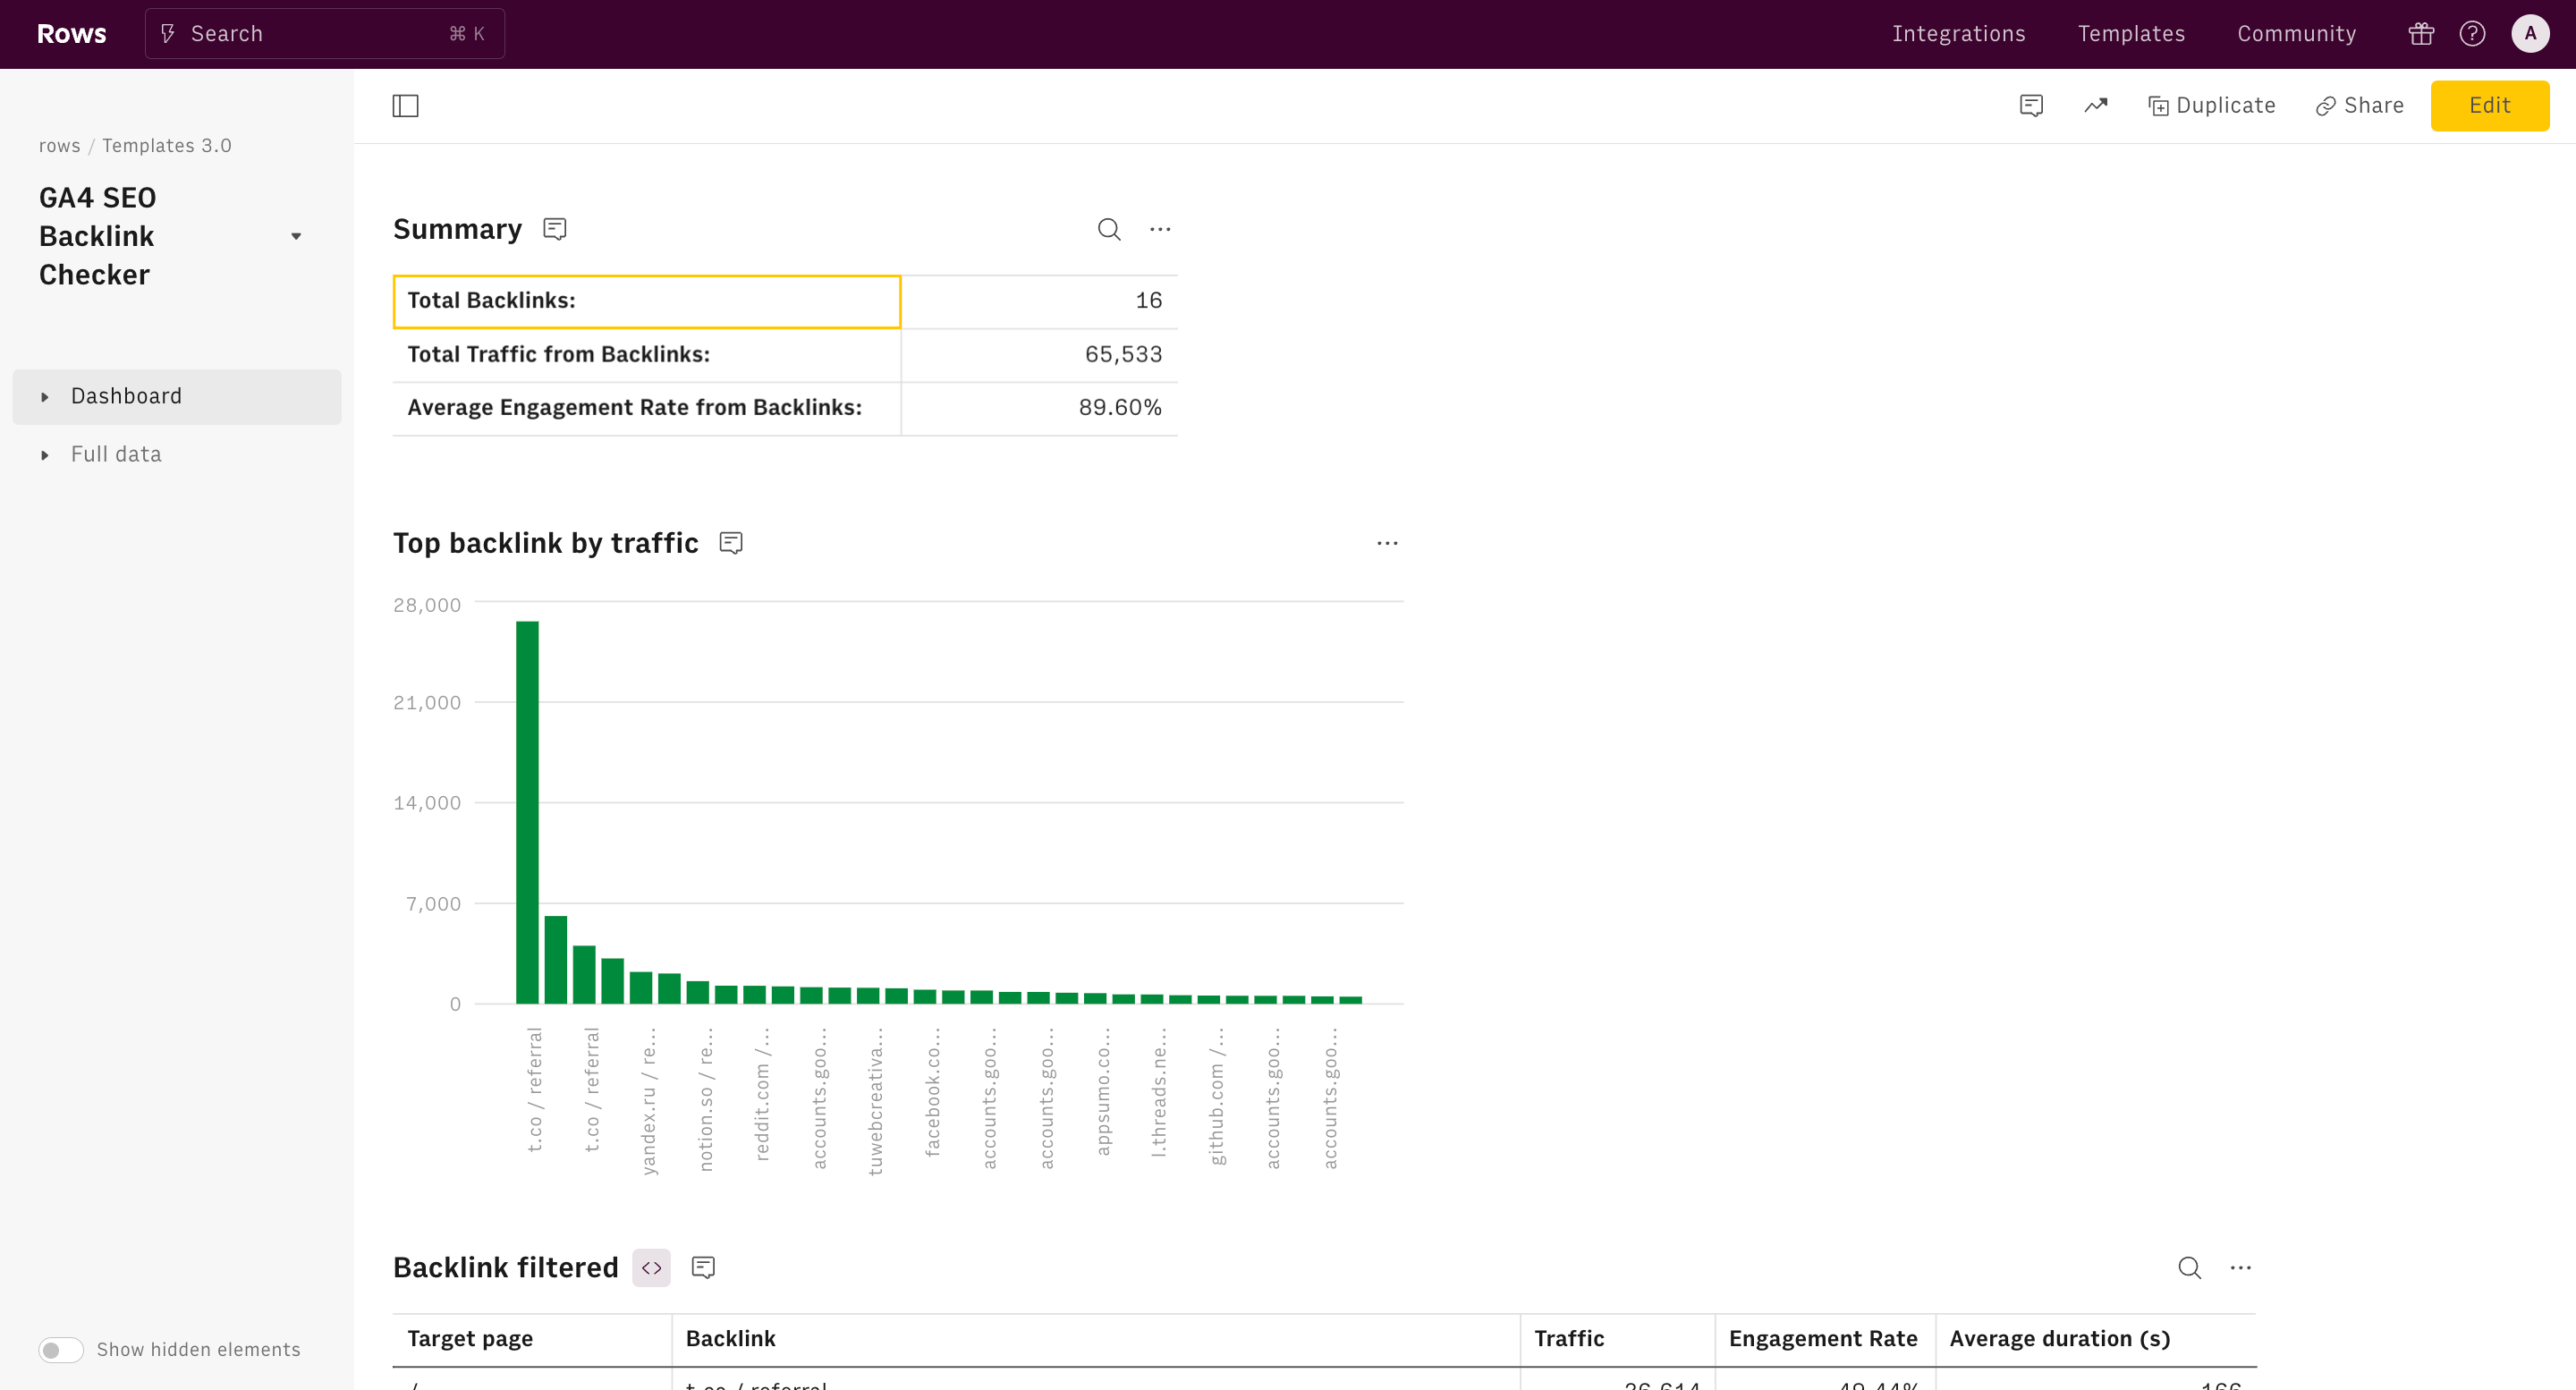
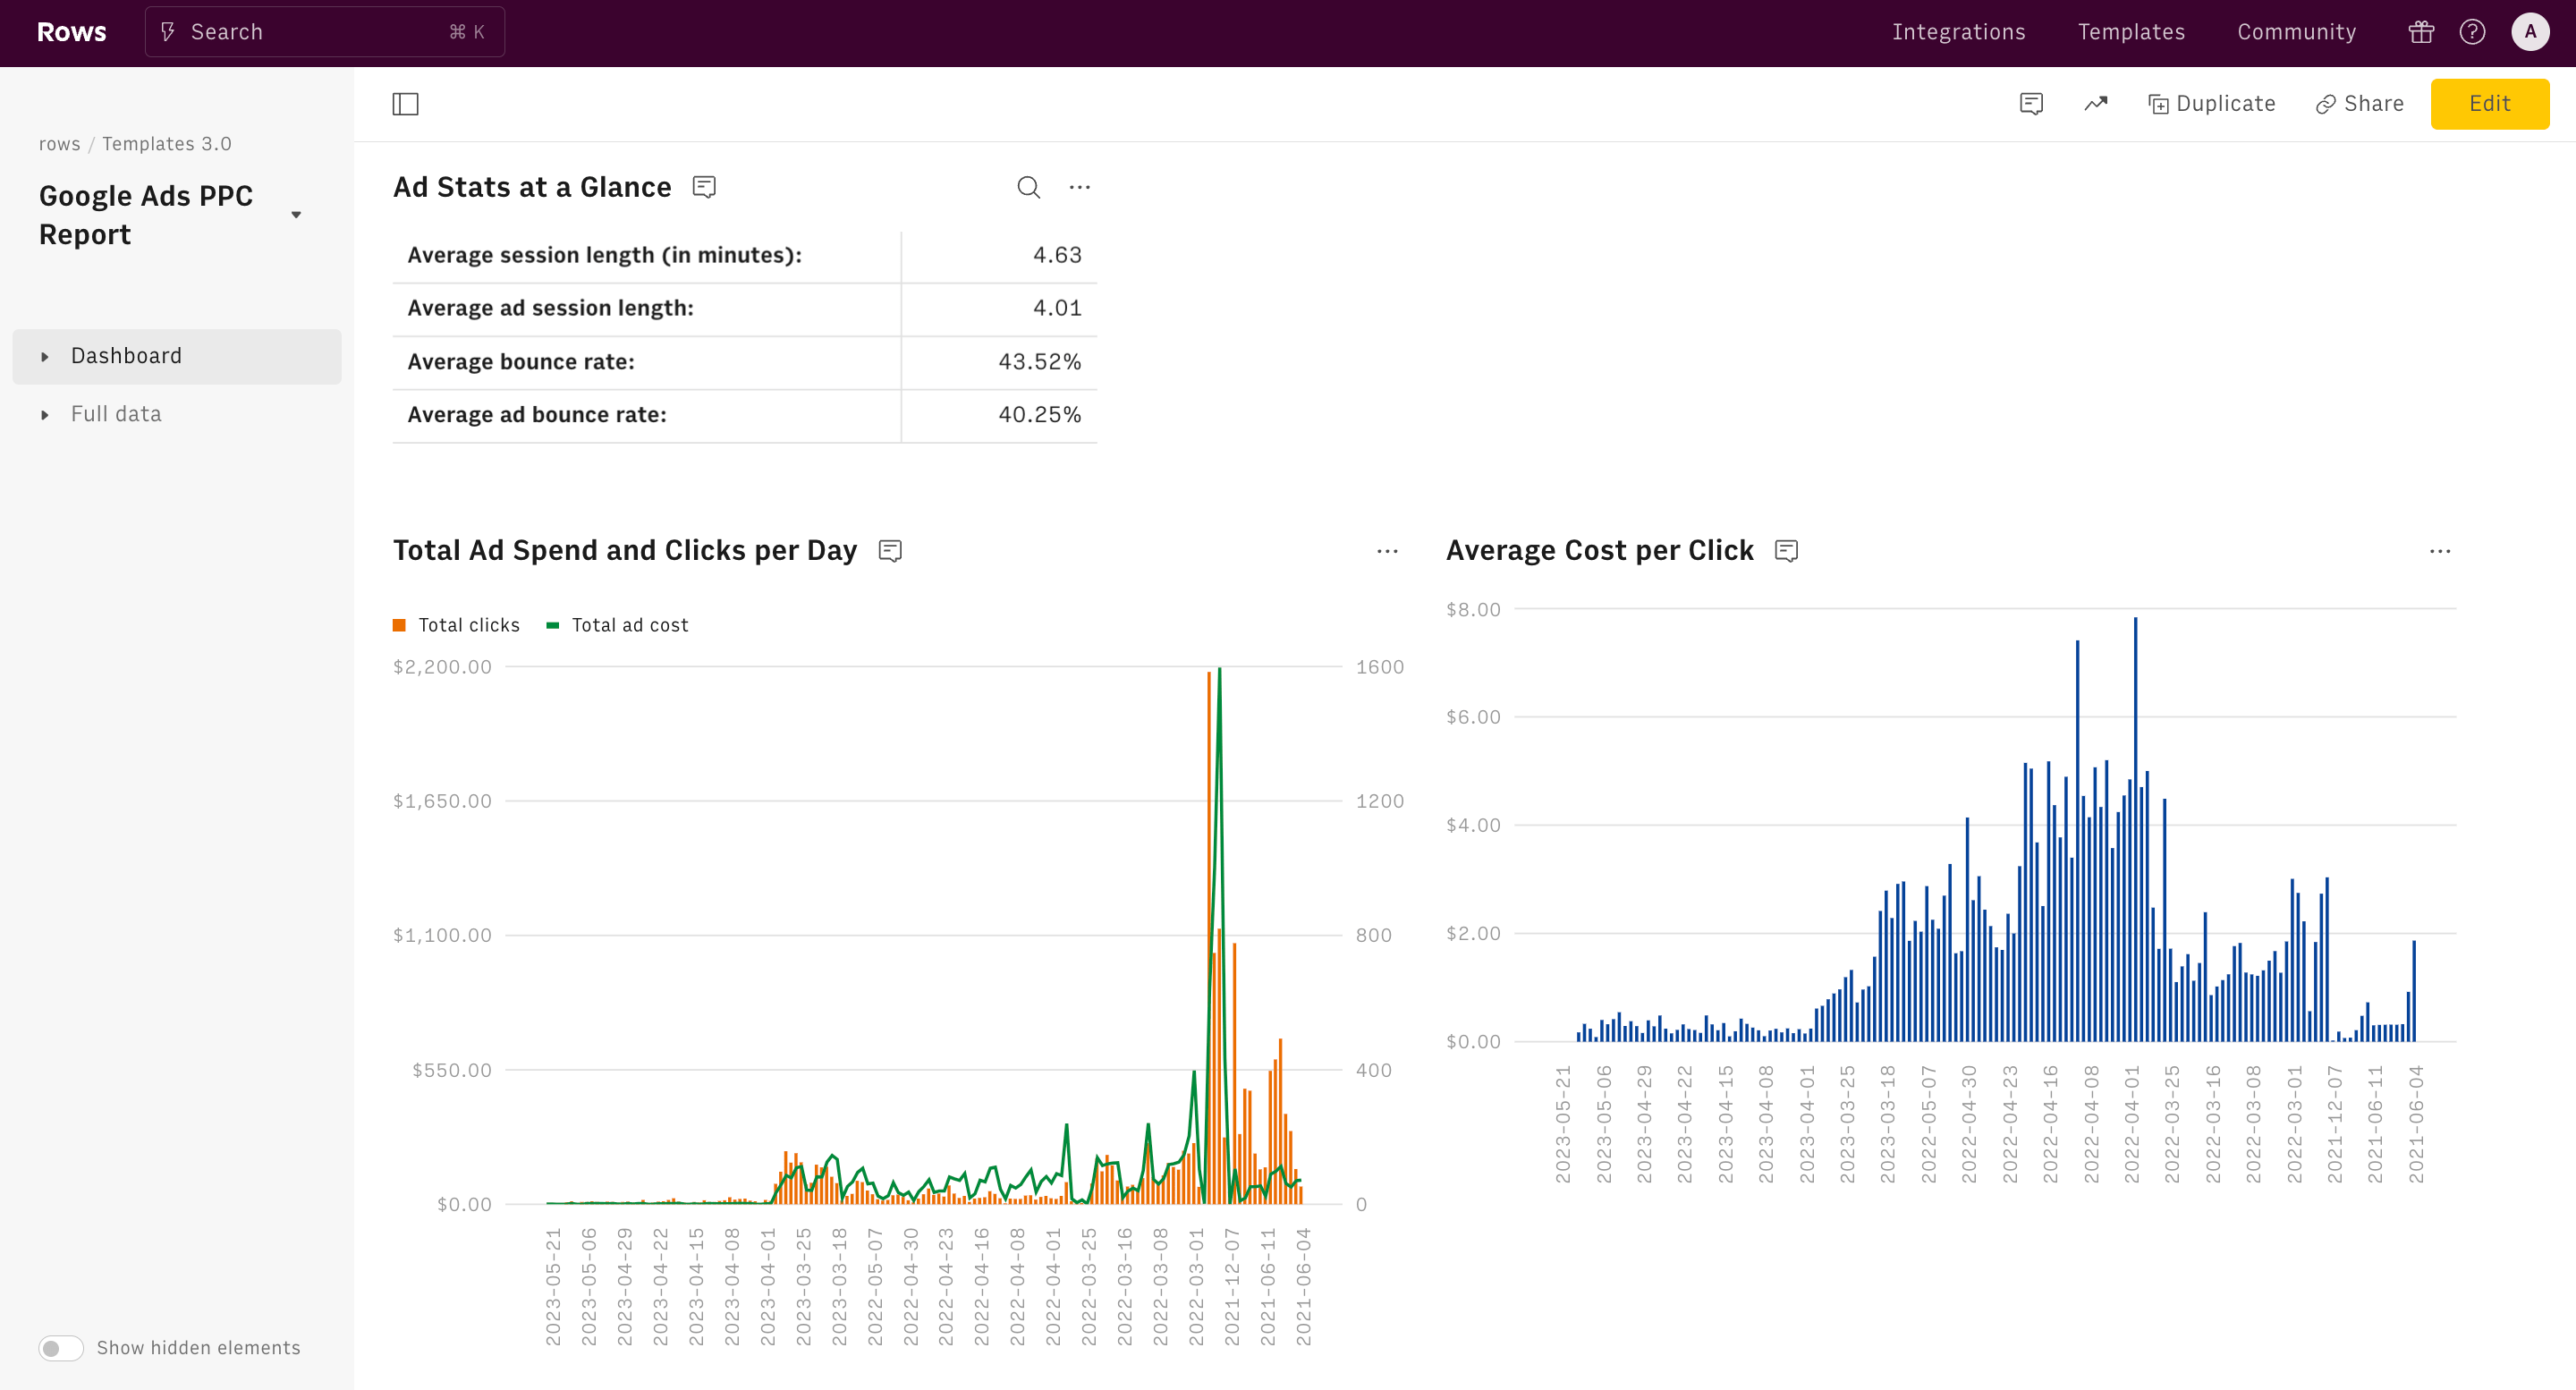
- Top 10 Countries Chart: A clear, visual representation of the top 10 countries driving meaningful traffic to your site.
- Top 10 City Chart: A clear, visual representation of the top 10 city driving meaningful traffic to your site. Quickly spot the most significant sources of your web traffic and make data-driven decisions.
Practical Use Cases
Digital marketers can use this report to fine-tune their international campaigns, targeting high-traffic regions more effectively.
Business owners can identify key markets for expansion, while data analysts can leverage the detailed insights to provide strategic recommendations.
Whether you’re looking to optimize your ad spend, personalize content for different regions, or simply understand your audience better, the Google Analytics 4 Country Report is an indispensable tool for your success.
How it works


How it works
Get started
Click on 'Use template' and start using it right away. No forms, no signup. Your data first.
Connect your Google Analytics account
Once landed on the spreadsheet, follow the instructions to connect the required integration and pick your account.
Customize the template and schedule refresh
Once the integration has been connected, all tables will update automatically with your own data. Click on 'Edit Source' to change the retrieved data and automate the data refresh. You can then insert a chart or a pivot table, add a column or personalize formats, using all the regular functions and shortcuts that make spreadsheets great.
Embed tables and charts
Click on the option menu to embed tables and chart on your Notion, Confluence or any other iframe-ready documents.


Questions and answers
Can I use Rows for free?
More than a Google Analytics 4 Country Report
Rows is your new AI Data Analyst. It lets you extract from PDFs, import your business data, and analyze it using plain language.
Signup for free

Import your business data
Extract from PDFs and images, import from files, marketing tools, databases, APIs, and other 3rd-party connectors.
Know moreAnalyze it with AI
Ask AI✨ any question about your dataset - from VLOOKUPs to forecasting models - and surface key insights, trends, and patterns.
Know moreCollaborate and Share
Seamlessly collaborate and share stunning reports with dynamic charts, embed options, and easy export features.
Know more