Intro
With a 92% market share, corresponding to over 8 billion searches per day, Google is by far the world’s favorite gateway to the Internet. Like it or not, it became pivotal for any internet business to accurately monitor and optimize its presence and visibility on the search engine.
Google itself offers a solution for this: Search Console, a free dashboard to monitor all the main search KPIs of your website.
However, whenever you need an actionable report, chances are, you merge those data into a spreadsheet: export from Google Search Console and import as a .csv file. Static, manual, time-consuming,
In this short guide, we’ll walk you through everything you need to generate a dynamic report that encompasses all the main KPIs of your website search performance, in a spreadsheet.
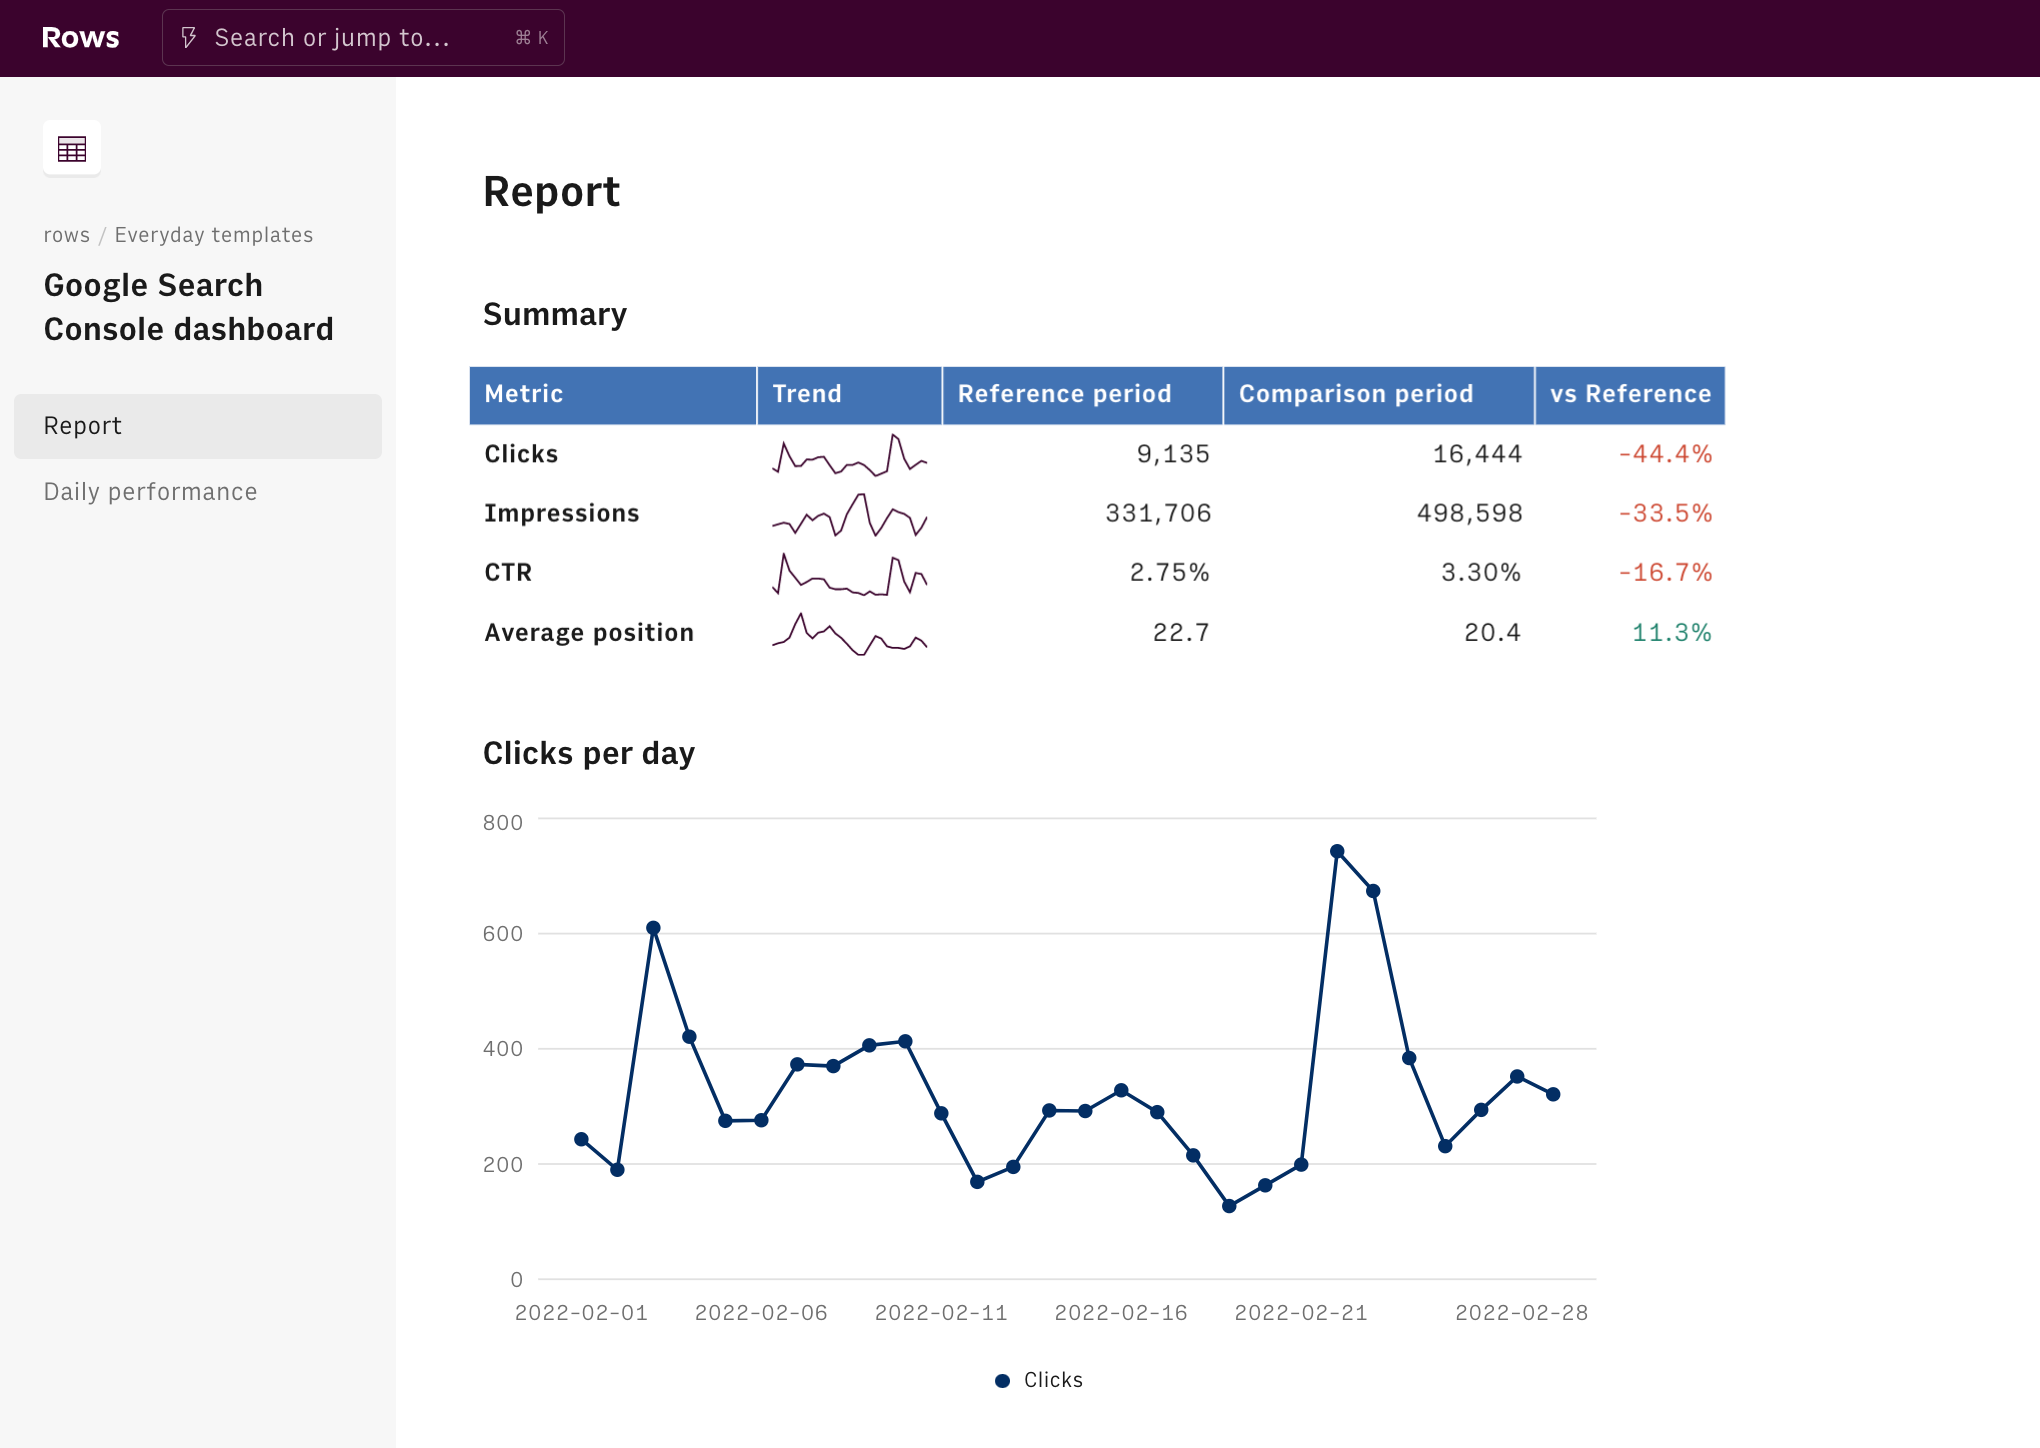
This is a sneak peek of what you will get:
What is Google Search Console
Google Search Console is a free tool designed by Google to help any website's owner to track and troubleshoot its appearance among Google search results. Among others, it allows you to quantify the amount of search traffic and monitor the keywords that led it to your website, along with the respective click-through rate.
Five are the most important sections of Search Console:
- Submit sitemaps. A sitemap is an XML file that serves as a table of contents of your website. It is used by Search Engines to index your website correctly and know what to crawl. Submitting and keeping it updated is important to optimize the so-called crawling budget, the time Google devotes to analyzing the content of your website.
- Error report. You should monitor this section frequently, as too many errors (such as 404 error or 500 error) among your website's pages can result in a sudden drop in valuable web traffic.
- Links report. This section is very relevant to monitor the results of your link-building activity: it offers you an overview of all main backlinks to your website together with anchor texts and other details.
- Performance report. Check all the main search KPIs, such as impressions, clicks, and position, breaking down data per page, keyword, device, etc
- Mobile usability report. Discover here if there are major flaws in your mobile usability or appearance, such as content wider than the screen, clickable elements too close to each other, text too small, ...
Creating a summary report
To understand how we’re going to use it, let’s go step by step.
Use our template at the following link Google Search Console Performance Report and save it in one of your workspace's folders.
This template allows you to monitor the search performance of your website, i.e. how your website behaves in Google's SERP - the search engine result page - in terms of impressions, clicks, and position.
Let's reverse-engineer it together.
First of all, you need to enable Rows' data integration and connect your Google Search Console account to Rows. Click on the top modal and follow the instructions. The typical Google Auth page will open: enter your credentials and authorize Rows to retrieve your Google data. Make sure your website is correctly registered in your Google Search Console.
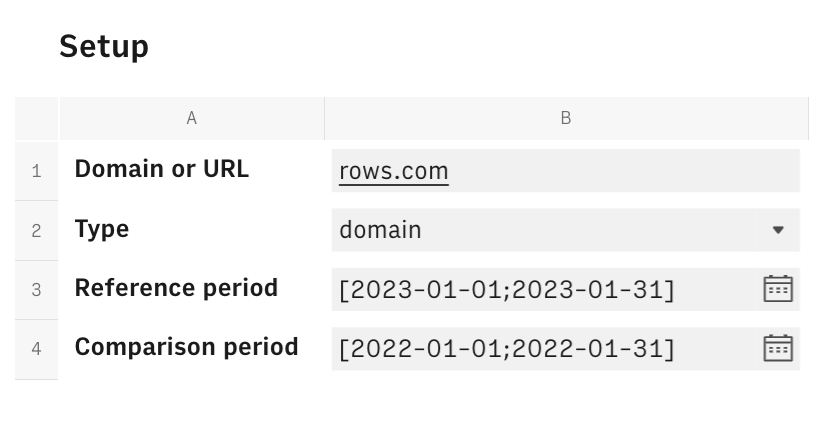
Now you are back on the spreadsheet, ready to set it up. Simply enter the domain of the website you want to examine, pick the type of property, Domain or URL, as it has been registered in Search Console, as well as the reference and comparison time frames you want to search in:
The Summary table below include a default set of KPIs for all the pages under the picked domain, in the chosen date ranges, displaying a sparkline in column B and percentage variations in column E.
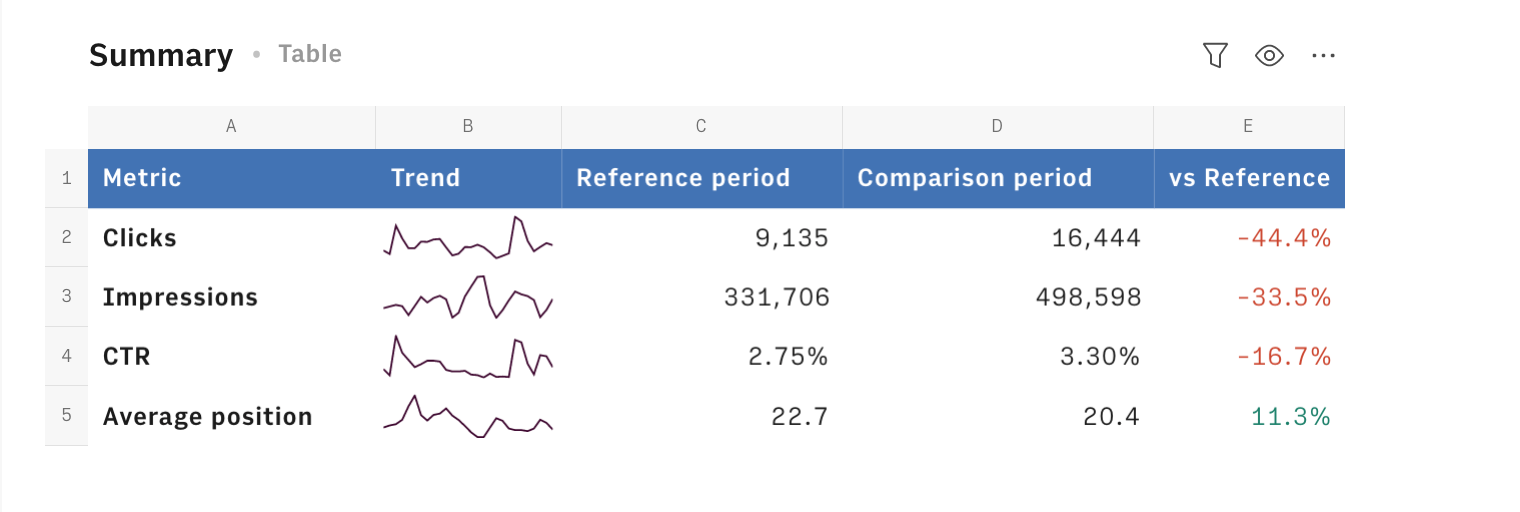
Each KPI is the output of the data cells B1 and B2 of the Summary Data table in the Data page. In Rows, a data cell stores more than a string or a number, the typical content of standard spreadsheets' cells.
In this specific case, they enclose our proprietary GET_WEBSITE_PERFORMANCE_SEARCH_CONSOLE() function, which pulls the data from Google Search Console for the reference and the comparison periods.
Let's have a closer look at it together. Click on the ... icon in the cell and choose Edit function. A panel will open on the right end side.
The function's inputs are:
- Domain or URL of the property defined in Google Search Console
- The target type of the property, domain, or URL
- Date range
- Dimensions, to group the performance metrics by, such as "country" or "page" Check the GCS documentation for further info.
- Filter the performance metrics of a specific value of the picked dimension, for example: "country contains USA"
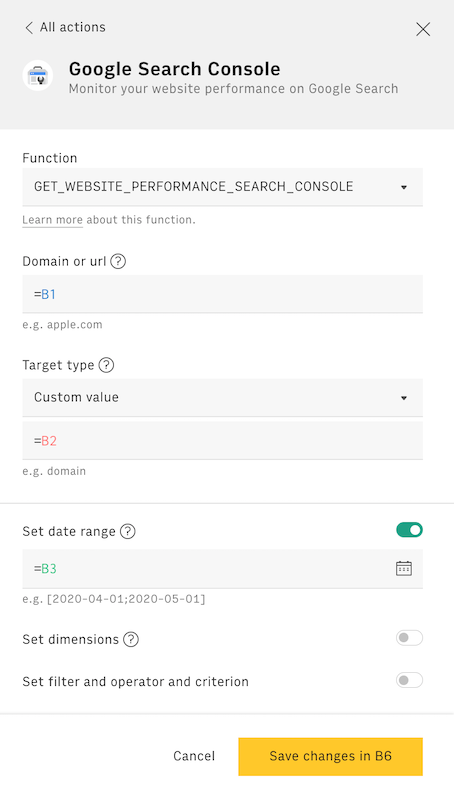
To build the summary report, we do not set any specific dimension, leaving the fourth and fifth above-listed arguments blank.
1 =GET_WEBSITE_PERFORMANCE_SEARCH_CONSOLE(B1,B2,B3)Then we employ the PARSE() to read and extract the desired metric, as follows:
1 =PARSE('Summary data'!B1,"[0].['clicks']")Creating a daily report
If you followed all the above points, you now have the summary table showing aggregated metrics for the selected time frames. We now focus on the daily section of the report.
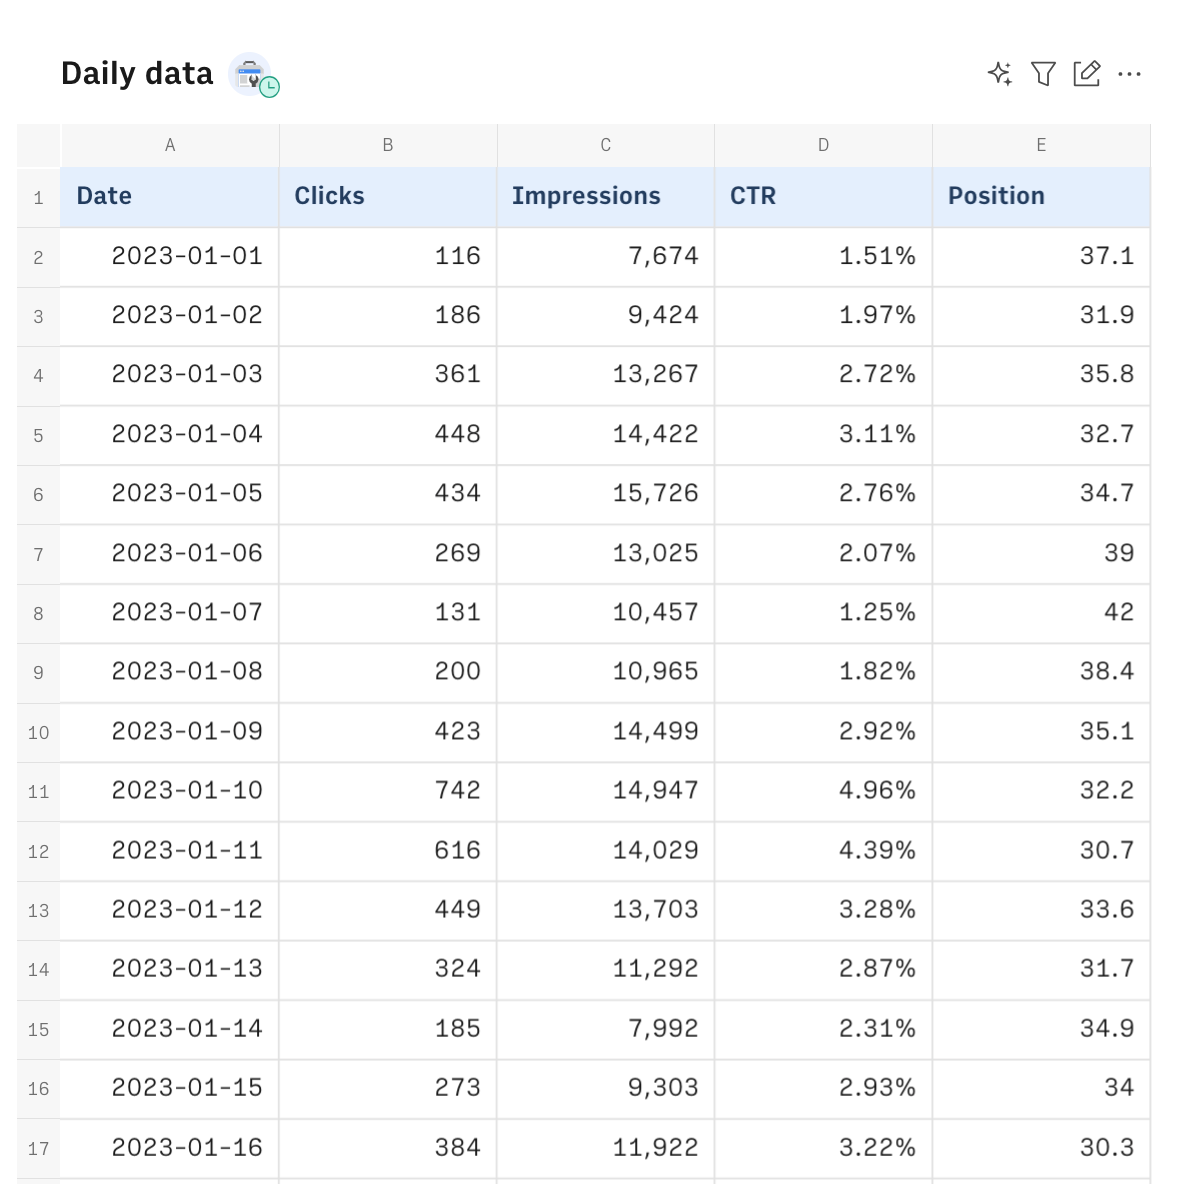
The 'Daily Data' table is a Data Table. It is originated using the same function used before to extract the Summary table's KPIs,GET_WEBSITE_PERFORMANCE_SEARCH_CONSOLE(), from the Data Actionn menu in the toolbar. The functions uses the same (compulsory) references in the Setup table, enclosed in cells B1,B2 and B3.
However, unlike the previous ones, this version uses "date" as a dimension (fourth argument), breaking down pulled data per day.
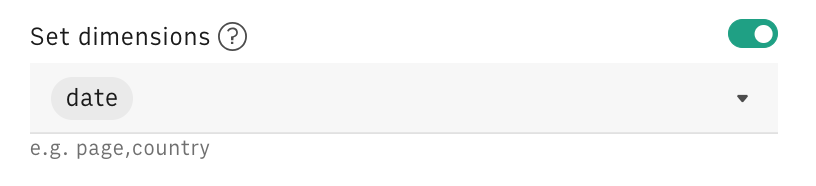
The formula behind the table reads
1=GET_WEBSITE_PERFORMANCE_SEARCH_CONSOLE(B1,B2,B3,"date")Embed into documents
Finally, if you are using Notion or any other internal tools that support iframes to build a report, you can embed any table or chart of this spreadsheet in your document. Just click on the ... icon in the top right corner of any table or chart and pick Embed. A modal will open, as follows:
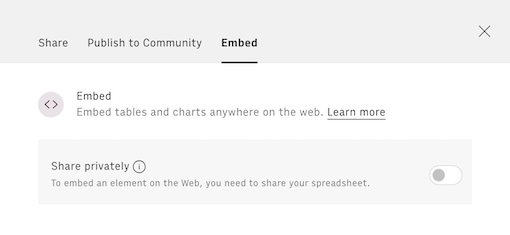
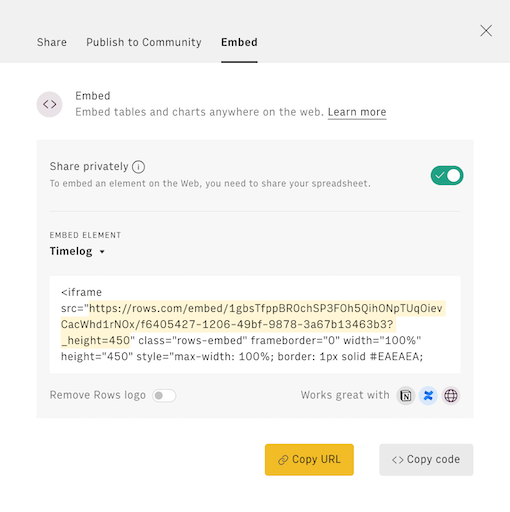
Before embedding, you need to grant access to it. To do so, toggle on the Share privately option and then hit the Copy URL button: your element is now ready to be pasted into your favorite tool.
This is how Rows embed looks on Notion:
You may also like
Check also
Interested in SEO? Check out our guides:
- Tracking keywords' performance with Search Console
- Planning link-building activity
- Tracking on-page SEO elements
- Tracking your competitors’ website loading performance with PageSpeed
- Auditing your website loading performance with PageSpeed
Discover our Marketing playbook.