How to Perform Statistical Analysis in Excel and Skip the Hard Parts with AI


You've got the data. You know there's an answer buried in those columns. But Excel's "Data Analysis" button? Nowhere to be found.
Well, that’s because you need to enable the Analysis ToolPak, run the five core tests (Descriptive, Regression, ANOVA, Correlation, t-Tests), and interpret what those output tables actually mean. That's how you turn numbers into decisions you can defend. We hope you’ve got time on your hands. And a handy data analyst at your side.
Thankfully, there is a better way. While Excel handles the final calculation, modern AI tools like Rows can tackle the tedious exploration upfront. You know, the part where you're poking around trying to figure out what to analyze in the first place. With AI, you’ll be able to find what you need much quicker. Plus, the AI will handle all syntax and complex equations for you.
Think of it this way: AI opens up the hard stuff (ANOVA, regressions, significance tests) to people who aren't data experts. You get the power without the technical barrier. We’re going to show you how. We’ll walk you through a more traditional analysis in Excel, before showing you how to skip the hard parts with AI. Let’s get started.
The 5-step statistical analysis framework
Okay, let’s just get one thing straight. AI isn’t going to fix nonsense, no matter how nicely you ask it. Think of yourself as an architect. If your blueprints don’t make sense, you can’t expect your builders to create your vision exactly as intended.a
It’s basically the same for AI.
The software won't stop you from running the wrong test, drawing the wrong conclusion, or presenting misleading results. That's why you need a framework, a repeatable process that keeps you honest.
Here's the five-step model that works whether you're clicking through Excel's Analysis ToolPak or typing questions into an AI tool.
Define the research question. Get specific. "Did the Q3 marketing spend increase sales?" is different from "Is there a relationship between spend and sales?" The first question requires a before-and-after comparison. The second requires you to evaluate relationships for correlation or regression. Wrong question = wrong test = wrong answer.
State your hypotheses. Every statistical test compares two statements: the null hypothesis (nothing changed, no difference, no relationship, e.g., "Marketing spend had no effect on sales") and the alternative hypothesis (something did change, there is a difference, e.g., "Marketing spend increased sales").
Check your data. Before you run anything, make sure your data is clean: no merged cells, consistent date formats, variables in columns with observations in rows, headers in the first row only, and no blank rows in the middle of your dataset. Excel's Analysis ToolPak throws cryptic errors when data is messy, so you have no choice but to be a data janitor on a daily basis.
Select and run the right test. Match your business question to the correct Excel tool. We'll cover this in detail in the next section, but here's the shortcut: If you're comparing groups, use t-Tests or ANOVA. If you're predicting an outcome, use regression. If you're summarizing data, start with descriptive statistics.
Interpret the output. This is where most people get stuck. Excel spits out tables full of numbers: p-values, F-statistics, confidence intervals. If your p-value is less than 0.05, you've got statistical significance. That means if there were truly no effect, you'd see results this extreme less than 5% of the time, so the pattern is unlikely to be random chance alone. However, the interpretation is all left to you – Excel just gives you the number. An AI analysis tool like Rows explains what all that means for your specific case in plain English.
Decision matrix: Which Excel tool matches your goal?
Far from being just another alternative to Google Sheets, Excel comes with a ton of tools to help you analyze your spreadsheets. Not sure which Excel tool to use? Match your goal to the right analysis type:

Descriptive: Use descriptive statistics from the Analysis ToolPak. This summarizes your data with mean, median, standard deviation, and distribution shape.
Inferential: Use t-Tests or ANOVA. These tell you whether differences between groups are real or just random noise.
Predictive: Use Regression or What-If Analysis. Regression forecasts outcomes based on relationships. What-If explores scenarios like "At what price do we break even?"
Exploratory: Use Analyze Data (Excel's built-in AI) or Rows AI. These help you spot patterns, trends, and outliers when you're not yet sure what you're looking for.
Causal: Excel can’t prove causality alone. Correlation isn't causation. Proving cause-and-effect requires experimental design: Control groups, randomization, and rigorous methodology.
While we’re at it, let’s give you a quick pro-tip: Rows' built-in Python integration can run advanced significance tests and clustering.

Your new AI Data Analyst
Extract from PDFs, import your business data, and analyze it using plain language.
Try Rows (no signup)How to set up Excel to perform statistical analysis
To perform statistical analysis in Excel, you’ll need to enable the Analysis Toolpak. This is easy for the most part, as you’ll see from our step-by-step. Do keep in mind, however, that it’s different for Mac and Microsoft operating systems.
We’ll start with Microsoft:
Open Excel and click File in the top-left corner.
Select Options at the bottom of the menu.
Click Add-ins in the left sidebar.
At the bottom of the window, find the Manage dropdown and select Excel Add-ins, then click Go.
Check the box next to Analysis ToolPak and click OK.
Now go to the Data tab. You should see a Data Analysis button on the far right. If it's there, you're ready.
And now for Mac:
Click Tools in the top menu bar.
Select Excel Add-ins.
In the Add-ins available box, check Analysis ToolPak and click OK.
Data hygiene: Why Excel throws cryptic errors
Excel's Analysis ToolPak is picky about data structure. That means your formatting has to be in tip-top shape; otherwise, you’ll spend hours decoding error messages.
Follow these rules:
Variables in columns, observations in rows: Each column represents one variable (Sales, Region, Date). Each row represents one observation (a single transaction, customer, or data point).
Headers in the first row only: Label your columns in row 1. Don't use multiple header rows, or Excel will treat them as data.
No merged cells: Unmerge everything before running analysis.
Consistent formatting: All dates should use the same format. All numbers should be actual numbers, not text that looks like numbers.
No blank rows in the middle of your dataset: This is the sneaky one. The Analysis ToolPak often throws ambiguous errors when a blank row appears halfway through your data. Delete any empty rows before you start.
Did you know? Excel can handle over 1 million rows (it can go up to exactly 1,048,576, actually), but if you’re working with reasonably large datasets, performance starts to slow. For massive datasets, consider sampling your data or using specialized tools.
If all of this data prep sounds tedious, that's because it is. With an AI-powered tool like Rows, you can skip the formatting gymnastics entirely. Just upload your data as-is, and AI figures out the structure for you.
Summarize your data: Descriptive statistics
Before you run any statistical test, you need to understand what you're working with.
Descriptive statistics give you the baseline: What's the average? How spread out is the data? Are there any weird outliers that'll mess up your analysis?
If that sounds like something you need, read along.
⚠️Disclaimer: For the rest of this article, we will be showing examples from the Mac version of Excel. If you’re using Windows, some buttons might be in slightly different places.
The tool: Data Analysis > Descriptive Statistics
Here's how to run it:
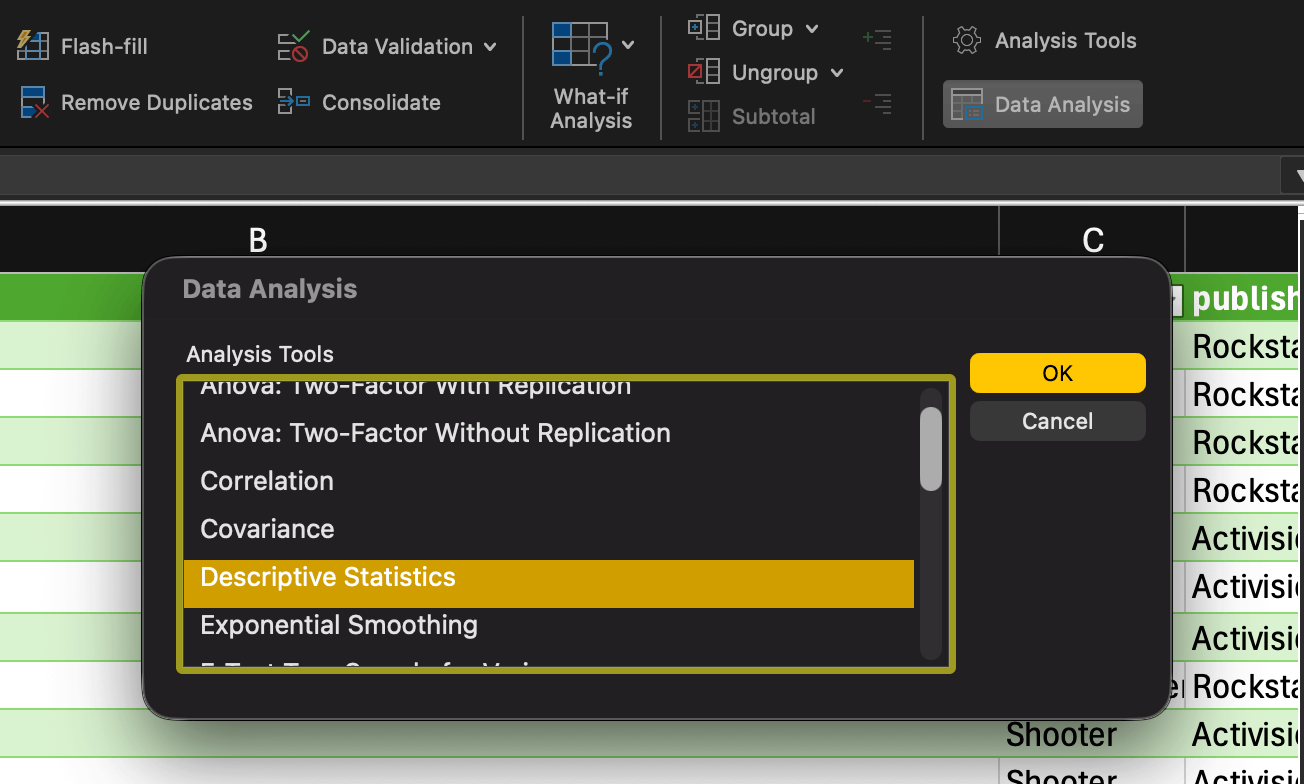
Click the Data Analysis button on the Data tab.
Select Descriptive Statistics from the list and click OK.
3. Set your Input Range to the data you want to analyze (including the header).

4. Check Labels in First Row if your data has headers.
5. Choose an Output Range (where you want the results to appear).

6. Check Summary statistics and click OK.

With that done, Excel should generate a table with key metrics for your dataset.

The output: What these numbers actually mean
Here's what you're looking at:
Mean: The average. Add up all the values and divide by how many there are. Useful for getting a general sense of your data, but sensitive to outliers.
Median: The middle value when you sort your data. If you have extreme values (like one month with crazy high sales), the median tells you what's "typical" better than the mean does.
Standard deviation: How spread out your data is. Low standard deviation = data points cluster tightly around the mean. High standard deviation = data is all over the place.
Skewness: Tells you if your data leans left or right. Positive skewness means you have a long tail of high values. Negative skewness means a long tail of low values. The closer the skewness is to zero, the more symmetrical the data.
Business context: Spotting problems before they wreck your analysis
Let's say you're analyzing monthly sales data.
You run Descriptive Statistics and notice the mean is $50,000, but the median is $42,000. That's a red flag. It suggests that one or two months with unusually high sales are pulling the average up.
Check your skewness. If it's positive, you've got outliers on the high end.
Now you know: Before you run a t-test or regression analysis (more on these later), you need to decide whether to keep those outliers or remove them. Outliers can make your results misleading if they're anomalies (like a one-time promotional spike). But if they're legitimate data points, removing them could hide real trends.
The shortcut: Excel's Analyze Data for quick visual summaries
What's the fastest way to analyze data in Excel? Use the Analyze Data feature.
Here's how:
Go to the Data tab.
Click Analyze Data on the far right.

3. A panel opens on the right side with automatic insights, charts, and summaries.

You can also type questions in natural language. As we’re using a spreadsheet of the best-selling video games, we used "What's the average total sales by genre?" and Excel generated an answer.

Cool, right? For the most part, yes, except for the fact that Excel's native AI is static. It gives you snapshots, a chart here, a summary there, but it doesn't learn from your follow-up questions. You can't have a conversation with it.
For true conversational analysis, where you can ask follow-up questions and get intelligent responses, you need something built for iteration. Something like Rows – a modern AI data analyst platform that gives you the autonomy to understand and present your data. For now, however, let’s keep going with Excel.
Other analyses available in Excel: Key inferential tests
Now that we’ve covered some simple analysis, let’s show you what else you can do with Analysis Toolpak.
Correlation (finding relationships)
A correlation measures the strength and direction of the relationship between two variables.
The correlation coefficient ranges from -1 to +1, where values near +1 indicate a strong positive relationship (as one variable increases, so does the other), values near -1 show a strong negative relationship (as one increases, the other decreases), and values near 0 suggest no linear relationship.
Steps to run correlation analysis
Click the Data tab, then click Data Analysis.
Select Correlation from the list and click OK.
In the dialog box, set your Input Range to include all the columns you want to analyze (including headers).
Check Labels in First Row if your data has column headers.
Choose your Output Range (where you want the correlation matrix to appear).
Click OK.
Excel generates a correlation matrix showing the relationship between each pair of variables. Each cell displays a coefficient between -1 and 1.
Using our data set, we wanted to see whether there was any relationship between the North American, Japanese, and PAL regions.

Interpretation key
Whether a correlation is ‘strong’ depends on the context. As a rough guide, values near ±1 show strong linear relationships, while values near 0 show weak ones. From this table, we can see that there is some correlation between PAL and NA sales, but JP sales are completely uncorrelated with either market. That could mean NA and Pal markets have similar tastes in video games.
❗Critical reminder: Correlation shows the strength of the relationship, not causation. Two variables can correlate strongly without one causing the other.
Regression (predicting trends)
Regression analysis helps you understand how one or more independent variables (X) influence a dependent variable (Y), and allows you to forecast future values based on historical patterns.
Steps to run regression analysis
Click the Data tab, then click Data Analysis.
Select Regression from the list and click OK.
Set the Input Y Range to your dependent variable column (the outcome you're trying to predict or explain).
Set the Input X Range to your independent variable column(s) (the factors that might influence Y).
Check Labels if your first row contains column headers.
Choose your Output Range for the results table.
Click OK.
Excel produces a detailed output table with multiple statistics. You should see something like this:

Interpretation key
R Square measures how well your model fits the data. An R Square of 0.75 means 75% of the variation in your dependent variable is explained by your independent variable(s). Higher values indicate a better fit, but unusually high values, above 0.95, warrant a closer look. They could reflect a genuinely strong relationship or signal issues like overfitting or data leakage.
Significance F tests whether your overall model is statistically valid. If this value is less than 0.05, your model is statistically significant at the 95% confidence level.
p-values (found in the coefficients table) show whether each individual variable matters. Technically speaking, it represents the probability of obtaining a coefficient estimate at least as extreme as the one observed, assuming that the true coefficient is zero (i.e. there is no effect). You want this to be as low as possible, that's why a standard p-value is picked below or equal to 0.05, and it indicates that a specific variable has a statistically significant effect on your outcome (i.e. its coefficient is not zero).
ANOVA (analysis of variance)
ANOVA tests whether the means of three or more groups differ significantly. While a t-Test compares exactly two groups, ANOVA handles multiple groups simultaneously.
Two types of ANOVA in Excel:
ANOVA: Single Factor tests one independent variable across multiple groups. This is the most common type.
ANOVA: Two-Factor with Replication tests two independent variables and their interaction effect. Your data must be organized in a specific table format with one variable defining columns and the other defining rows.
Steps to run ANOVA: Single Factor
Click the Data tab, then click Data Analysis.
Select Anova: Single Factor from the list and click OK.
Set the Input Range to include all your groups' data (each group in its own column or row).
Choose Grouped By: Columns or Rows, depending on your data layout.
Check Labels in First Row if applicable.
Set your Alpha level (typically 0.05 for 95% confidence).
Choose your Output Range.
Click OK.
If all is well, you should end up with tables like this:

Interpretation key
Look at the F statistic and F crit (F critical value) in the output table. If F is greater than F crit, the group means differ significantly.
Alternatively, check the p-value. If the p-value is less than 0.05, at least one group mean differs significantly from the others.
Keep in mind, ANOVA only tells you that a difference exists somewhere among your groups. It doesn’t tell you which specific groups differ from each other. Identifying those specific differences requires post-hoc tests, which Excel's Analysis ToolPak does not provide.
This is one area where AI data analysis tools shine. In Rows, you can simply ask "Which regions have significantly different sales from each other?" and get a direct answer with the relevant post-hoc comparisons, no extra setup required.
t-Tests (A/B testing)
Here’s where things get a little more complicated… A t-Test compares the means of exactly two groups to determine if their difference is statistically significant. Use t-Tests when comparing two groups, such as before-and-after measurements or two different conditions.
Modern statistical practice doesn’t require checking variance equality first. You can skip the traditional F-test entirely and go straight to the more reliable version of the t-Test, called Welch’s test. Because it stays accurate even when the groups have unequal variances or non-normal data, it’s more useful in most real-world situations.
Here’s how to run it:
Go to Data > Data Analysis.
Select t-Test: Two-Sample Assuming Unequal Variances and click OK.
Set Variable 1 Range and Variable 2 Range to your two groups.
Check Labels if your first row contains headers.
Set Hypothesized Mean Difference to 0 if it doesn’t already default to that value.
Choose your Output Range.
Click OK.
Interpretation key
Use the two-tailed p-value if you're checking for any difference.
Use the one-tailed p-value only if you predicted the direction in advance.
If the p-value is below 0.05, the groups differ significantly.
More Analysis ToolPak tools worth knowing
We’ve shown you the most common Analysis Toolpak tools you’re likely to use. But, there’s still a lot more we haven’t mentioned in depth… mostly because we care about our sanity and yours. Check them out:
Tool | Purpose | When to Use |
|---|---|---|
F-Test Two-Sample for Variances | Compares variances between two groups | Before running t-Tests to determine which variant to use; testing if two groups have similar spread |
Exponential Smoothing | Forecasts future values based on weighted averages | Time series forecasting where recent data points matter more than older ones |
Histogram | Creates frequency distribution with customizable bins | Visualizing data distribution; identifying patterns, clusters, or outliers |
Sampling | Extracts random or periodic samples from datasets | Working with large datasets where analyzing the full population isn't practical |
Random Number Generation | Generates random numbers from various distributions | Creating test datasets; Monte Carlo simulations; statistical modeling |
Covariance | Measures how two variables change together | Similar to correlation but produces unstandardized values; used in portfolio analysis |
Fourier Analysis | Decomposes data into frequency components | Signal processing; identifying cyclical patterns in time series data |
z-Test | Tests means when population variance is known | Rare in business contexts; typically used when you have large samples and known population parameters |
Now, keep in mind, these additional tools handle specialized scenarios you may encounter as your analytical needs grow. Generally, these function much the same way as the tools we examined previously, so your workflow should remain very much the same.
Forecasting with what-if analysis
Excel's What-If Analysis tools help you answer forward-looking business questions by testing different scenarios. Unlike statistical tests that analyze past data, these tools let you model future outcomes.

Goal Seek works backward from a desired result to find the input needed to achieve it. If you want to know "At what price point do we break even?" or "How many leads do we need to cover our ad spend?", Goal Seek calculates the exact input value that produces your target outcome.
Scenario Manager lets you create and compare multiple scenarios side-by-side. You can define different sets of input values, best-case, worst-case, most-likely, and see how each affects your outcomes in a summary table. This makes it easy to compare high and low seasonality, or optimistic and conservative growth assumptions.
Unfortunately, while these tools are precise, they're slow. You need to manually define each scenario, set up every formula relationship, and specify exact inputs before you can see results. They work well when you know exactly what you want to test, but they don't support open-ended exploration.
This is the point where you basically need a data analyst, and crucial information is locked behind a bottleneck. But it doesn’t have to be that way, especially if you have a tool like Rows powering your spreadsheets. Because at that point, you can actually start conversing with your data (and it’s not as boring a conversation as you might think!).
Your new AI Data Analyst
Extract from PDFs, import your business data, and analyze it using plain language.
Try Rows (no signup)Skip the hard parts and cut your analysis time with Rows AI
First things first: We’ve helped you figure out how to perform statistical analysis on Excel… But that doesn’t mean it’s a statistical analysis tool.
Excel is a spreadsheet application with statistical capabilities, not dedicated statistical software. The Analysis ToolPak handles basic to intermediate analysis well, but Excel places a double burden on users: You need to know both the statistical theory (which test actually applies?) and the tool mechanics (how to configure the dialog boxes without error).
And if you don’t know what test to run, be prepared to burn a few hours. Excel forces you to manually set up each analysis, check the output, adjust your approach, and repeat. Simple questions like "Is there a pattern here?" can require a lot of setup.
That’s where you need AI data analysis to help you cut down the time you spend in front of spreadsheets, wondering what calculation to use next.
How Rows AI Analyst accelerates exploration
So, let’s talk about Rows and its biggest benefit: It’s not Excel. If you’re not someone who regularly uses Excel, you may have been confused about how it was running those calculations, or whether you were making the right calculations in the first place. Unfortunately, even with all of the information we’ve provided here, it can be difficult to answer those questions.
Rows AI Analyst lets you ask questions in plain English and runs the analysis for you. For instance, we uploaded the video game sales CSV and asked the question: “Is there a correlation between games releasing near Christmas and higher sales?” We got this back as a response:

And from that, we got a small taste of Rows' built-in Python integration, because we wanted to test it with a fairly complex question using different data sets.

If you’re running significance tests, clustering, or want predictions, you can do it all without writing a single line of code. The AI Analyst handles the Python execution behind the scenes. It’s one of the reasons Rows is one of the best AI tools for small businesses. You don’t need a department of data analysts and coders to get data you can work with.
Your new AI Data Analyst
Extract from PDFs, import your business data, and analyze it using plain language.
Try Rows (no signup)Your path from data to defendable decisions
Statistical analysis is about building confidence in your decisions, not just running calculations. The five-step framework – define your question, state hypotheses, check data, run the test, interpret results – applies whether you're using Excel or AI tools.
While Excel's Analysis ToolPak is excellent when you need transparent, reproducible output for audits, regulatory reviews, or academic requirements… It can be tricky to use. Unless you’re someone who regularly uses Excel, you could be in for a rough time.
That’s where we recommend Rows AI Analyst for exploration. Instead of spending hours manually testing approaches and cleaning data, ask questions in plain English to find patterns and validate hypotheses quickly. This gives you autonomy over your data to generate insights without waiting for data teams.
Try a loginless session in Rows with a dataset you're currently analyzing. Ask the AI Analyst your questions and see how quickly you move from raw data to insights. No dialog boxes, no configuration, just answers.